Understanding the Use of Pharmacoeconomic Analysis to Assess the Economic Impact of Pharmacogenomic Testing
LEARNING OBJECTIVES
INTRODUCTION
Economics is the study of choosing a strategy amid limited resources or scarcity.1 In health care, there is limited resources for all the medical needs of patients. Therefore, a formal evaluation into the costs and benefits of drugs, interventions, and programs needs to be assessed in order to efficiently and equitably distribute limited resources. Pharmacoeconomics is the quantitative assessment of the costs and benefits associated with a treatment strategy.2 Similar to traditional economics, pharmacoeconomics assess the choices that a decision maker selects and the cascading costs and outcomes associated with that choice. What distinguishes pharmacoeconomics from traditional economics is the assessment of health weighted by costs. In economics, decision makers are only interested in the overall costs associated with a choice or strategy, whereas, in pharmacoeconomics, costs are weighed by the benefits or outcomes associated with the treatment strategy. Treatment strategy can be a health care program to prevent chronic disease, it could represent a new molecular entity (NME) entering the market, or it can represent a new diagnostic test that can improve outcomes or avoid adverse events. In either case, pharmacoeconomics provides a scientific and quantitative method for estimating the value of a treatment strategy weighted by the costs. There are many facets within pharmacoeconomics, of which one of the most promising is pharmacogenomic evaluation.
PHARMACOGENOMICS HISTORY
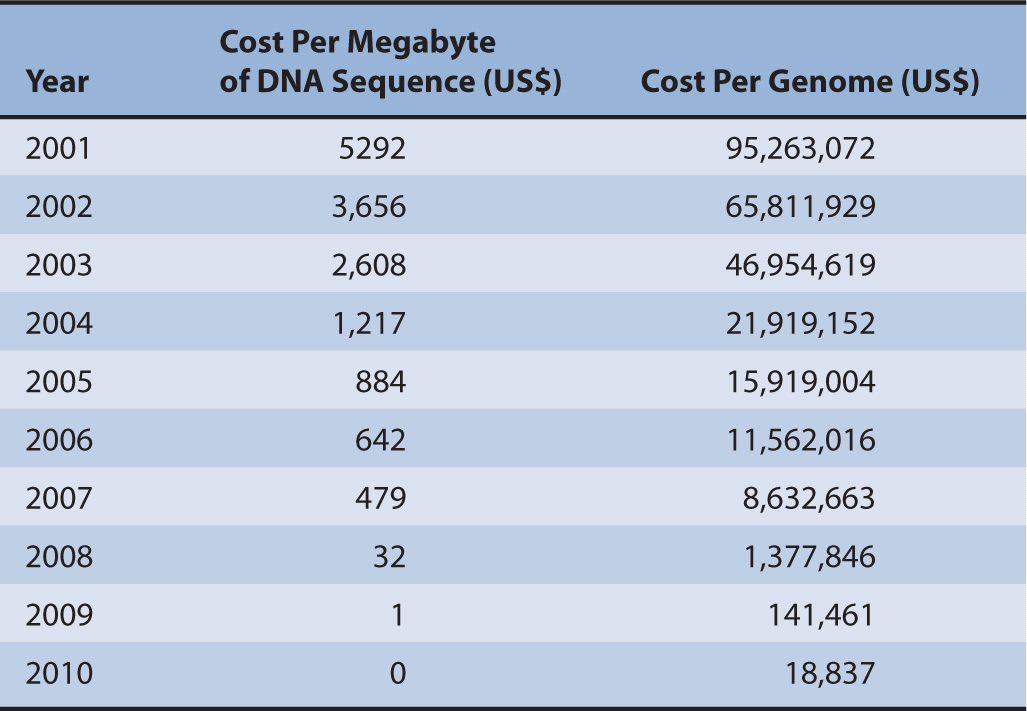
Costs of whole genome testing have decreased exponentially since 2008, 5 years after the first draft of the human genome was sequenced by the US Department of Energy and the National Institutes of Health (Table 10–1).3 It took 13 years for the first draft to be officially completed, which cost over $13 billion.3 It is estimated that by 2013, whole genome testing could cost as little as $100 as prices of reagents drop and the speed of sequencing technology grows.4 Currently, it is unknown how whole genome testing will affect the application of pharmacogenomics into clinical practice. Regardless, the information due to the advancements made through the Human Genome Project (HGP) has given us a basis by which we continue to understand how genetics affects disease, traits, and metabolism of medications. Obviously it is not feasible to test every patient’s genome. Therefore, methods are used to scan known areas of the genome for variations and are usually limited to scanning hundreds or thousands of base pairs. This type of technology allows for quicker and less costly method to identify mutations.
TABLE 10–1 Cost per megabyte of DNA and cost per genome, September 2001 to April 2011.
AVAILABLE PHARMACOGENOMIC TESTS
There are several pharmacogenomic tests that are commercially available today and have the major advantage of offering individualized therapy, improving clinical outcomes through advanced risk screening and disease diagnosis, and a decreased likelihood of adverse drug reactions. During the next decade, it is estimated that pharmaceutical companies will be able to develop more targeted drug therapy through new SNP discovery or improving on what is currently known. It is expected that by including only patients with known genetic variations in clinical trials there would be decreases in adverse reactions and improvements in clinical outcomes. This may decrease drug costs and approval time by the US Food and Drug Administration (FDA), thus increasing the likelihood of survival than that in previous years. The alternative argument is that drug costs will increase if pharmacogenomic testing is included in clinical trials to determine treatment eligibility. In addition, these medications are often targeted biological agents with special handling, which are known to be more expensive as compared with small molecules. One example of a targeted biological agent developed based on a genetic test is trastuzumab (Herceptin®, Genentech). Trastuzumab targets breast cancer patients with HER2 gene overexpression. Patients with HER2 overexpression are more likely to respond to this medication. Testing for HER2 is required to prevent those who are not HER2 positive from being treated with the costly medication.
It is important to keep in mind that although costs of sequencing continue to decrease, other costs must be taken into consideration. For example, computerized patient records would need to hold billions of data points for one patient. Developing the technology to store these data in a usable manner will likely cost millions of dollars.
Pharmacoeconomics can assist decision makers in determining the cost-effectiveness of using a pharmacogenomic test versus no testing. The concept of cost-effectiveness represents the decision maker’s proxy for determining if the clinical benefits of a pharmacogenomic test are worth the added costs. This is critical, especially now, when there is a scarcity of resources that need to be distributed efficiently across all elements of health care. This chapter will focus on some of the challenges that must be considered when looking at overall cost of pharmacogenomic testing in a population and implementation of testing into clinical practice.
ELEMENTS OF PHARMACOECONOMICS
Before an in-depth discussion about pharmacoeconomics application in pharmacogenomics can begin, a description of the elements of a pharmacoeconomic analysis should be introduced.
Costs
Pharmacoeconomic analysis is composed of two basic elements: costs and benefits. The costs of the analysis normally are derived from three types: direct, indirect, and intangible costs. Total direct costs represent the costs directly associated with the treatment or intervention. These costs include medication acquisition cost, resource utilization (e.g., length of stay, pharmacy filling costs, laboratory tests, and cultures), and other direct costs related to the disease (e.g., treatment failures, cost of treating adverse events, and out-of-pocket costs to the patient). Indirect costs represent the productivity value (absenteeism and presenteeism) and opportunity costs (e.g., cost of treating a family member instead of earning an income doing something else). Presenteeism is when the patient is able to work but the revenue generated is less because of limitations due to an illness,5–7 whereas absenteeism is the loss of revenue because the patient is unable to work.6,7 Two major approaches have been presented in literature for calculating productivity: human-capital approach and friction-cost approach. The human-capital approach assumes the monetary value of a worker in perfect health and the time worked according to the current market wage rates.8 Friction-cost approach takes into consideration the learning period required for a replacement worker.9 Workers who leave their job due to illness or disease may be replaced by an unemployed worker; however, mobility between workers may not be 100% and a learning period is required where the potential productivity of the replacement does not meet previous worker productivity.9 Unlike accounting, overhead charges are not considered as indirect costs in pharmacoeconomic analyses. Intangible costs represents the cost associated with perfect health (or pain and suffering) that is difficult to measure. Depending on the perspective of the pharmacoeconomic analysis, different types of costs used will determine the type of cost analysis performed.
Benefits (Payoffs or Efficacy)
The second element of a pharmacoeconomic analysis is the benefits (also referred to as efficacy or payoffs) of the treatment strategy that includes surrogate clinical outcomes. Benefits may refer to humanistic outcomes that include patient health-related quality of life. They are the aggregate outcomes of interest that occur as a consequence of the treatment strategy. Benefits can be life years added, reduction in low-density lipoprotein (LDL), decrease in blood pressure, responder to therapy, and disease cure. Benefits can also be presented as quality-adjusted life years (QALYs), which measure morbidity and mortality of a treatment strategy and are used in cost–utility analysis (CUA). Other benefits may include the cost avoidance of preventing a chronic disease (e.g., diabetes) from occurring; however, there are methodological difficulties with estimating these types of benefits.
Perspective
The perspective of a pharmacoeconomic analysis can be from the patient, provider, health care payer, government, institution, or society. Each perspective has its own unique interest on what type of costs or benefits is important. For example, a pharmacoeconomic analysis from the perspective of the patient may focus on patient’s out-of-pocket costs (direct costs) that include the copayment associated with the patient’s health care, cost of travel to the clinic, and cost of deductible. In addition, pharmacoeconomic analysis from the patient’s perspective may also include indirect costs. Indirect costs may include the opportunity costs of the patient spending his or her money on something he or she wants instead of spending it on his or her copay or deductible. These costs reflect the money that the patient has to pay out-of-pocket and also the costs of trade-off, opportunity costs. When a patient spends his or her resources on an intervention that he or she could have used on something else, he or she is incurring an opportunity cost. Moreover, the pharmacoeconomic analysis may also use intangible costs such as the cost of a year of perfect health or a day of suffering and emotional hazards.
Pharmacoeconomic analysis where the perspective is from the payer (institution or government) normally focuses on total direct costs. For example, in genotype-guided warfarin therapy in elderly patients who are newly diagnosed with atrial fibrillation, the payer will be focused on the costs of intracranial hemorrhaging, major bleeding, pharmacogenomic testing, warfarin and international normalized ratio (INR) monitoring, and embolic strokes.10 These costs are directly associated with the treatment strategy and represent the resource consumed along with the costs of the outcomes in the clinical pathway. The payer is only interested in the costs that a particular treatment strategy consumes. In our example, the two strategies were to perform a pharmacogenomic test versus no testing. Based on the results of the testing, patients would have their warfarin dose adjusted in predicting the maintenance dose that can potentially decrease the incidence of bleeding due to overanticoagulation. One of the most common and dangerous side effects of warfarin is bleeding due to a supratherapeutic INR. By having a test that can predict whether a patient would be prone to high INR levels after initiating warfarin therapy, there is a potential to reduce the amount of bleeding associated with treatment. Therefore, costs associated with bleeding become an important measurement for pharmacoeconomic analysis from the payer’s perspective. It is the payer who must pay for the outcomes and any associated adverse events that occur. Therefore, it is in the interest of the payer to select the strategy that will lead to reduced overall total direct costs.
According to the US Task Force on Cost-Effectiveness Analysis, the preferred perspective for pharmacoeconomic analysis is society’s.11 Societal perspective is considered to be the most comprehensive because it includes the burden of the treatment strategy and disease to society. Societal costs include direct, indirect, and intangible costs. Although direct and indirect costs are estimated using resource utilization data and worker productivity data, intangible costs are difficult and time-consuming to estimate. Emotional costs are nearly impossible to estimate and represent one of the limitations of using the societal perspective. Moreover, societal perspective is irrelevant in most pharmacoeconomic analyses because the major stakeholders usually are the payers, institutions, and patients. Previous perspectives are immediate and easily translatable with less variables and uncertainty associated with the derivation of costs compared with societal perspective. However, pharmacoeconomic analysis should strive to investigate its results using a societal perspective to provide a comprehensive estimate of the costs associated with the treatment strategy.
Cost-Effectiveness Plane
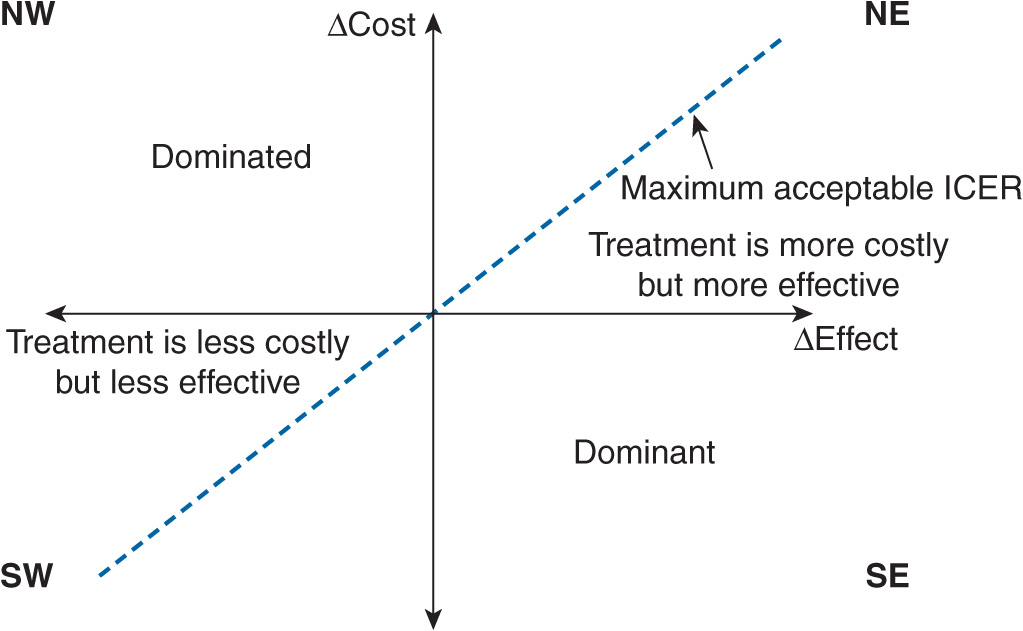
Every discussion regarding pharmacoeconomics involves understanding the cost-effectiveness plane. The cost-effectiveness plane can quickly show whether a strategy is dominant, dominated, or involves a trade-off (cost or benefits). The plane contains the y-axis that represents the difference in costs between intervention A and intervention B, and the x-axis that represents the difference in benefits between intervention A and intervention B (Figure 10–1). If a drug costs less and had more benefits compared with its competitor, it would fall into the southeastern quadrant; in order words, it is a dominant strategy. However, if a drug costs more and had less benefits compared with its comparator, it would fall into the northwest quadrant; in order words, it is a dominated strategy. Moreover, if a drug costs more and had more benefits compared with its comparator, it would fall into the northeast quadrant where a trade-off between costs and benefits would have to be determined. A similar situation occurs when the drug costs less and had less benefits compared with its competitor (southwest quadrant). Strategies that fall into the trade-off quadrants will need to have certain thresholds for determining if it is cost-effective. In other words, what is the maximum amount of costs a decision maker is willing to pay for an increase in benefits between the two interventions?
FIGURE 10–1 Cost-effectiveness (CE) plane. The CE plane consists of the incremental efficacy (ΔEffect) on the x-axis and the incremental cost (ΔCost) on the y-axis. The willingness to pay (WTP) is represented by the maximum acceptable incremental cost-effectiveness ratio (ICER). Strategies falling into the southeast (SE) quadrant are said to be in the dominant quadrant. These strategies cost less than the comparator, but yield greater benefits. Strategies that fall in the northwest (NW) quadrant are said to be in the dominated quadrant because these strategies cost more than the comparator, but yield lesser benefits. Strategies that fall in the southwest (SW) quadrant are said to be in the trade-off quadrant.
The decision maker’s willingness to pay (WTP) is the maximum incremental cost-effectiveness ratio (ICER) where a strategy would be considered cost-effective versus its competitor. Anything above the WTP would be considered not cost-effective; and anything below the WTP would be considered cost-effective or good value for money. Simply put, if the strategy is below the WTP, it is considered worth the increase in price.
The ECHO Model
The principle behind evaluating quality of interventions related to health care (e.g., drug selection, program development, and surgical intervention) is based on the ECHO model that is a framework that involves an analysis of the economic, clinical, and humanistic outcomes.12 Clinical outcomes are common medical objectives (e.g., mortality, cardiovascular events, and adverse events) that are measured due to the intervention or the disease. Economic outcomes quantify the direct, indirect, and intangibles costs of the consequences of the intervention and disease. Humanistic outcomes represent patient preferences, satisfaction, and quality of life as a consequence of the intervention or disease. Validated instruments that are commonly used to measure humanistic outcomes include the Euro-QOL, SF-36, and HUI-3.
Utility Scores and Quality-Adjusted Life Years
Utility scores are a measurement of patient preferences and are incorporated into CUA as quality (health-related quality of life) weights.13 Patients are asked to rank clinical outcomes based on their preferences that are then placed on an interval scale and used to define the utility score. Quality weights are then used to define the more desirable health state versus the least desirable that are then aggregated across a time frame. The result of aggregating the quality weights over a time period is the QALYs.
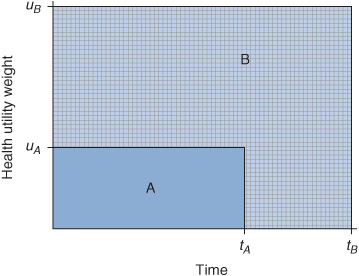
The concept of QALYs was first mentioned by Klarman et al. where they used a patient’s self-reported quality of life score to assess patient preferences for renal transplant versus dialysis. Preferences were then used as an adjustment factor for cost per life years gained.14 Although they did not formally call it QALY, the concept was essentially the same. QALYs are estimated by summing up the area under the curve that is generated by the quality weight for health outcomes across time (Figure 10–2). Differences in QALYs between two interventions represent the QALYs gained or lost. QALYs provide a unique unit of measurement that can be compared across different interventions and diseases. Moreover, QALY is a unit of measurement that quantifies morbidity and mortality, the quality and quantity of life. It is anchored between 0 (“death”) and 1 (“perfect health”). Alternatives to the QALY include healthy-years equivalent (HYE), disability-adjusted life year (DALY), and saved-young-life equivalent (SAVE).13
FIGURE 10–2 Estimated quality-adjusted life years (QALYs). QALYs are calculated by the product of the utility weight (uA and uB) and time in the health state (tA and tB). The QALY for strategy A is represented by the shaded region labeled “A.” It is the area under the curve of the health utility (uA) and time spent in the health state (tA). The QALY for strategy B is represented by the larger shaded region labeled “B.” It is the area under the curve of the health utility (uB) and time spent in the health state (tB). The incremental change in QALY gained is the difference between areas under the curves for B and A.
Discounting
Discounting is a method to indicate the future cost based on the present value,15 which should not be confused with inflation. This principle is frequently applied to direct and indirect costs that are accrued beyond 1 year. It is based on the following mathematical equation: ![]() , where PV is the present discounted value, C is the future cost to be incurred, r is the constant discount rate, and t is the number of years to be discounted.16,17 Although the rate of discounting and what parameters should be discounted are controversial, the rate of approximately 3–5% per year is generally accepted.16,17
, where PV is the present discounted value, C is the future cost to be incurred, r is the constant discount rate, and t is the number of years to be discounted.16,17 Although the rate of discounting and what parameters should be discounted are controversial, the rate of approximately 3–5% per year is generally accepted.16,17
Discounting is associated with cost; however, it should also be applied to benefits or efficacy.17 There has been substantial research in applying discounting rates on efficacy as well as costs; however, the difficulty lies in determining what the discount rate for efficacy should be. Unlike costs where the discount rate remains relatively constant and for the most part predictable, benefits and efficacy do not behave that way. Delaying care for a timely procedure can reduce the efficacy without accruing costs; however, the opportunity to treat early in order to prevent an undesirable outcome is not normally accounted for in pharmacoeconomics studies where the discounting is not applied to the efficacy.
TYPES OF PHARMACOECONOMIC ANALYSIS
There are several types of pharmacoeconomics analysis that can be performed to measure the cost and effectiveness of an intervention in health care. These types of cost analysis are based on different assumptions and purposes. In this section we will examine the different types of cost analyses. Two of the most common pharmacoeconomic analyses performed are cost-effectiveness analysis (CEA) and CUA.
Cost-Minimization Analysis
Cost-minimization analysis (CMA) is a type of pharmacoeconomic analysis that focuses on the total costs of the intervention compared with its competitor when there are no differences in the benefits or efficacy.18 CMA is the simplest to perform due to the assumption that there are no clinical differences between the two comparators. Since the benefits or efficacy are the same, the cheaper strategy is the best decision. CMA is normally applied to situations where there are equivalent generic products where the outcomes are assumed to be the same and the major differences will come from the drug acquisition costs. Several therapeutic interchange studies utilize CMA to justify selection of an intervention into a drug formulary.
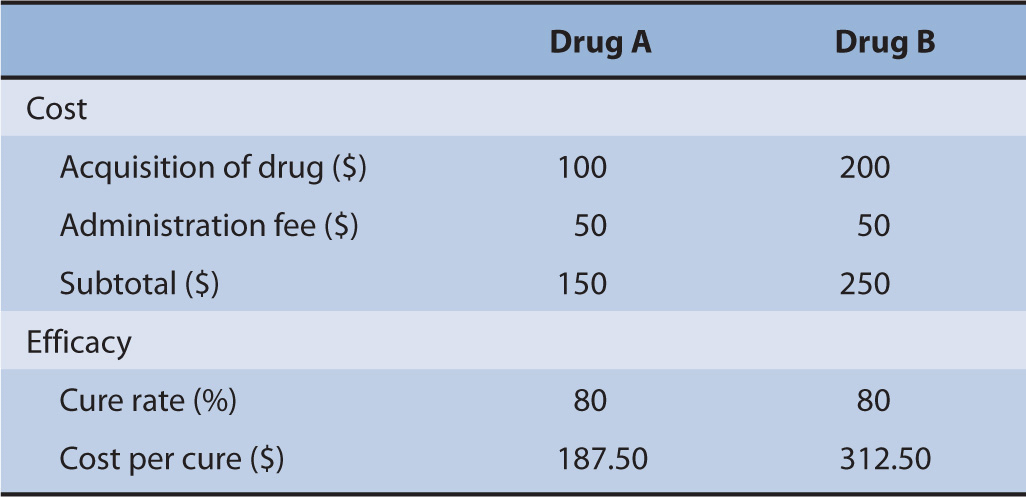
Suppose there were two drugs, Drug A and Drug B. The drug acquisition costs for Drug A and Drug B are $100 and $200, respectively. Both drugs require an administration by the nurse that costs $50. Moreover, the cure rates for both drugs are exactly the same at 80% (Table 10–2).
TABLE 10–2 Cost-minimization analysis example.
Because both drugs have the same cure rate, a decision maker will choose the intervention that costs the least. This is intuitive since the strategy that costs less is also the strategy that has the same outcomes as the comparator. In a formal analysis, investigators could determine the estimated cost per cure achieved, which is the product of the total costs of the drug and the probability of cure.
Cost-Benefit Analysis
Cost–benefit analysis (CBA) is an economic method for assessing the initial investment of an intervention versus its benefits (or efficacy) used in the development of business plans.8,19 CBA measures both costs and benefits in the same monetary units (e.g., US dollar) by transforming benefits into costs and summarizing the return on investment for a particular strategy or intervention. For example, a benefit can be defined as the cost of a myocardial infarction avoided that is given a monetary value. This value is then considered the return on investment for the intervention. The cost of investing in the intervention is then subtracted from the total benefit. If the cost of avoiding a myocardial infarction is greater than the cost of the initial investment (total cost), then there is a net benefit to implementing the intervention. The formal expression is:
Net benefit = total benefit – total cost
Another way of evaluating the relative value of the initial investment is to perform a cost–benefit ratio (CBR). The formal expression is:
![]()
The total benefit is the cost of the benefits achieved (e.g., myocardial infarction avoided, adverse reaction avoided, and prevention of a disease) divided by the cost of the initial investment (e.g., cost of using the pharmacogenomic tests, drug acquisition cost, and cost of the program). CBR provides a ratio that can be applied against other interventions across different treatment strategies and ranked according to the higher CBR. Technically, a CBR that is >1 is considered a good investment (total benefits outweigh the total costs), a CBR <1 is considered a bad investment (total benefits are less than the total costs), and a ![]() is an investment where you will break even (total benefits equal the costs).8,19
is an investment where you will break even (total benefits equal the costs).8,19
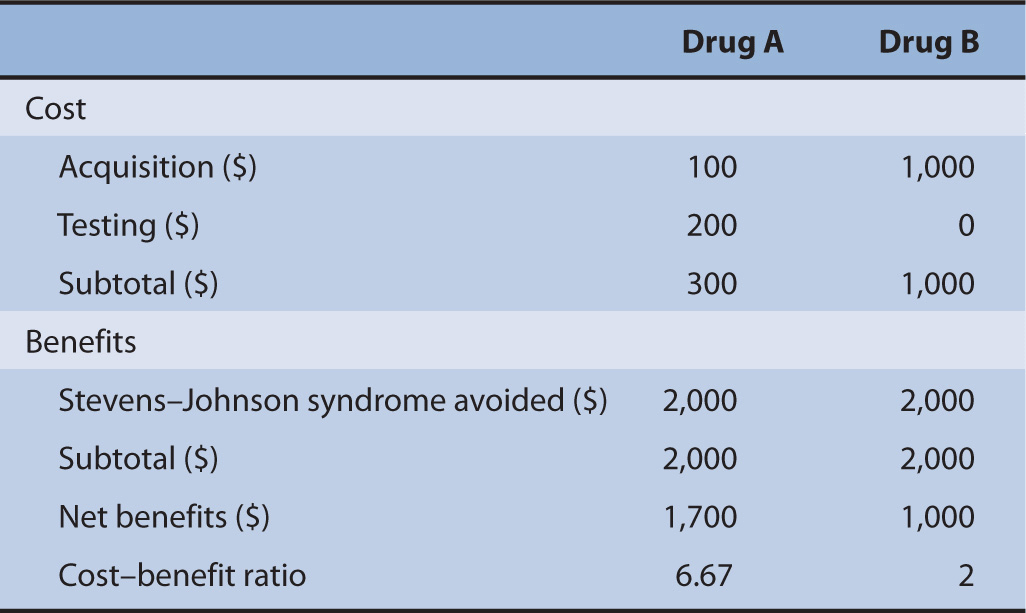
Suppose there are two drugs, Drug A and Drug B. Both drugs are used to cure cancer; however, one of these drugs will cause severe Stevens–Johnson syndrome if the patient contains an allele that will react with Drug A. Drug B is an alternative; however, it costs 10 times as much as Drug A ($100). There is a pharmacogenomic test in the market that can detect this allele; however, the cost of this allele is $200. The cost of treating Stevens–Johnson syndrome is $2,000. We would like to determine if the use of the pharmacogeonomic test is worth the initial investment (Table 10–3).
TABLE 10–3 Cost-benefit analysis between Drug A and Drug B.
Stay updated, free articles. Join our Telegram channel

Full access? Get Clinical Tree


