7 Understanding the Quality of Data in Clinical Medicine

I Goals of Data Collection and Analysis
The term error is used in more than one way. It can be used to mean mistakes in the diagnosis and treatment of patients or to mean more egregious mistakes with clear negligence, such as removing the wrong body part. This meaning of error was emphasized in To Err Is Human: Building a Safer Health System, a report issued in 2000 by the U.S. Institute of Medicine.1 The report caused a considerable stir nationally.2 Methods for reducing medical mistakes are discussed in Chapters 15 and 29.
A Promoting Accuracy and Precision
Two distinct but related goals of data collection are accuracy and precision. Accuracy refers to the ability of a measurement to be correct on the average. If a measure is not accurate, it is biased because it deviates, on average, from the true value in one direction or the other, rather than equally in both directions. Precision, sometimes known as reproducibility or reliability, is the ability of a measurement to give the same result or a similar result with repeated measurements of the same factor. Random error is nondifferential error because it does not distort data consistently in any one direction. Random error alone, if large, results in lack of precision, but not bias, because distortions from truth may occur comparably in both directions (see discussion of bias in Chapter 4).
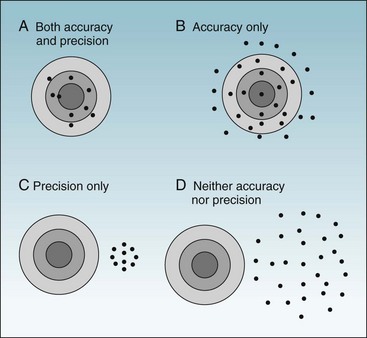
To ask whether accuracy or precision is more important in data collection would be like asking which wing of an airplane is more important. As shown in Figures 7-1 and 7-2, unless both qualities are present, the data would be generally useless. Accuracy is shown in the fact that the mean (average) is the true (correct) value, whereas precision (reliability) is evident in the fact that all values are close to the true value (Fig. 7-1, A). Figure 7-1, B, shows a measure that is accurate but not precise, meaning that it gives the correct answer only on the average. Such a measure might be useful for some types of research, but even so, it would not be reassuring to the investigator. For an individual patient, there is no utility in some factor being correct on the average if it is wrong for that patient. To guide diagnosis and treatment, each observation must be correct. Figure 7-1, C, shows data that are precise but are biased, rather than being accurate, and are misleading. Figure 7-1, D, shows data that are neither accurate nor precise and are useless or even dangerous. Figure 7-2 uses a target and bullet holes to show the same concepts.
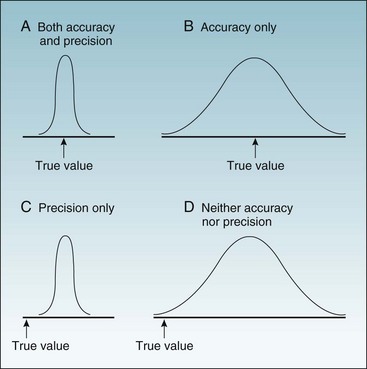
Figure 7-1 Possible combinations of accuracy and precision in describing a continuous variable.
The x-axis is a range of values, with the arrow indicating the true value. A to D, The four curves are the probability distributions of observed values.
B Reducing Differential and Nondifferential Errors
As discussed in Chapter 4, there are several types of errors to avoid in the collection of data; this section focuses on errors associated with measurement. A measurement bias is a differential error—that is, a nonrandom, systematic, or consistent error in which the values tend to be inaccurate in a particular direction. Measurement bias results from measuring the heights of patients with their shoes on or from measuring patient blood pressures with a blood pressure cuff that reads too high or too low. Statistical analysis cannot correct for bias, unless the amount of bias in each individual measurement is known. In the example of the patients’ height measurements, bias could be corrected only if the height of each patient’s shoe heel were known and subtracted from that patient’s reported height.
Although measuring patients in their bare feet could eliminate bias, it would not eliminate random errors, or nondifferential errors. When data have only random errors, some observations are too high and some are too low. It is even possible for random errors to produce biased results.3 If there are enough observations, however, data with only random errors usually produce a correct estimate of the average value (see Chapter 9).
II Studying the Accuracy and Usefulness of Screening and Diagnostic Tests
One way to judge the usefulness of a screening or diagnostic test for a particular disease is to evaluate how often its results are correct in two groups of individuals: (1) a group in whom the disease is known to be present and in whom the test results should be positive and (2) a group in whom the disease is known to be absent and in whom the test results should be negative. This form of research is not as easy as it initially might appear because several factors influence whether the results for an individual subject would be accurate and whether the test in general would be useful in diagnosing or screening for a particular disease. These factors include the stage of the disease and the spectrum of disease in the study population. The population in whom the diagnostic or screening test is evaluated should have characteristics similar to the characteristics of the populations in whom the test would be used. Data derived from evaluating tests in men or young people may not be as useful in women or old people.4
A False-Positive and False-Negative Results
False-negative results may also occur late in infections such as tuberculosis, when the disease is severe and the immune system is overwhelmed and unable to produce a positive skin test result. This inadequate immune system response is called anergy (from Greek, meaning “not working”) and can develop with any illness or stress severe enough to cause depression of the immune system.5 Advanced age also can be a cause of anergy.
The spectrum of disease in the study population is important when evaluating a test’s potential usefulness in the real world. False-negative and false-positive results can be more of a problem than anticipated. In the case of the tuberculin skin test, false-positive results were formerly found in persons from the southeastern United States. Exposure to atypical mycobacteria in the soil was common in this region, and because there was some cross-reactivity between the atypical mycobacteria and the mycobacteria tested in the tuberculin skin test, equivocal and even false-positive test results were common among this population until standards were tightened. To accomplish this, the use of an antigen called “old tuberculin” was replaced by the use of a purified protein derivative (PPD) of mycobacteria at a standardized strength of 5 tuberculin units. The diameter of skin induration needed for a positive test result was increased from 5 to 10 mm. These tightened criteria worked satisfactorily for decades, until the appearance of acquired immunodeficiency syndrome (AIDS). Now, because of the possibility of anergy in HIV-infected individuals, it has been recommended that a smaller diameter of induration in the tuberculin skin test be considered positive for these patients.6 However, lowering the critical diameter (the diameter of the area of induration after a PPD test) also increases the frequency of false-positive results, especially among individuals immunized with bacille Calmette-Guérin (BCG) vaccine and many individuals living in the southeastern United States. These trends show the inevitable tradeoff between sensitivity (i.e., reliably finding a disease when it is present and avoiding false negatives) and specificity (i.e., reliably excluding a disease when it is absent and avoiding false positives). We want the smoke detectors in our homes to go off every time there is a fire (i.e., we want them to be sensitive), but not to be constantly going off when there is no fire (i.e., we want them to be specific).
Figure 7-3 shows two possible frequency distributions of serum calcium values, one in a population of healthy people without parathyroid disease and the other in a population of patients with hyperparathyroidism. If the calcium level were sufficiently low (e.g., below point A), the patient would be unlikely to have hyperparathyroidism. If the calcium level were sufficiently high (e.g., above point B), the patient would be likely to have an abnormality of calcium metabolism, possibly hyperparathyroidism. If the calcium level were in the intermediate range (between point A and point B in Fig. 7-3) in a single calcium test, although the patient probably would not have a disease of calcium metabolism, this possibility could not be ruled out, and if such disease were suspected, serial calcium values and other tests would be obtained.
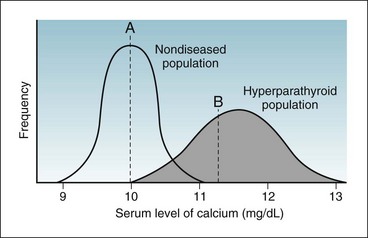
Figure 7-3 Overlap in values of randomly taken tests in a population mostly of healthy people (curve on left) but with some diseased people (curve on right).
A person with a calcium level below point A would be unlikely to have hyperparathyroidism. A person with a calcium level above point B would be likely to have an abnormality of calcium metabolism, possibly hyperparathyroidism. A person with a calcium level between point A and point B may or may not have an abnormality of calcium metabolism. (Note: The normal range of calcium depends on the method used in a specific laboratory. In some laboratories, the range is 8.5 to 10.5 mg/dL. In others, as in this illustration, it is 9 to 11 mg/dL.)
It is easier to visualize the idea of a false-positive error where there is a clear distinction between the diagnosis of a diseased versus a nondiseased condition, as in the evaluation of a spot on a mammogram.7,8 Even this situation, however, is not always simple. The area in question on a mammogram either does or does not represent breast cancer; a diagnosis of cancer is made only after breast tissue is obtained and reviewed by the pathologist. There may be a true abnormality on the mammogram (e.g., calcifications) without the presence of cancer. If only calcifications without cancer were present, a radiologist’s reading of a positive (abnormal) exam would be falsely positive for cancer (the primary concern), but it would be correct about the presence of an abnormality (the calcifications). In contrast, a radiologist’s reading of this mammogram as “normal” would be a true negative for cancer, but a false negative for calcifications. Radiologists frequently indicate uncertainty by reporting the results as “abnormality present—possibly/probably not cancer” and recommending that additional tests be done or that the exam be repeated after a defined number of months. Such readings are analogous to laboratory values in the indeterminate range.
B Sensitivity and Specificity
Sensitivity and specificity are two important measures of test function. They are ways to report the performance of diagnostic tests when the true disease state is known. To calculate these measures, the data concerning the subjects studied and the test results can be put in a 2 × 2 table of the type shown in Table 7-1. The cells in this table are labeled a, b, c, and d, as in Table 6-1, but the measures to be calculated are different.
Table 7-1 Standard 2 × 2 Table Comparing Test Results and True Disease Status of Participants Tested
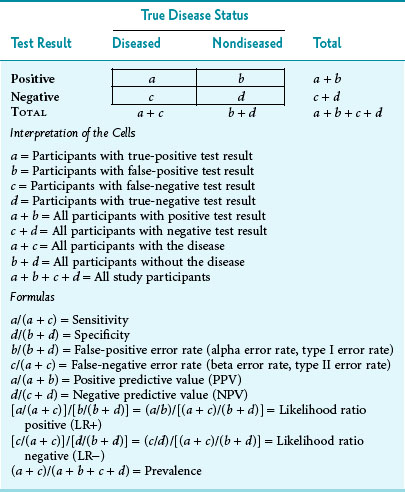
The first column under True Disease Status in Table 7-1 represents all the diseased participants, consisting of those with true-positive results (a) and those with false-negative results (c). The second disease status column represents all the nondiseased participants, consisting of those with false-positive results (b) and those with true-negative results (d). When the total in the disease column is divided by the total of all the participants studied, the result represents the prevalence rate (proportion) of the disease in the study population.
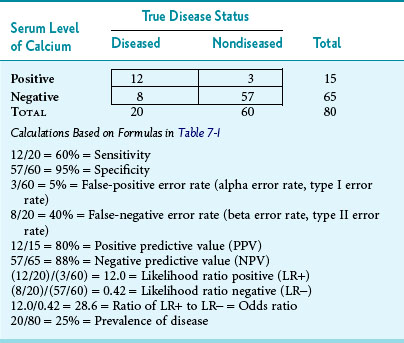
As an example to illustrate what the letters in Table 7-1 imply, suppose that 80 consecutive persons entering an endocrinology clinic have their serum calcium level checked and have a hyperparathyroidism workup to determine whether or not they have the disease. Also, assume that the upper cutoff point for “normal” serum calcium is 11 mg/dL, so that levels greater than 11 mg/dL are presumptively “test positive” and levels of 11 mg/dL or less are “test negative.” Third, assume that the results are as shown in Table 7-2. The following observations could be made. Of the 80 persons tested, 20 ultimately were shown to have hyperparathyroidism (prevalence of 25%). Of these 20 persons, 12 had an elevated calcium level in initial calcium testing. The sensitivity of the initial test was 60%, and the false-negative error rate was 40% (8/20). This is consistent with patients with hyperparathyroidism having serum calcium levels that alternate between the high-normal range and definite elevation, so more than one calcium test is needed. The specificity in Table 7-2 was higher than the sensitivity, with normal levels correctly identified in 57 of 60 nondiseased persons, indicating 95% specificity. The false-positive error rate was 5% (3/60).
Stay updated, free articles. Join our Telegram channel

Full access? Get Clinical Tree


