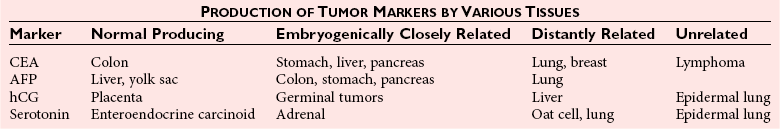
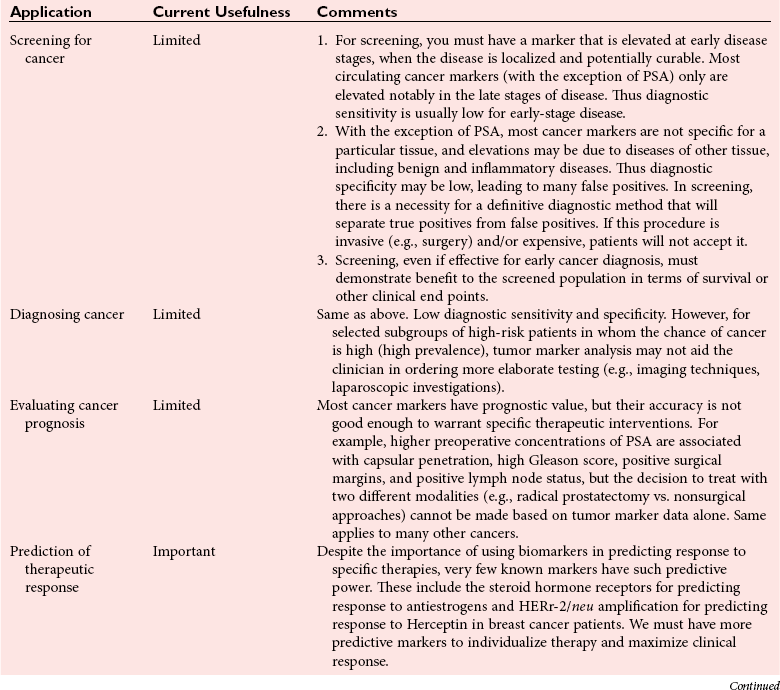
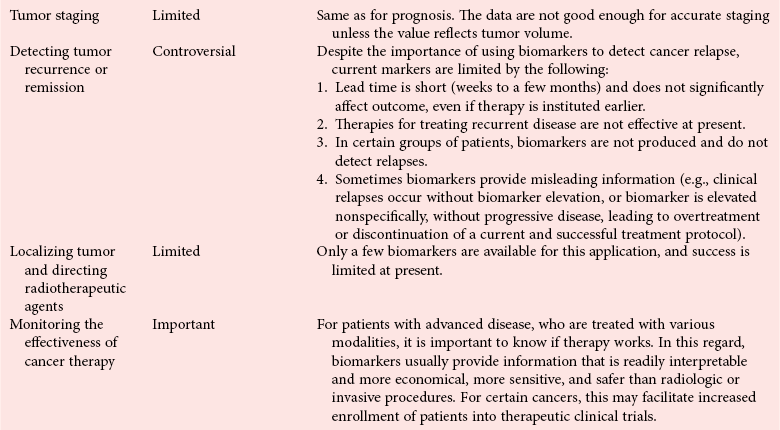
Chapter 24 Lori J. Sokoll, Ph.D., F.A.C.B., Alex J. Rai, Ph.D., D.A.B.C.C., F.A.C.B. and Daniel W. Chan, Ph.D., D.A.B.C.C., F.A.C.B A tumor marker is a substance produced by a tumor or by the host in response to a tumor, which is used to differentiate a tumor from normal tissue, or to detect the presence of a tumor based on measurements in the blood or secretions. Such substances are found in cells, tissues, or body fluids and are measured qualitatively or quantitatively by chemical, immunologic, or molecular biological methods.246 Morphologically, cancer tissue has been recognized by pathologists as resembling fetal tissue more than normal adult differentiated tissue. Tumors are graded according to their degree of differentiation as (1) well differentiated, (2) poorly differentiated, or (3) anaplastic (without form). Tumor markers are the biochemical or immunologic counterparts of the differentiation state of the tumor. In general, some tumor markers represent re-expression of substances produced normally by embryogenically closely related tissue (Table 24-1). TABLE 24-1 Expression of Oncodevelopmental Tumor Markers AFP, α-Fetoprotein; CEA, carcinoembryonic antigen; hCG, human chorionic gonadotropin. Modified from Sell S. Cancer markers. In: Moossa AR Schempff SC, Robson MC, eds. Comprehensive textbook of oncology, 2nd edition, volume 1. Baltimore: Williams & Wilkins, 1991:225-38. Clinically, an ideal tumor marker should be both specific for a given type of cancer and sensitive enough to detect small tumors for early diagnosis or during screening. Unfortunately, few markers are specific for a single individual tumor (tumor-specific markers); most are found with different tumors of the same tissue type (tumor-associated markers). Tumor markers are present in higher quantities in cancer tissue or in blood from cancer patients than in benign tumors or in the blood of healthy subjects. In practice, current tumor markers are most useful for evaluating the progression of disease status after initial therapy and for monitoring subsequent treatment modalities.21,22 This chapter begins with general discussions on (1) cancer, (2) the historical background of tumor markers, (3) their clinical applications, (4) how their utility is evaluated, (5) clinical guidelines for their use, and (6) how they are measured. Several clinically relevant tumor markers from each of these categories are then discussed in detail. These are grouped under the general categories of (1) enzymes, (2) hormones, (3) oncofetal antigens, (4) carbohydrate markers, (5) blood group antigens, (6) proteins, (7) receptors, and (8) genes. More detailed information on tumor markers is found in a 2002 textbook on the subject.71 In 2010, the estimated number of new cancer cases (excluding skin cancer) was 1.53 million. Prostate cancer was the leader among men, and breast cancer was the leader in women, followed by cancer of the lung, colon-rectum, and bladder (men) or uterine corpus (women).44 Together, diseases of the heart and malignant neoplasms account for 49% of all deaths in the United States. Heart disease remains the leading cause of death in the United States in men and women over the age of 85; however, for those younger than 85 years, cancer has surpassed heart disease as the leading cause of death.127 Following peak death rates from all cancers in 1990 for men and 1991 for women, death rates decreased by 21.0% in men and 12.3% in women from 1990/1991 to 2006. Death rate reductions in men from lung, prostate, and colorectal cancers accounted for 80% of the decrease, while in women breast and colorectal cancers accounted for 60% of the decrease.127 These trends support the conclusion that early detection and more effective treatment combined with prevention (e.g., decreasing smoking, improving diet) could reduce the mortality rate of cancer in the future. The American Cancer Society estimates that in 2010, 171,000 deaths are expected to be caused by tobacco use, and one third will likely be related to excess weight, physical inactivity, and poor nutrition.44 A simple definition of cancer is “a relatively autonomous growth of tissue.”216 Understanding the cause of autonomous growth would clearly facilitate the search for a cure. A carcinogen is an agent that causes cancer. A carcinogen may be physical (e.g., radiation), chemical (e.g., a polycyclic hydrocarbon), or biological (e.g., a virus). Exposure to such an agent may cause cancer by producing direct genotoxic effects on deoxyribonucleic acid (DNA) (e.g., as with radiation) or by increasing cell proliferation (e.g., by a hormone), or both (e.g., through the use of tobacco). Advances in molecular genetics have resulted in a better understanding of the genesis of human cancer. The proliferation of normal cells is thought to be regulated by growth-promoting oncogenes and counterbalanced by growth-constraining tumor suppressor genes. The development of cancer appears to involve the activation or the altered expression of oncogenes,1 or the loss or inactivation of a tumor suppressor gene.297 A pathway to cancer development has been published.81 The first tumor marker reported was the Bence Jones protein. Since its discovery in 1847 by precipitation of a protein in acidified boiled urine,24 the measurement of Bence Jones protein has been a diagnostic test for multiple myeloma (a tumor of plasma cells). More than 100 years after its discovery, the Nobel Prize–winning studies of Porter and of Edelman and Poulik identified the Bence Jones protein as the monoclonal light chain of immunoglobulin secreted by tumor plasma cells. Monoclonal paraproteins appear as sharp bands in the globulin area in electrophoretic patterns of serum. Multiple myeloma is often diagnosed on the basis of this finding or the finding of an elevated concentration of “monoclonal” immunoglobulin in the serum.261 A brief history of tumor markers is shown in Table 24-2.244 The first period of tumor marker history was the era of the Bence Jones protein. The second era, from 1928 to 1963, included the discovery of hormones, enzymes, isoenzymes, and proteins and their application to the diagnosis of cancer and the beginnings of chromosomal analysis of tumors. Occasionally, such markers were useful in the diagnosis of individual tumors, but the general application of tumor markers for monitoring cancer patients did not start until the third era, with the discovery of α-fetoprotein (AFP) in 19632 and carcinoembryonic antigen (CEA) in 1965.97 The production of such markers during fetal development and in tumors led to use of the term oncodevelopmental markers.85 TABLE 24-2 A Brief History of Tumor Markers Modified from Sell S. Cancer markers. In: Moossa AR, Schempff SC, Robson MC, eds. Comprehensive textbook of oncology, 2nd edition, volume 1. Baltimore: Williams & Wilkins, 1991:225-38. The fourth era started in 1975 with the development of monoclonal antibodies and their subsequent use to detect oncofetal antigens and antigens derived from tumor cell lines. Examples include carbohydrate antigens such as CA 125, CA 15-3, and CA 27.29. Advances in molecular genetics using molecular probes and monoclonal antibodies to detect chromosome or protein alterations, including the study of oncogenes, suppressor genes, and genes involved in DNA repair,138 have led to the rapid understanding and use of tumor markers at the molecular level. These markers are becoming increasingly useful at the cellular level. For example, mutated ras oncogene can be detected in sloughed cellular DNA in fecal material and thus can be used to detect colon cancer.250 Discovery of the breast cancer susceptibility genes, BRCA 1 and BRCA 2,177,304 has led to the possibility of screening for familial breast cancer susceptibility in high-risk individuals.215 As we begin the 21st century, new technologies are being applied to the discovery of tumor markers and their clinical applications. Notable among these discoveries is the introduction of genomics and proteomics technologies202 such as the application of complementary DNA (cDNA), protein and tissue microarrays, and the use of mass spectrometry as a diagnostic and discovery tool. Furthermore, the advent of bioinformatic techniques, including neural networks, logistic regression, support vector machines, and other algorithms, is facilitating the use of multiparametric analysis for cancer diagnosis and prognosis, and for prediction of therapy outcomes.311 The potential uses of tumor markers are summarized in Table 24-3. In general, tumor markers may be used for (1) diagnosis, prognosis, and prediction; (2) for monitoring the effects of therapy; and (3) as targets for localization and therapy.246 Ideally, a tumor marker should be produced by tumor cells and should be detectable in body fluids. It should not be present in healthy people or in benign conditions. Therefore, it could be used for screening for the presence of cancer in asymptomatic individuals in the general population. However, most tumor markers are present in normal, benign, and cancerous tissues and lack specificity. However, if the incidence of cancer is high among certain populations, screening could be feasible. An example is the use of AFP in screening for hepatocellular carcinoma in China and Alaska.174 Prostate-specific antigen (PSA) has been used in conjunction with digital rectal examination (DRE) for early detection of prostate cancer. Because of elevation of serum PSA in benign prostatic hyperplasia (BPH), PSA velocity and free PSA have been used to improve the detection of prostate cancer.99 TABLE 24-3 Current Applications of Tumor Markers and Their Limitations Modified from Diamandis EP. Tumor markers: past, present, and future. In: Diamandis EP, Fritsche HA, Lilja H, Chan DW, Schwartz MK, eds. Tumor markers: physiology, pathobiology, technology, and clinical application. Washington, DC: AACC Press, 2002:5. Detecting cancer recurrence may be helpful in initiating early treatment or in changing therapy. The breast cancer marker CA 27.29 has been shown to detect recurrent disease before any clinical evidence is noted in breast cancer patients receiving adjuvant chemotherapy.54 Most tumor marker concentrations correlate with effectiveness of treatment and responses to therapy. In breast cancer, the concentration of markers, such as CA 15-3 or CA 27.29, changes with treatment and the clinical outcome of the patient. Concentrations usually increase with progressive disease, decrease with remission, and do not change significantly with stable disease. In reality, tumor marker kinetics in the monitoring of cancer may be more complicated. Marker concentrations in response to treatment may show an initial delay before demonstrating the expected pattern of change.134 In addition, antibodies to tumor markers labeled with a radioactive tag are used to localize the tumor masses (radioimmunoscintigraphy)66 or to provide direction for labeled antibodies to attack the tumor site. Examples include the use of radiolabeled antibodies to CEA to localize colon tumors and the application of labeled antibodies against ferritin to target hepatocellular carcinoma. This approach is also used for treatment by allowing the antibody to bind to the tumor marker epitopes and kill the tumor cell with the dose of radioactivity.296 Reference intervals of a tumor marker are obtained from a healthy population, preferably using individuals of the same age and sex as those with the cancer of interest.35 Determination of reference intervals is time-consuming and requires a large healthy population (n = 120 subjects). Statistical analysis based on the mean ± 2 standard deviations (SD) for a population with a Gaussian (normal) distribution is a frequently used method. For a non-Gaussian distribution, the percentile method is a simple approach that is often used (for further discussion of reference intervals, see Chapter 5). The predictive value model includes the clinical sensitivity and specificity and the predictive value of a test. By varying the decision cut point, clinical sensitivity and specificity will change in opposite directions. An optimal decision cut point can be selected on the basis of strategies outlined in Chapter 3. A useful approach to evaluating multiple tests for the same analyte or multiple markers for the same type of cancer is the receiver operating characteristic (ROC) curve.253 The ROC curve can be constructed by plotting sensitivity versus 1 minus specificity, or the true-positive rate versus the false-positive rate. The advantage of the ROC curve is the display of performance over the entire range of decision points. One can pinpoint the decision cut point at which optimal sensitivity and specificity can be achieved. By superimposing the ROC curves of several markers, the best predictive marker can be selected. An example is shown in Figure 24-1. Preparation of an ROC curve has been discussed in detail by Zweig and Robertson314 and is covered in Chapter 3 of this text. Application of the predictive value model is difficult for analytes that are not diagnostic for a single disease. Concentrations of most, if not all, tumor markers are elevated in more than one disease condition. When the predictive value model is used, it is necessary to select a population that includes groups with and without disease. What patients should be included in these two groups? The decision should be based on the specific clinical questions asked. If the question concerns the diagnostic sensitivity of CEA for active colorectal carcinoma, the disease group should include only those patients with active colorectal carcinoma. Selection of the nondisease group is more challenging. Should healthy individuals and those with benign conditions be included? If so, how many benign condition groups should be included? Should patients with no evidence of disease be included as well, because they do not have active disease? Values calculated for sensitivity and specificity greatly depend on the types of groups included and on the number of patients in each group (see Chapter 3 for a discussion on the effect of spectrum on sensitivity and specificity). The distribution of tumor marker concentrations is usually shown as the percentage of patients with elevated concentrations as determined using various cutoffs in healthy, benign, and cancerous groups. When available, international staging criteria should be used to classify cancer patients. Diagnosis should be based on pathologic findings. In breast cancer, for example (Table 24-4), normal women are used as the healthy population for comparison. Nonmalignant or benign groups are selected to include people with the most likely causes of marker elevation: benign liver and breast diseases, and pregnancy. Nonbreast metastatic cancer groups are selected to show the specificity of the marker using endometrial, colon, lung, prostate, ovarian carcinoma, and others. TABLE 24-4 From Chan DW, Beveridge RA, Bruzek DJ, et al. Monitoring breast cancer with CA 549. Clin Chem 1988;34:2000-4. Several national and international groups have released guidelines on the selection and clinical use of tumor markers. These groups include the National Academy of Clinical Biochemistry (NACB), the European Group on Tumor Markers (EGTM), the American Cancer Society (ACS), the American Society for Clinical Oncology (ASCO), and others. All of these groups are composed of experts in the areas being assessed, and a number of criteria are used to form the recommendations, including the level of evidence for the tumor marker and the tumor marker utility grading system (TMUGS).71 Table 24-5 summarizes the recommendations of several groups. TABLE 24-5 Summary of Key Guideline Recommendations* *“None” indicates that the relevant group has not yet considered this type of cancer. †Placental alkaline phosphatase (PLAP) is for monitoring of seminomas in nonsmokers only. From Sturgeon CM, Duffy MJ, Stenmab UH, et al; National Academy of Clinical Biochemistry. National Academy of Clinical Biochemistry laboratory medicine practice guidelines for use of tumor markers in testicular, prostate, colorectal, breast, and ovarian cancers. Clin Chem 2008;54:e11-79; Harris L, Fritsche H, Mennel R, et al; American Society of Clinical Oncology. American Society of Clinical Oncology 2007 update of recommendations for the use of tumor markers in breast cancer. J Clin Oncol 2007;25:5287-312; Wolf AM, Wender RC, Etzioni RB, et al. American Cancer Society guideline for the early detection of prostate cancer: update 2010. CA Cancer J Clin 2010;60:70-98, available at: http://www.egtm.eu/. Tumor markers are measured by a variety of analytical techniques, including enzyme assay (see Chapters 15 and 22); immunoassay (see Chapter 16); receptor assay and instrumental techniques such as chromatography (see Chapter 13); electrophoresis (see Chapter 12); and mass spectrometry interfaced with liquid or gas chromatographs (see Chapter 13) and microarrays (see Chapter 18). Details of these techniques are found in the indicated chapters. Here we expand on the use of mass spectrometry and microarrays for the assay of protein and genetic tumor markers. Mass spectrometry for small molecules has been used in the clinical laboratory for many years. However, developments have allowed for the mass spectrometric identification of high molecular weight compounds, including proteins and nucleic acids. The new ionization technologies were recognized by the Nobel Prize in Chemistry in 2002. These advances triggered investigations toward using the technology for cancer diagnostics or for discovery of new cancer biomarkers. In one approach, sera or other fluids from cancer patients or controls are treated with various adsorbing surfaces, such as ion-exchange, hydrophobic, or metal-binding chips. After excess proteins are washed out, the chips are subjected to mass spectrometric analysis by using MALDI (matrix-assisted laser desorption ionization) or SELDI (surface-enhanced laser desorption ionization)-TOF (time-of-flight) mass spectrometry. This analysis generates many peaks of various M-Z (mass-to-charge) ratios. By comparing these proteomic patterns with patterns obtained from samples from individuals without cancer, and by using sophisticated bioinformatic and computational tools, it is possible to identify patterns that are associated only with cancer. This technology has been investigated for the detection of ovarian,212,222,312 prostate,3,214 bladder, and many other cancers,230 and its use has been reviewed.202,213,214,267 However, the method has not as yet been prospectively evaluated, and clinical trials are in progress. A more promising approach is to use this technology to identify novel cancer biomarkers.155,222,230,312 To date, several molecules have been identified, including (1) apolipoprotein A1, (2) transthyretin fragment, (3) inter-α-trypsin inhibitor, (4) haptoglobin-α subunit, (5) vitamin D–binding protein, and others. Most of these molecules are present in serum at concentrations higher than concentrations of traditional cancer biomarkers. In most cases, these candidate biomarkers are in the process of being validated. OVA1 (Vermillion, Inc., Austin, Tex), a panel of biomarkers for ovarian cancer,222,312 is the first proteomic IVDMIA (in vitro diagnostic multivariate index assay) cleared by the U.S. Food and Drug Administration (FDA). A microarray uses a solid material such as a microchip of silicon that contains a large number of elements (“spots”) in a two-dimensional array. To each of these spots are attached different molecules of immobilized short oligonucleotides (e.g., Affymetrix chips; Affymetrix, Santa Clara, Calif) and cDNAs of various genes, proteins, antibodies, etc.159,188,237 It is possible to immobilize up to 20,000 to 40,000 elements on such chips; consequently, genome-wide analysis at both messenger ribonucleic acid (mRNA) and protein concentrations is now possible. Commercially available protein microarrays such as the ProtoArrays from Life Technologies Inc. (Carlsbad, Calif) contain as many as 10,000 immobilized proteins. Applications of microarrays include quantitative assessment of gene expression, detection of mutations and polymorphisms (such as single-nucleotide polymorphisms), DNA sequencing, the study of protein expression and protein-protein interactions, and the detection of autoantibodies. These devices have been used to discover new candidate biomarkers. For example, Welsh and colleagues used microarray analysis of gene expression profiles of normal and cancerous tissues and identified highly overexpressed genes in ovarian and other cancers.298,299 These overexpressed genes were then to be evaluated further with more quantitative techniques, such as reverse-transcriptase polymerase chain reaction, to confirm the overexpression. Identification of an overexpressed gene can be followed by development of assays to measure the protein and then evaluate it as a serologic or tissue biomarker.298 Some successes of this process have been reported (e.g., the identification of osteopontin and HE4 as ovarian cancer biomarkers).116,153 Another application of microarrays is their use in the classification of cancers based on their gene expression profiles. Numerous examples of subclassifying breast, ovarian, prostate, brain, hematologic, and other cancers using this technology have been described.133,211 Especially for breast cancer, it has been realized that tissue microarray analysis may stratify patients according to prognosis.290,291 Van de Vijver and associates showed that a relatively small number of genes (about 70) can be used to classify patients into high- and low-risk groups. This method has been applied clinically to select breast cancer patients for adjuvant chemotherapy. Enzymes were one of the first groups of tumor markers identified. Their elevated activities were used to indicate the presence of cancer.101 Measurement of enzymes was relatively easy using spectrophotometric determination of enzymatic activities. With the introduction of radioimmunoassay (RIA) in the late 1950s, the mass of an enzyme could be measured as a protein antigen instead of its catalytic activity. With few exceptions, an increase in the activity or mass of an enzyme or isoenzyme is not specific or sensitive enough to be used to identify the type of cancer or the specific organ involvement. An exception is PSA. PSA has mild protease activity and amino acid sequence homology with serine proteases of the kallikrein family.60,70 It is expressed by normal, benign, hyperplastic, and cancerous prostate glands and minimally by other tissue.32 Until the application of PSA as a marker for prostate cancer, tumor enzymes had lost most of their popularity for use as cancer markers.101,243 Enzymes were used historically as tumor markers before the discovery of oncofetal antigens and the advent of monoclonal antibodies.242 Abnormalities of enzymes as a marker for cancer include expression of the fetal form of the enzyme (isozyme) and ectopic production of enzymes. Isoenzymes and multiple forms of enzymes may provide additional organ specificity. Table 24-6 summarizes various enzymes, their associated types of malignancy, and the assays used to measure their activity (Act) or their mass concentration (immunoassay). Enzymes are traditionally measured by their activities. With the introduction of antibody techniques, some enzymes, such as PSA, are measured as protein antigens rather than by their enzyme activity. TABLE 24-6 Alkaline phosphatase may arise from liver, bone, or placenta. The alkaline phosphatase in the sera of normal adults comes primarily from the liver or biliary tract. Elevated alkaline phosphatase is seen in primary or secondary liver cancer. Quantification may be helpful in evaluating metastatic cancer with bone or liver involvement. Greatest elevations are seen in patients with osteoblastic lesions, such as in those with prostatic cancer with bone metastases. Minimal elevations are seen in patients with osteolytic lesions, such as those with breast cancer with bone metastases.84,278 In liver metastases, serum alkaline phosphatase shows a better correlation with the extent of liver involvement than the results of other liver tests. To determine the origin of elevated alkaline phosphatase, tests of other liver enzymes may be performed. Elevations in 5′-nucleotidase or γ-glutamyltransferase suggest that the elevated alkaline phosphatase is of liver, not bone, origin. Determination of alkaline phosphatase isoenzymes may provide additional specificity. The liver isoenzyme is thermally more stable than the bone isoenzyme (see Chapter 22 for a more detailed discussion). Other malignancies, such as leukemia, sarcoma, and lymphoma complicated with hepatic infiltration, may also elevate alkaline phosphatase. Placental alkaline phosphatase (PALP) is synthesized by the trophoblast and is elevated in the sera of pregnant women. PALP was first identified as the Regan isoenzyme in 1968 by Fishman and colleagues85 and was recognized as one of the first oncodevelopmental markers, along with AFP and CEA. It is elevated in a variety of malignancies, including ovarian, lung, trophoblastic, and gastrointestinal cancers; seminoma; and Hodgkin’s disease. Elevations in CK1 have been demonstrated in prostate cancer and small cell carcinoma of the lung. Although it is also elevated in other malignancies, such as those of the breast, colon, ovary, and stomach, the clinical usefulness of CK1 as a tumor marker requires further investigation.243 CK isoenzymes have been included in a prostate cancer panel, “ProstAsure.”14,269 The ProstAsure Index is a neural network–derived algorithm for the early detection of prostate cancer that also includes PSA PAP, and age. Lactate dehydrogenase (LD) is an enzyme in the glycolytic pathway that is released as the result of cell damage. Elevation of LD in malignancy is rather nonspecific. It has been demonstrated in a variety of cancers, including liver cancer, non-Hodgkin’s lymphoma, acute leukemia, nonseminomatous germ cell testicular cancer, seminoma, neuroblastoma, and other carcinomas, such as breast, colon, stomach, and lung cancer. Serum LD has been shown to correlate with tumor mass in solid tumors and provides a prognostic indicator for disease progression. Its value in the monitoring of therapy is rather limited. The LD isoenzymes provide only marginal specificity for organ involvement. For example, elevation of the LD5 isoenzyme is associated with liver metastases. Elevation of LD5 in the spinal fluid may be an early indication of central nervous system metastases.243 Among children with advanced neuroblastoma, more than 90% have been reported to have elevated serum concentrations of NSE. High concentrations of NSE are associated with poor prognosis, and concentrations seem to correlate with the stage of the disease. Monitoring therapy using serum NSE is controversial, particularly with respect to the issue of specificity. However, elevated concentrations of NSE in children with stage IV neuroblastoma were associated with a poorer outcome.309 Prostatic acid phosphatase (PAP), with an optimum pH of 5 to 6, is very labile at a pH of greater than 7.0 and a temperature greater than 37 °C. It can be distinguished from other acid phosphatases by using tartrate, which strongly inhibits the prostatic form. Another approach is to select substrates that are more specific for PAP, including thymolphthalein monophosphate (Roy method—most specific) and β-naphthol phosphate. Acid phosphatase was first used as a tumor marker in 1938 by Gutman and colleagues.101 PAP was measured first by its enzymatic activity, then with the use of counterimmunoelectrophoresis, and subsequently, in the late 1970s, by RIA. Elevated serum PAP may be seen in malignant conditions such as osteogenic sarcoma, multiple myeloma, and bone metastases of other cancers. It also may be elevated in some benign conditions, such as BPH, osteoporosis, and hyperparathyroidism. For clinical use, PAP has been replaced by PSA.40 PAP is not as sensitive as PSA for detection of early cancer. It is less likely to be elevated in BPH than is PSA. However, as an individual marker, PAP may be useful for disease management in the rare patient whose tumor does not secrete PSA, and it may have utility when combined with other markers for improving prostate cancer detection15 or predicting recurrence after radical prostatectomy.108 Currently, the method of choice for PAP is measurement of its enzymatic activity. The human kallikrein (hK) gene locus spans a region of approximately 300 kb of chromosome 19q13.4, which contains 15 tandemly localized kallikrein genes (KLK1 to KLK15) with no intervention from other genes. This is the largest cluster of serine proteases within the human genome. Members of the kallikrein family are identified by various similar features.73 All have a nearly identical genetic structure (5′ untranslated region, intron-exon size and organization), and the catalytic triad of serine proteases is conserved by all members, with the histidine always occurring near the end of the second exon, the aspartate in the middle of the third exon, and the serine residue at the beginning of the fifth exon. All kallikreins are produced as prepropeptides with a 17 to 20 amino acid signal sequence and a 4 to 9 amino acid activation peptide. They contain 10 to 12 conserved cysteines that form 5 to 6 disulfide bonds. Finally, most if not all genes are under steroid hormone control. Kallikreins are expressed in a wide variety of tissues, including (1) prostate, (2) breast, (3) ovary, and (4) testis.306 For example, KLK3 (PSA) is highly expressed in prostate and is discussed in detail later in the chapter. KLK3 also has minor expression in breast, thyroid, salivary glands, lung, and trachea, and KLK11 and KLK12 are highly expressed in more than 10 tissues, with minor expression in at least four others. Only 3 of the 15 kallikreins have been assigned a specific biological role. The major biological role of hK1 is the release of lysyl-bradykinin (kallidin) from low molecular weight kininogen; however, it has been implicated in the processing of peptide hormones, including proinsulin, low-density lipoprotein (LDL), prorenin, the precursor of atrial natriuretic peptide, and vasoactive intestinal peptide. The role of hK2 has only recently been investigated with seminal plasma hK2 found to cleave seminogelin I and II, but at different sites than hK3 (PSA). Furthermore, a role for hK2 in the regulation of growth factors through the proteolysis of insulin-like growth factor binding protein 3 (IGFBP-3) has been suggested. hK3, also known as PSA, is found not only in prostate tissue (discussed later), but in relatively high concentrations in nipple aspirate fluid, breast cyst fluid, breast milk, amniotic fluid, and tumor extracts.32 Its presence in these fluids and tissues suggests a biological function in the breast and a possible role in fetal development; however, no specific function in these tissues has been identified to date. The role of kallikreins as tumor markers is rather varied.79 Several kallikreins have been associated with hormonal malignancies such as (1) prostate, (2) breast, (3) testicular, and (4) ovarian cancers. The roles of hK3 (PSA) and hK2 are discussed in detail later in the chapter. hK6 has been investigated as a serum marker for the diagnosis, prognosis, and monitoring of ovarian cancer,72 and as a cytosolic marker for prognosis in breast cancer. Serum hK5, hK6, hK10, and hK11 have also been investigated for the diagnosis and monitoring of ovarian cancer,168,307,308 and a high concentration of cytosolic hK10 in ovarian tumor and breast cells is a poor prognostic marker.166,167 Kallikrein gene expression is associated with both positive and negative prognoses in various cancers, including prostate, ovarian, and breast cancers.73 In the 1970s, several groups independently discovered prostate antigens for use in forensics and as tumor markers.257 In 1971, Hara and colleagues identified a protein in seminal plasma that they named γ-seminoprotein. Li and Beling isolated the same protein from seminal plasma and called it protein E1 because it had slow β-mobility in electrophoresis and a molecular weight (MW) of 31,000 Da. In 1978, Sensabaugh characterized this glycoprotein with isoelectric points between 6.5 and 8.0 and MW of approximately 30,000 Da and called it p30. In 1979, Wang and coworkers purified a protein from prostatic tissue and called it prostate-specific antigen. γ-Seminoprotein, p30, and PSA are biochemically very similar. PSA is found in normal, benign, hypertrophic, and malignant prostatic tissues. Originally, it was thought that PSA was solely expressed in prostate tissue. However, it was later found that PSA also is expressed in numerous other tissues, most notably hormonally regulated tissue such as breast tissue. Low concentrations of PSA are detectable in sera from women as well as in nipple aspirate fluid. PSA is a single-chain glycoprotein that is 7% carbohydrate. It has 237 amino acid residues and four carbohydrate sidechains with linkages at amino acid 45 (asparagine), 69 (serine), 70 (threonine), and 71 (serine). The N-terminal amino acid is isoleucine, and the C-terminal residue is proline. Its MW is 28,430 Da,23 and it has isoelectric points from 6.8 to 7.2 because of its various isoforms. The three-dimensional structure and the antigenic domain of PSA have been characterized.60 The complete gene encoding PSA has been sequenced and located on chromosome 19.165 It is similar to the kallikrein-1 gene with 82% homology. Functionally, PSA is a serine protease of the kallikrein family. It is produced exclusively by epithelial cells of the acini and ducts of the prostate gland. PSA is secreted into the lumina of the prostatic duct. In seminal fluid, PSA cleaves seminal vesicle–specific proteins into several low molecular weight proteins as part of the process of liquefaction of the seminal coagulum. Therefore, PSA possesses chymotrypsin-like and trypsin-like activity. Autodigestion of PSA has been reported at three possible locations: LYS 148, LYS 185, and ARG 85. The addition of protease inhibitors may be important to prevent autohydrolysis of PSA in solution.60 The PSA promoter contains three androgen response elements and can be activated by androgens, progestins, and glucocorticoids. PSA exists in two major forms in blood circulation. Most PSA is complexed with the protease inhibitors α1-antichymotrypsin (ACT) (MW, 100,000 Da) and α2-macroglobulin (AMG), and a minor component is free PSA (MW, 28,430 Da).156,275 Most immunoassays measure both free and ACT-complexed PSA but not PSA-AMG, which is sterically inhibited. In human seminal fluid, approximately 60 to 70% of PSA is enzymatically active, and the remainder inactive. Inactive forms of free PSA are composed of three distinct molecular forms: BPSA, pPSA, and iPSA.178 BPSA is a degraded form of free PSA containing two internal peptide bond cleavages at Lys 145 and Lys 183; BPSA in tissue is relatively localized in the transition zone of the prostate and contributes to free PSA in BPH serum. pPSA is the proenzyme or precursor form of PSA that has a 7 amino acid pro-leader peptide. Additional truncated forms of pPSA with varying amino acids exist. Activation of pPSA, resulting from cleavage of the leader sequence by hK2 and trypsin, becomes more resistant as the number of amino acids in the pro-leader peptide decreases. pPSA is localized in the peripheral zone of the prostate and contributes to free PSA in cancer serum. iPSA consists of minor variants of intact PSA that is enzymatically inactive as the result of conformational changes. The metabolic clearance rate of PSA follows a two-compartment model, with initial half-lives of 1.2 and 0.75 hours for free PSA and total PSA and subsequent half-lives of 22 and 33 hours.206 Because of this relatively long half-life, at least 2 to 3 weeks may be necessary for the serum PSA to return to baseline concentrations after certain procedures, including transrectal biopsy, transurethral resection of the prostate, and radical prostatectomy. Benign prostatic conditions, such as BPH and prostatitis, can also elevate PSA concentrations. Although the DRE typically causes no clinically important effects on serum PSA concentrations in most patients, in some it may lead to a twofold elevation. 5α-Reductase inhibitors, such as finasteride, for treatment of BPH cause a decrease in PSA concentrations of approximately 50%; thus results should be adjusted. Significant physiologic variation in serum PSA concentrations (up to 30%) has also been noted. PSA testing by itself is limited in the screening or detection of early prostate cancer because PSA is specific for prostatic tissue but not for prostatic cancer. BPH is a common disease in men 50 years of age and older. Studies have shown that PSA concentrations in patients with BPH are similar yet statistically different from those associated with early prostatic cancer (i.e., those of patients with organ-confined cancer).193 Unfortunately, the overlap of PSA concentrations between these two groups is so extensive, particularly between 4 and 10 µg/L, that selecting an optimum cutoff of PSA for the recommendation of a prostate biopsy is almost impossible. Results from the Prostate Cancer Prevention Trial showed the presence of prostate cancer over all ranges of PSA.286 The clinical sensitivity of PSA is 78% at the typically used cutoff of 4.0 µg/L. By lowering the cutoff to 2.8 µg/L, sensitivity increases to 92%, whereas specificity decreases from 33 to 23%. Raising the cutoff to 8 µg/L improves the specificity to 90%.55 Cutoffs lower than 4 µg/L have been suggested, such as by the National Comprehensive Cancer Network (NCCN).185 The use of serum PSA together with DRE is more accurate and sensitive than digital examination alone.49 DRE testing has been determined to be optional aacording to recent ACS guidelines.256,303A PSA for screening is still controversial with recommendations for annual screening put forth by the American Cancer Society (revised in 2010)256,303A and by others,280 and lack of a recommendation by the U.S. Preventive Services Task Force among others. The American Cancer Society256,303A emphasizes informed choice utilizing decision-making tools with screening discussions between patients and their physicians at age 50 for men at average risk with a 10-year life expectancy, and at earlier ages for men at high risk. Men at high risk include black men and men with a strong family history of prostate cancer. Definitive recommendations have awaited results from ongoing prospective randomized trials designed to determine whether PSA screening could reduce mortality from prostate cancer. However, initial results from the European Randomized Study of Screening for Prostate Cancer (ERSPC)241 and the Prostate, Lung, Colorectal, and Ovarian Cancer Screening Trial (PLCO),10 published in 2009, were conflicting. The European trial showed that PSA screening reduced deaths from prostate cancer by 20%, while in the U.S. study, in which men were followed for a shorter period of time and many of the men in the control arm underwent PSA testing, the rate of death from prostate cancer was low overall and did not differ between men screened and those not screened. To improve the ability of PSA testing to detect early prostate cancer (clinical sensitivity) and/or spare unnecessary biopsies (clinical specificity), several approaches have been suggested. One approach is to use age-adjusted reference intervals as follows: 0 to 2.5 µg/L for men aged 40 to 49 years, 0 to 3.5 µg/L for those 50 to 59 years, 0 to 4.5 µg/L for men 60 to 69 years, and 0 to 6.5 µg/L for those 70 to 79 years.194 By lowering the upper limit of the reference interval, more cancer will be detected in younger men, for whom potential cure by radical prostatectomy is most beneficial, although this may increase the overdetection of insignificant tumors. Increasing the upper limit for older men takes into account increases in PSA with aging due to BPH. However, 25% of men with a PSA between 2 and 4 µg/L16,287 may have cancer, similar to the 4 to 10 µg/L range; thus use of age-specific ranges may result in missed clinically significant tumors in older men. Another approach is to use PSA density (i.e., divide PSA concentration by prostatic volume as determined by transrectal ultrasonography) to account for more PSA from larger prostates, as in men with BPH.25 Patients with PSA between 4 and 10 µg/L, a negative DRE result, and elevated PSA density (typical cutoff, 0.15) have increased risk for prostate cancer. The third approach is to use PSA velocity, that is, the rate of PSA increase as a function of time. It is recommended that velocity be calculated using at least three PSA results determined over at least 18 months. Increases in PSA in health, BPH, and prostatic cancer appear to be different, with the highest rate (>0.75 µg/L/y) observed in patients with prostate cancer.47 Specificity improved to 90% for BPH, and sensitivity is 72% for prostate cancer. The PSA velocity cutoff of 0.75 µg/L/y is recommended for men with a total PSA concentration of 4 to 10 µg/L; lower cutoffs of 0.35 to 0.4 µg/L/y are suggested when PSA concentrations are <4 µg/L. The most successful approach has been the use of molecular forms of PSA and free PSA. Percent free PSA (free PSA/total PSA*100) has been used to improve the clinical sensitivity and specificity of detecting prostate cancer, particularly for patients in the diagnostic “gray” zone of PSA between 4 and 10 µg/L or between 2 and 20 µg/L.48,204 Men with cancer have less circulating free PSA (≈10 to 30%) and more PSA bound to protease inhibitors (≈70 to 90%) compared with men without cancer. Percent free PSA results can be interpreted using a single cutoff or a continuum of values to determine the relative risk of prostate cancer in individual men. In biopsied men with a total PSA between 4 and 10 µg/L and a DRE nonsuspicious for cancer, sensitivity for cancer detection is 95% using a %free PSA cutoff of ≤25%. Using this same cutoff (>25%), 20% of biopsied men with benign disease could be spared from biopsy. Percent free PSA may have particular utility in evaluating men who had a previous negative biopsy. A 1996 study of free PSA velocity found that percent free PSA is the earliest serum marker for predicting subsequent diagnosis of prostate cancer.210 Studies have shown that %pPSA (pPSA/free PSA*100) can represent an improvement over %free PSA for the detection of prostate cancer, with particular utility when total PSA is in the 2.5 to 4.0 µg/L range.259,260 Complexed PSA (cPSA) showed improved specificity over total PSA for prostate cancer detection in specific PSA subranges in a multicenter clinical trial.203 In addition to the approaches described previously, several algorithms using PSA and other analytes, and often clinical and demographic characteristics, have been developed to (1) aid in prostate cancer detection, (2) determine risk for prostate cancer (biopsy outcome), and (3) predict prognosis in men with prostate cancer undergoing therapy. They include nomograms and artificial neural networks. The ProstAsure Index, developed by Zhang, Stamey, and Chan,14,269 was derived from several parameters, including age, total PSA, creatine kinase isoenzymes, and prostatic acid phosphatase, which were used as inputs for a neural network–derived, nonlinear algorithmic procedure. The resulting zone reflected the probability of prostate cancer and subsequent consideration for prostate biopsy.
Tumor Markers
Cancer
Historical Background
Year
Author
Marker
1846
H. Bence Jones
Bence Jones protein
1928
W. H. Brown
Ectopic hormone syndrome
1930
B. Zondek
hCG
1932
H. Cushing
ACTH
1949
K. Oh-Uti
Deletions of blood group antigens
1959
C. Markert
Isoenzymes
1963
G. I. Abelev
AFP
1965
P. Gold and S. Freeman
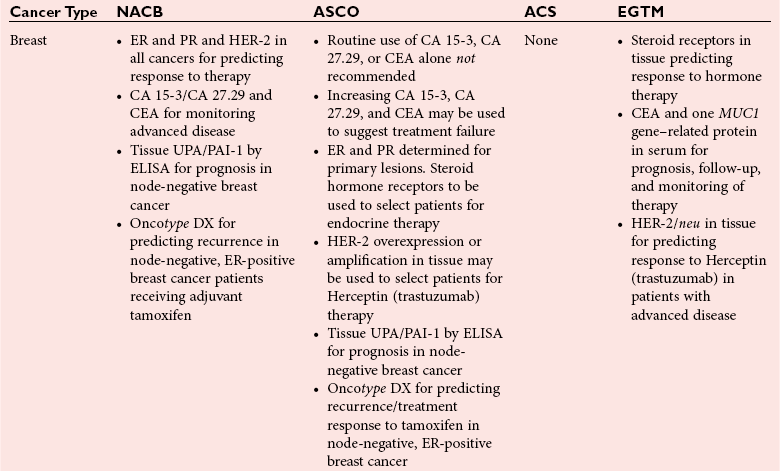
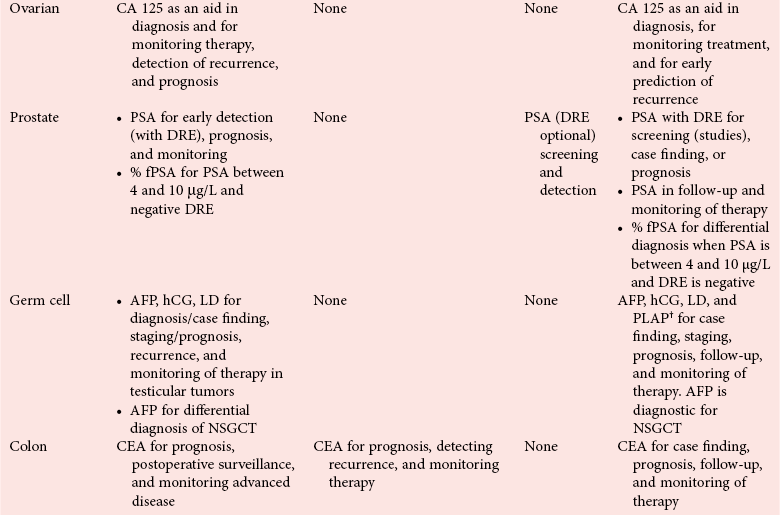
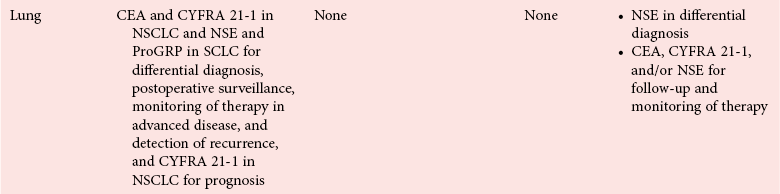
CEA
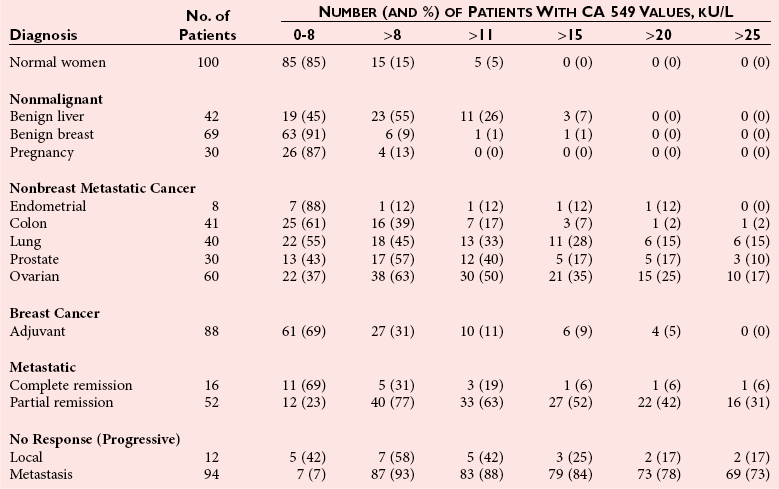
1969
R. Heubner and G. Todaro
Oncogenes
1975
H. Kohler and G. Milstein
Monoclonal antibodies
1980
G. Cooper, R. Weinberg, and M. Bishop
Oncogene probes and transfection
1985
H. Harris, R. Sager, and A. Knudson
Suppressor gene
2001
Multiple investigations
Genomics and proteomics using microarrays, mass spectrometry, neural networks, multiparametric analysis
Clinical Applications
Evaluating Clinical Utility
Reference Intervals
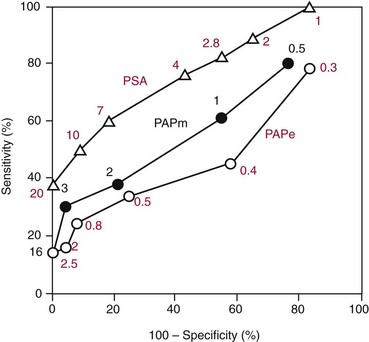
Predictive Value Models
Distribution of Markers
Clinical Guidelines
Analytical Methods
Mass Spectrometry
Microarrays
Enzymes
Enzyme
Assay
Type of Cancer
Alcohol dehydrogenase
Act
Liver
Aldolase
Act
Liver
Alkaline phosphatase
Act
Bone, liver, leukemia, sarcoma
Alkaline phosphatase—placental
Act
Ovarian, lung, trophoblastic, gastrointestinal, seminoma, Hodgkin’s
Amylase
Act
Pancreatic, various
Aryl sulfatase B
Act
Colon, breast
Creatine kinase-BB
IMA
Prostate, lung (small cell), breast, colon, ovarian
Esterase
Act
Breast
Galactosyltransferase
Act
Colon, bladder, gastrointestinal, various
γ-Glutamyltransferase
Act
Liver
Hexokinase
Act
Liver
Lactate dehydrogenase
Act
Liver, lymphoma, leukemia, various
Leucine aminopeptidase
Act
Pancreatic, liver
Neuron-specific enolase
IMA
Lung (small cell), neuroblastoma, carcinoid, melanoma, pheochromocytoma, pancreatic
5′-Nucleotidase
Act/IMA
Liver
Prostatic acid phosphatase
Act/IMA
Prostate
PSA
IMA
Prostate
Pyruvate kinase
Act
Liver, various
Ribonuclease
Act
Various (ovarian, lung, large bowel)
Sialyltransferase
Act
Breast, colon, lung
Terminal deoxytransferase
Act
Leukemia
Thymidine kinase
Act/IMA
Various, leukemia, lymphoma, lung (small cell)
Alkaline Phosphatase
Creatine Kinase
Lactate Dehydrogenase
Neuron-Specific Enolase
Prostatic Acid Phosphatase
Kallikreins
Biochemistry
Clinical Applications
Prostate-Specific Antigen
Biochemistry
Molecular Forms of Prostate-Specific Antigen
Physiologic Properties
Clinical Applications
Screening and Early Detection of Prostate Cancer
![]()
Stay updated, free articles. Join our Telegram channel

Full access? Get Clinical Tree


Tumor Markers