SPSS (International Business Machines Corp., Armonk, New York)
GenStat (VSN International Ltd., Hemel Hempstead, United Kingdom)
Systat (Systat Software, Inc., Chicago, Illinois)
StatXact® (Cytel Inc., Cambridge, Massachusetts)
Stata (StataCorp LP, College Station, Texas)
Parameterizer and Analysis Software System (PASS) (Northrop Grumman Corporation, Falls Church, Virginia)
S-PLUS (TIBCO Spotfire, Somerville, Massachusetts)
Lotus (International Business Machines Corp., Armonk, New York)
SAS (SAS Institute Inc., Cary, North Carolina)
Minitab (Minitab Inc., State College, Pennsylvania)
UNISTAT® (UNISTAT Ltd., London, England)
Dataplot (National Institute of Standards and Technology, Gaithersburg, Maryland)
Microsoft Excel (Microsoft Corporation, Redmond, Washington)
Microsoft Access (Microsoft Corporation, Redmond, Washington)
Statgraphics (StatPoint Technologies, Inc., Warrenton, Virginia)
MATLAB (MathWorks, Inc. Natick, Massachusestts)
Defining Variables
A critical aspect of entering data into a dataset is defining the entry variables. Defining variables involves more than just labeling the variables (i.e., column titles). It entails determining whether a variable is discrete or continuous, dependent or independent, nominal or interval, etc. Discrete variables involve a single set of values (e.g., gender, race), whereas continuous variables carry any value within a defined range (e.g., age, tumor size, receptor binding). Independent variables are the actual data observed and acquired during experimentation, while dependent variables usually reflect outcome measurements of interest (e.g., survival after treatment). Nominal data represent discrete data falling within named categories (e.g., immunohistochemical staining patterns) and interval data account for quantitative differences between categories (e.g., change in tumor size after treatment). Descriptors of nominal data are qualitative and can be summarized as a frequency, percentage, or central tendency (mode) or presented in graphical format as a stacked chart (Fig.15.1), pie chart, or histogram. Quantitative descriptors of interval data include mean and median as measures of central tendency with standard error of mean, standard deviation, and range as calculated markers of variability within a defined interval data category. Interval and ratio data are often summarized in graphical form as bar graphs or box plots which can include median values, interquartile ranges, error bars, etc. (Fig. 15.2).
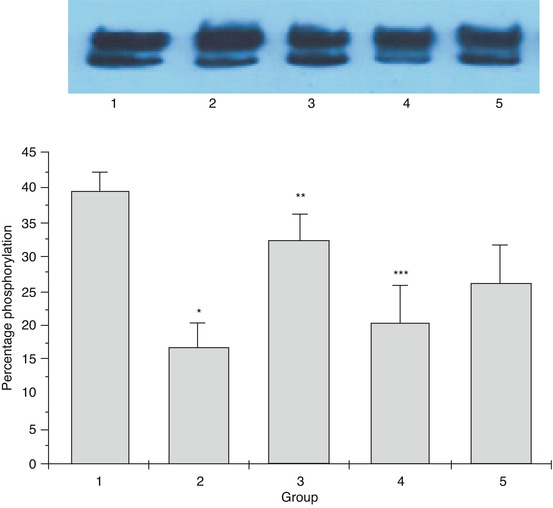
Fig. 15.1
Descriptive statistics – qualitative. Example of a stacked chart showing the number of major and minor hepatectomies performed at an institution during each year included in the study
Fig. 15.2
Descriptive statistics – quantitative. Bar graph summarizing the mean level of phosphorylation determined by Southern blot analysis of samples within five experimental groups. The error bars represent the standard error of mean for each group of samples
Storing Data
While saving and storing data within one or several software applications should be one of the easiest processes of scientific research, its vital importance is often overlooked. Secure storage of data with password protection, especially when it involves individuals’ protected health information, is essential. Data are best stored on desktop computers with proper secondary backup hardware or software salvage programs. Saving data files should be dynamic and continuous and titled appropriately for rapid access and recall. Data entries will need to be changed as a result of a later validation process or recalculation, but the most common change to a data file involves insertion of new variables. Validating and reviewing data are facilitated by proper entries including date of acquisition. Original data files should be maintained for a minimum of 3 years after formal reporting.
Validating Data
Another crucial step of data collection prior to data analysis involves making sure that the entered data and variables are accurate. While simple proofreading will suffice for validating small datasets, larger ones require more labor and thoughtful discourse. Sorting and ranking data for one variable can detect missing data and ensures that data are uniform for a specified variable. Validating single, random, variable data should include a straightforward analysis to measure value range, distribution curve, skewness and kurtosis. These simple validation steps can identify simple errors and omissions which will mislead any recoding of variable data, calculation of dependent variables, and eventually data analysis processes.
Data Analysis: Correlations Between Quantitative Variables
Understanding the correct test and procedure for an intended analysis of a dataset is extremely important. This chapter provides a brief overview of the statistical procedures which are appropriate for straightforward data analysis, but more in-depth statistical analysis requires consultation with a statistics textbook or expert biostatistician.
Stay updated, free articles. Join our Telegram channel

Full access? Get Clinical Tree


