Reaction dynamics II: Catalysis, photochemistry and charge transfer
18.1 Catalysis
What does the chemical industry actually make? This is a question that I do not believe was ever posed to me during my undergraduate or graduate education. So it came as quite a shock when I actually looked it up. In Table 18.1 you will find the top 13 chemicals, top three gases and top two metals listed roughly in order of the amounts produced. Annually, in excess of 300 million metric tonnes (MMt; i.e., >109 kg) of gasoline are produced globally, while over 1000 MMt of iron and over 100 MMt of phosphate, sulfuric acid and ammonia are produced. Much of industrial chemistry involves the transformation of carbon-containing molecules. There are seven ‘building block’ molecules – all derived from petroleum – upon which the chemical industry relies, namely benzene, toluene, xylene, ethylene, propylene, 1,3-butadiene, and methanol.
Table 18.1 Bulk chemical production ranked roughly in order of mass produced worldwide. Process information taken from Ullmann’s Encyclopedia of Industrial Chemistry. Wiley-VCH, Weinheim, 2006.
| Material | Process | |
|---|---|---|
| 1. | Gasoline | Fluid catalytic cracking (FCC) over solid acid catalysts (alumina, silica or zeolite) is performed to crack petroleum into smaller molecules. This is followed by naptha reforming at 1–3 MPa, 300 ≤ T ≤ 450 °C, performed on Pt catalysts, with other metals (e.g., Re) as promoters. |
| 2. | Phosphate rock (P2O5, phosphoric acid) | Digestion of phosphate rock with H2SO4, HNO3 or HCl |
| 3. | H2SO4 | Contact process. Catalytic oxidation of SO2 over K2SO4 promoted by V2O5 on a silica gel or zeolite carrier at 400–450 °C and 1–2 atm, followed by exposure to wet sulfuric acid. |
| 4. | NH3 | Haber–Bosch process, 30 nm Fe crystallites on Al2O3 promoted with K and Ca. SiO2 added as a structural stabilizer, 400–500 °C, 200–300 bar. Recently, a more active but more expensive Ru catalyst has been developed. |
| 5. | Ethylene (C2H4) | Thermal steam cracking of naptha or natural gas liquids at 750–950 °C, sometimes performed over zeolite catalysts to lower process temperature. |
| 6. | Propylene | Byproduct from ethylene and gasoline production (FCC). Also produced intentionally from propane over Pt or Cr supported on Al2O3. |
| 7. | Ethylene dichloride | C2H4 + HCl + O2 over copper chloride catalyst, T > 200 °C, with added alkali or alkaline earth metals or AlCl3 |
| 8. | Cl2 | Chlor-alkali process, anodic process in the electrolysis of NaCl. Originally at graphite anodes but new plants now exclusively use membrane process involving a Ti cathode (coated with Ru + oxide of Ti, Sn or Zr) or porous Ni-coated steel (or Ni) cathode (with Ru activator). |
| 9. | NaOH | Chlor-alkali process, cathodic process in the electrolysis of NaCl. |
| 10. | Benzene | From catalytic cracking of petroleum. FCC process over solid acid catalysts (silica, alumina, zeolite) sometimes with added molybdena |
| 11. | Urea, CO(NH2)2 | Basaroff reaction of NH3 + CO2 |
| 12. | Ethylbenzene | Ethylene + benzene over zeolite catalyst at T < 289 °C and pressures of ∼4 MPa |
| 13. | Styrene | Dehydrogenation of ethylbenzene in the vapor phase with steam over Fe2O3 catalyst promoted with Cr2O3/K2CO3 at ∼620 °C and as low pressure as practicable |
| Gases | ||
| 1. | N2 | Liquefaction of air |
| 2. | O2 | Liquefaction of air |
| 3. | H2 | Steam reforming of CH4 (natural gas) or naptha over Ni catalyst supported on Al2O3, aluminosilicates, cement, and MgO, promoted with uranium or chromium oxides at T as high as 1000 °C. |
| Metals | ||
| 1. | Fe (pig iron) | Carbothermic reduction of iron oxides with coke/air mixture at T ≈ 2000 °C. |
| 2. | Al | Hall–Heroult process. Electrolysis of bauxite (Al2O3) on carbon electrodes at 950–980 °C. |
Looking closer at the processes used to produce these materials you will notice a remarkable trend that 14 of the 18 materials listed below (except for ethylene, N2 and O2) are produced by heterogeneous reactions – that is, reactions which occur in the presence of multiple phases. Propylene is produced in part as the byproduct of a homogeneous gas-phase reaction, and also intentionally through a heterogeneous catalytic process. Urea is produced by a gas/surface reaction that does not require a catalyst. It is estimated that 90% of all industrial chemical processes require catalysis.
Greater selectivity is generally observed in homogeneous catalysis compared to its heterogeneous counterparts. This is especially true when the control of chirality is important, but for bulk chemicals the catalysts are invariably heterogeneous. The cost of separating a homogeneous catalyst either from the product stream or out of the reaction vessel is simply too great unless the product is a high-value-added molecule, such as a pharmaceutical agent.
Ionic liquids offer the advantages of both homogenous and heterogeneous catalysts with their two main characteristics: selected ionic liquids may be immiscible with the reactants and products, but on the other hand the ionic liquid may dissolve the catalysts. Ionic liquids combine the advantages of a solid for immobilizing the catalyst, and the advantages of a liquid for allowing the catalyst to move freely. While not currently widely used in industrial catalysis, ionic liquids may find a growing role in the future.
The refining of petroleum and the production of petrochemicals are not possible at the scale and required cost without the use of catalysis. The use of zeolites is particularly important in this area as both a catalyst and support. Zeolites are of interest as solid-base catalysts for reactions such as condensations, alkylations, cyclizations and isomerizations. Zeolites can also present acid sites or a combination of both acid and base sites. Their flexibility is further enhanced by the nature of their porosity and active sites in that their micropores can be tuned in a size range comparable to that of molecules. The nature of the active sites within these pores is controlled by the substitution of transition metals and other elements into their walls. A particularly popular type of zeolite known as ZSM-5 has the correct pore structure and active sites to convert biomass-derived molecules into aromatic hydrocarbons and olefins.
Many of the other catalytic systems involve transition or coinage metals dispersed on porous oxide substrates. The production of Cl2, NaOH and Al are all electrocatalytic processes. How do catalysts work? What are the active sites? Why are some sites active? These are questions that we need to address. Of course, biochemical reactions often involve catalysis by enzymes. We shall see that a great deal can be transferred from an understanding of catalysis by model heterogeneous systems to the understanding of these highly complex homogeneous catalysts.
The prevalence of catalysis in the chemical and pharmaceutical industries can be attributed to two characteristics – activity and selectivity. Both of these characteristics must be present in a good catalyst, as represented schematically in Fig. 18.1. Simply accelerating reactivity by lowering activation barriers is of no use if side reactions are accelerated to a comparable amount. A good catalyst is also long-lived. It should be regenerated in the process once it has helped to produce a product molecule. Ideally, a good catalyst is also inexpensive. This can be an important practical characteristic. Inexpensive has multiple aspects. One is the cost of the raw materials. Iron, aluminum and zinc are cheap, but rhodium, iridium and platinum are expensive. Replacing precious metals with base metals is a constant topic of research. Separations are expensive; hence, a preference for highly selective heterogeneous catalysts. Replacing a catalyst is expensive both because of the material’s cost and because the process has to be shut down while the catalyst is replaced or regenerated.

Figure 18.1 The purpose of a catalyst is to produce a desired product not only rapidly but also selectively. This requires the catalyst to lower the activation barrier along the desired reaction path such that it is favored more than any other reaction path.
It is important to note that catalysts do not change the thermodynamics of products versus reactants. They do not change the equilibrium constant; rather, they change the kinetics of a reaction. An easier catalytic process to develop is the accelerated production of the thermodynamically most stable species. A more difficult catalytic process to develop is to create a process that selectively creates a thermodynamically less-stable product selectively compared to a more stable product, or to selectively produce just one or a few products out of a selection of molecules that have similar thermodynamic stability. Particularly in the latter case, the best catalyst may not be the most active, but will instead be the one with the most advantageous combination of activity and selectivity.
18.2 Heterogeneous catalysis
A homogeneous catalyst exists in the same phase as the reactants and products, while a heterogeneous catalyst exists in a different (or immiscible) phase. Both types of catalyst enhance activity (accelerate the reaction) and selectivity (make more of a desired product). To learn how they do this we begin with heterogeneous catalysis and the kinetics of surface reactions. Solid surfaces allow us to create model systems that we can investigate experimentally in great detail. What we learn from these model systems will enable us to better understand reactivity and catalysis in general.
Kinetics on solid surfaces is unlike kinetics in other phases because we need to count the number of sites that can react. We have already encountered this is Chapter 17 in the treatment of adsorption and desorption kinetics. Recall that surface concentrations are often quoted in terms of either absolute coverage σ (the number of adsorbates or sites per unit area) or fractional coverage θ,

The variable σ0 is defined as either the total number of adsorption sites or number of surface atoms in a single layer. Let us now discuss three general classes of surface reaction mechanisms and their effects on kinetics.
18.2.1 Surface reaction mechanisms
Reactions occurring on solid surfaces are generally classified as occurring according to one of three classes of mechanisms: Langmuir–Hinshelwood, Eley–Rideal, and hot precursor. Here, we will discuss these three mechanisms in terms of bimolecular reactions. A complete catalytic surface reaction mechanism will include adsorption, reaction, and desorption. Adsorption can be either molecular (nondissociative) or dissociative.
In the Langmuir–Hinshelwood mechanism both species involved in reaction are adsorbed onto the surface,

The mechanism, depicted with an example from Cynthia Friend’s group in Fig. 18.2(a), is named after Irving Langmuir, who received the Nobel Prize in Chemistry 1932, and Cyril N. Hinshelwood, who received the Nobel Prize in Chemistry 1956. The two adsorbates are fully equilibrated with the surface. At least one of these species must be mobile on the surface so that surface diffusion brings about a collision between A and B on the surface. The product AB is then formed at the surface. The product may also be adsorbed onto the surface. However, in some cases the product may have such a short lifetime on the surface that it does not fully equilibrate before it desorbs into the gas phase.

Figure 18.2 (a) Langmuir–Hinshelwood reaction between adsorbates. Provided by Cynthia M. Friend. Reproduced with permission from Xu, B.J., Madix, R.J., and Friend, C.M. (2014) Acc. Chem. Res., 47, 761. © 2014, American Chemical Society. (b) Eley–Rideal reaction between one adsorbed molecule and one molecule from the gas phase. (c) Hot precursor mechanism between one adsorbed molecule and one molecule that has not yet fully equilibrated (the hot precursor).
The defining characteristic of the Langmuir–Hinshelwood mechanism is that both reactants are adsorbed. As we shall explain below, at least one of the reactants will be chemisorbed. Physisorption is not excluded as a possibility for the reactants; however, chemisorption is usually required to sufficiently perturb a molecule such that it will be more reactive than it would be in the absence of a catalyst. Diffusion of adsorbates is also always involved in Langmuir–Hinshelwood reactions. Because both reactants must be adsorbed onto the surface, our first approximation is that the kinetics of a reaction that follows a Langmuir–Hinshelwood mechanism will depend on the coverages of the reactants

Just as for gas-phase elementary reactions, a surface elementary reaction has an order of 1 if it is unimolecular, and an order of 2 if it is bimolecular. For a reaction involving a fluid in contact with a surface (either liquid or gas) the coverage at equilibrium is related to the concentration in the fluid phase by the adsorption isotherm. Thus, the rate will also usually depend on partial pressures or concentrations. However, this dependence may be quite complex and change dramatically with temperature and the magnitude of the concentration because it is the surface coverage and the mixing of adsorbates by diffusion and adsorption that control the rate directly. This mechanism is by far the most commonly observed in catalytic chemistry. Reactions that exhibit Langmuir–Hinshelwood kinetics are expected to depend strongly on the surface temperature.
Dan Eley and Eric Rideal proposed1 an alternative mechanism, as shown in Fig. 18.2(b), in which an adsorbed species reacts directly with a gas-phase species. The rate of reaction should then be directly related to the pressure of the gas-phase species and the coverage of the adsorbed species. Little surface temperature dependence is expected in such a reaction because the incident species must already have sufficient energy to facilitate reaction. It can be shown2 that any reaction with a substantial activation barrier will preferentially react by a Langmuir–Hinshelwood mechanism rather than an Eley–Rideal mechanism.
Ironically, Eley–Rideal dynamics probably was not involved in the experiments for which it was proposed. Clear evidence of the occurrence of a reaction via the Eley–Rideal mechanism did not occur until decades later, the best examples being provided by Charles T. Rettner and Daniel J. Auerbach3 in which H atoms react with adsorb H, D, or Cl atoms. Their work also shows us where an Eley–Rideal reaction might be expected to occur: in the reaction of a radical with an adsorbed species. Reactions involving radicals such as H atoms often exhibit a small or even negligible activation barrier. These direct reactions are known as abstraction reactions. It is usually observed that the abstraction of an atom, as in H + RH → H2 + R, occurs with a much higher rate and lower activation barrier than the abstraction of a radical.
The most convincing manner to prove the occurrence of Eley–Rideal dynamics is to measure the product energy distribution. Because one of the species is not adsorbed, the reaction product must have a ‘memory’ of the energy distribution of the incident molecule. This is exactly what Rettner and Auerbach were able to prove by measuring translational and rovibrational energy state distributions of highly energetic products.
A third mechanism lies intermediate between these two, as shown in Fig. 18.2(c). In the hot precursor mechanism proposed by Bengt Kasemo and John Harris,4 one species is fully equilibrated and adsorbed. The second reactant lands on the surface, enters a mobile precursor state, and before it can fully equilibrate it reacts with the adsorbed reactant. Any time there is the occurrence of Eley–Rideal dynamics there will almost certainly be hot precursor dynamics happening in parallel. At very high temperatures, the surface residence time of adsorbed molecules is extremely short – so short, in fact, that they may not be able to completely equilibrate during the few collisions they have with the surface. Therefore, hot precursor dynamics may be important for understanding the kinetics of high-temperature surface chemistry. For both Eley–Rideal and hot precursor mechanisms, surface diffusion is not required.
18.2.2 Examples of Langmuir–hinshelwood dynamics
The reaction of CO and O2 to produce CO2 is important as a model reaction. It is involved in combustion and is an extremely important reaction that occurs within the catalytic converter in the emissions control system of motor vehicles. Its study has also been the basis of a huge variety of experiments that have advanced our knowledge of catalytic chemistry.
Mix CO and O2 in a glass container at room temperature and 1 bar pressure and the reaction does not proceed at an appreciable rate. Heating the mixture will eventually promote reaction. However, if a film of a platinum group metal is evaporated onto the walls of the container, the reaction occurs rapidly at a much lower temperature. The presence of the metal catalyzes the reaction, making it occur more rapidly at a lower temperature than for the homogeneous gas-phase system.
Now consider the temperature-programmed desorption data in Fig. 18.3. We detect molecules that desorb from a surface as a function of surface temperature and identify them using quadrupole mass spectrometry (QMS). Isotopically labeled 13C16O and 18O2 are exposed to a palladium sample that has been polished to expose the (111) plane. Vibrational spectroscopy shows that both molecules chemisorb to the surface in molecular form when the surface is held at 100 K. When a pure O2 layer is heated, most of the O2 desorbs molecularly below 200 K. A fraction of the molecularly adsorbed O2 dissociates on the surface above 180 K and remains on the surface as chemisorbed O atoms, which recombine to desorb as O2 at high temperature. The CO is more strongly bound than the O2. If only CO were placed on the surface, heating would lead to desorption of molecular CO at around 500 K. When CO is exposed to an O2-covered surface it can actually displace the O2(a) from the surface. When the temperature of a coadsorbed CO + O2-layer is increased, we observe that O2 desorbs molecularly at low temperature just as it did from the pure layer. For the conditions used in this experiment there is some desorption of CO in the 500 K peak expected of a pure CO-layer. We also observe the presence of a new peak, which corresponds to the production of CO2 above 350 K. Importantly, the CO2 desorbs at 18O13C16O. No CO2 is detected while the surface is held at 100 K and exposed to CO and O2 simultaneously, when CO is exposed to an O2 layer, or when O2 is exposed to chemisorbed CO. Vibrational spectroscopy reveals that CO2(a) is not stable on the surface at 350 K (its desorption peak is below 100 K). Therefore, the desorption of CO2 is reaction-limited – as soon as the CO2 is formed it immediately desorbs.

Figure 18.3 CO oxidation on Pd(111) clearly follows a Langmuir–Hinshelwood mechanism because the product CO2 is only detected in a mass spectrometer after O2 and CO have adsorbed onto the surface, and then the surface is heated sufficiently to overcome the barrier to reaction. The reaction only commences after some O2 has desorbed molecularly and some of the adsorbed O2 had dissociated to adsorbed atoms. The O(a) then reacts with CO(a) within the peak that has a maximum just above 400 K. Not all of the CO(a) reacts; hence, some is left to desorb molecularly in the peak centered at 500 K. Reproduced with permission from Kolasinski, K.W., Cemič, F., de Meijere, A., and Hasselbrink, E. (1995) Surf. Sci., 334, 19. © 1995, Elsevier.
These observations allow us to conclude that this reaction occurs via a Langmuir–Hinshelwood mechanism, and the reaction product is only formed after both reactants are adsorbed onto the surface. Furthermore, the reaction occurs between O(a) that results exclusively from the dissociation of O2 and neither from any dissociation of CO nor the reaction of CO with CO. This is proven by the observation of isotopic mixing in the CO2 and the lack of mixing in the desorbed CO. The CO oxidation reaction, therefore, exhibits the following mechanism

Overall:

Recall that a mechanism must always sum to produce the stoichiometry of the overall reaction. Hence the need for the stoichiometric number  in the first two steps.
As long as this reaction is performed at low coverage conditions (a combination of a high enough temperature and low enough partial pressures of CO and O2), the rate-determining step is the surface reaction in the final step. As alluded to above, the chemisorption of CO and O2 is competitive. CO can displace O2 from the surface. CO oxidation exhibits asymmetric inhibition. CO can adsorb onto a surface that is covered with O2 or O. Their saturation coverage is low and provides empty sites. However, CO forms a dense layer upon which O2 cannot dissociate (dissociation requires adjacent empty sites). This asymmetry means that, under the correct conditions of pressure and temperature, this system exhibits oscillatory kinetics and spatiotemporal pattern formation5 such as target patterns, spiral waves and soliton waves.
The ammonia synthesis reaction

in the Haber–Bosch process is an extremely important industrial reaction since it underpins modern agriculture and without it, the world’s population could not be fed. It is estimated that roughly 3% of world energy consumption is used to run this reaction. Its importance is reflected in history: Fritz Haber was awarded the Nobel Prize in Chemistry 1918 for the synthesis of ammonia from its elements. Carl Bosch was awarded the Nobel Prize in Chemistry 1931 for developing a practical high-pressure processes to carry out the reaction industrially. Gerhard Ertl was awarded the Nobel Prize in Chemistry 2007 for his studies of chemical processes on solid surfaces, in particular elucidating the mechanism of the ammonia synthesis reaction. Under industrially relevant conditions, the rate-determining step is the dissociation of N2. A large activation barrier stands between N2(g) and the adsorbed atoms. After the dissociation of N2 and H2, the chemisorbed atoms react to form NH(a), NH2(a), then NH3 that immediately desorbs. But why does adsorption represent the rate-determining step in one Langmuir–Hinshelwood reaction, while a surface reaction between adsorbates determines the rate in another? These details will always be specific to the reaction system of interest, but to address them more generally we need to understand more about the chemisorption bond and how a catalyst works.
Before we move on to a discussion of chemisorption, let us consider the reaction of CO2 + NH3. Kinetic data for this reaction is depicted in Fig. 16.1. CO2 is created in large quantities during ammonia synthesis because H2 is produced by the steam reforming of hydrocarbons or coal. As an example, H2 is produced from natural-gas-sourced methane,

after which CO2 is formed by CO oxidation. The reaction of CO2 + NH3 to produce ammonium carbamate is the first step in the Basaroff reaction to form urea. The second step is decomposition at high temperature and pressure to form CO(NH2)2 + H2O. The data in Fig. 16.1 show that ammonium carbamate formation exhibits simple first-order kinetics when formed from a stoichiometric mixture of CO2 + NH3 at 45 kPa and room temperature. A plausible explanation of the simple kinetics for this complex surface reaction can be found in the discussion above. The first two steps of the mechanism are the adsorption of NH3 and CO2

We do not know what the surface reaction steps are without further investigation. NH3 is bound strongly enough at room temperature that is rapidly achieves its saturation coverage under these conditions, and this coverage is little affected by changes in NH3 pressure over a wide range. CO2 is extremely weakly bound. Its saturation coverage is much smaller than that of NH3, and because of this its coverage is limiting the reaction rate. The adsorption of CO2, a process that is first order in CO2 partial pressure, is the rate-limiting step of the reaction.
18.2.2.1 Directed practice
Why is the CO2 peak so small and the CO peak so large in Fig. 18.3?
18.2.3 Molecular chemisorption: The Blyholder model of CO chemisorption
Molecules and atoms can either physisorb or chemisorb to surfaces. Physisorption is controlled by weak intermolecular interactions. The properties of the molecule are little changed by physisorption. The electronic levels do not shift or distort much compared to a gas-phase molecule. The vibrational frequencies do not change much either. In other words, the bonding in the molecule does not change much and, therefore, the reactivity of the molecule does not change much. Physisorbed molecules also tend to have a short lifetime on the surface because of the weak binding. The only time that physisorption will be important for catalysis is if the molecule is reactive enough already but we need to bring it into contact with a reactive species at the surface of the catalyst.
Chemisorption is much more important for activating molecules. Chemisorption involves the establishment of new chemical interactions with a surface. Much like there is conservation of mass and charge and energy, there is in a certain sense also a conservation of bonding. If an adsorbate makes new chemical bonds with a surface and it was fully saturated before interacting with the surface, then the chemisorbed species makes its chemisorption bond at the expense of the strength of other bonds in the molecule. This and the Sabatier principle are the essence of catalysis. Enunciated by Paul Sabatier,6 this principle states:
The best catalyst is one with intermediate chemical interactions. One that binds too strongly may never allow the reactants to react or may not allow release of products. One that binds too weakly may not activate the reactants or may not have a long enough residence time to allow them to meet and react.
How does the chemisorption bond form? We answer this with the help of Fig. 18.4 and take CO as a specific example. George Blyholder7 was the first to describe chemisorption along these lines. A molecule in the gas phase has energy levels with well-defined (sharp) energies. Each one of these levels contains two electrons, or one electron if the molecule is also a radical. There are also normally unoccupied orbitals, which contain no electrons when the molecule is in the ground state. These orbitals are occupied in excited states. Each molecular orbital is described as being bonding, antibonding, or nonbonding. A bonding orbital stabilizes the molecule. The occupation of such an orbital lowers the energy of the molecule by prompting bond formation. Bonds form when electron–electron and nucleus–nucleus repulsions are minimized and electron–nucleus interactions are maximized. An antibonding orbital destabilizes the bonding in the molecule. One half of the sum of all the electrons in bonding orbitals minus the number of electrons in antibonding orbitals is equal to the bond order. The higher the bond order, the stronger the bonding in a molecule. The occupation of nonbonding orbitals does little or nothing to change the bond order. An example is a lone pair of electrons.

Figure 18.4 (a) Quantum chemical calculations reveal the shapes of the 5σ (HOMO) and 2π* (LUMO) molecular orbitals of CO. (b) Diagram of broadening and shifting of adsorbate levels as they approach a surface. EF, Fermi energy; Evac, vacuum energy; Φ work function of the surface material; E1, E2, E3, energies of molecular orbitals 1, 2 and 3, respectively, of the molecule far from the surface; E1,ads, E2,ads, E3,ads, energies of molecular orbitals 1, 2 and 3, respectively, of the adsorbed molecule; shaded area, occupied band (e.g., valence band). Reproduced with permission from Kolasinski, K.W. (2012) Surface Science: Foundations of Catalysis and Nanoscience, 3rd edition. John Wiley & Sons, Chichester.
We will take our surface to be that of a transition metal. All states are filled up to the Fermi energy EF. The valence electron states form bands with a width of several electron volts rather than sharp levels. As a molecule approaches the surface, its sharp levels begin to interact with the surface electronic states, and this causes the molecular levels to shift and broaden in energy. The broadening and shifting are caused by mixing the molecular wavefunctions with the metallic wavefunctions. The molecular states remain primarily localized on the molecule and we can think of the two systems as largely separate.
Once the molecule is attached to the surface, the occupation of electronic states follows the same rule: all states below EF must be occupied. However, now that the electronic states of the molecule are broadened, there are three possibilities: (i) A state that lies fully below EF will be completely occupied with two electrons; (ii) A state that lies fully above EF will be fully empty with zero electrons; and (iii) A state that straddles the Fermi energy will be partially occupied with more than zero but fewer than two electrons.
As in coordination chemistry, the first orbitals to consider are the frontier orbitals – the highest occupied molecular orbital (HOMO) and the lowest unoccupied molecular orbital (LUMO). Core levels are strongly localized about their nuclei and do not participate in bonding directly. We will discuss bonding and molecular orbitals in detail in Chapter 25. For CO the HOMO is a 5σ orbital; the LUMO is a 2π* orbital. The 5σ is nonbonding with respect to the C−O bond. The 2π* orbital is antibonding with respect to the C−O bond. The 5σ orbital is localized on the C end of the molecule. The 2π* is symmetrically distributed along the molecular axis.
In the chemisorbed state, the 5σ orbital is completely occupied as it lies below EF. The 2π* is partially occupied. The degree to which it is occupied depends on which metal the CO is binding to. The 5σ orbital interacts strongly with the metal electrons. Effectively, the electron density of the 5σ orbital is donated to the metal and new hybrid electronic states are formed. The state created by donation from the 5σ orbital is bonding with respect to the chemisorption bond. This state is predominately localized about the C end of the molecule. The 2π* orbital accepts electron density from the metal through a process called backdonation. New hybrid electronic states are constructed which are primarily localized about the CO molecule and are bonding with respect to the chemisorption bond. The overlap of the 5σ orbital with the metal states is most favorable if the molecule is oriented with the C end toward the surface. The overlap of the 2π* orbital with the metal states is most favored by a linear geometry. Consequently, we predict that the CO molecule should chemisorb C-end down, with its axis along the normal to the surface. This expectation is confirmed by experiment. CO is nearly always bound in an upright geometry.
Donation from the nonbonding 5σ orbital has little effect on the strength of the C−O bond. In contrast, backdonation into the antibonding 2π* orbital decreases the bond order of the C−O bond. Decreasing bond order means that the CO molecule is more weakly bound and is reflected in a decrease in the vibrational frequency of the C−O stretch. Decreasing the bond order also makes CO in the chemisorbed state more reactive than CO in the gas phase. The metal catalyzes reactions involving CO – not only CO oxidation but the rich chemistry known as Fischer–Tropsch chemistry that starts with mixtures of CO + H2 – by producing a more active chemical form of CO with a weaker C−O bond.
18.2.4 Dissociative chemisorption of H2: The Nørskov model
Some catalytic reactions require not just the weakening of bonds, but the breaking of them. The simplest case is that of H2, which has just two electrons in one bonding molecular orbital, the 1σ orbital. To break the H–H bond we could imagine sucking the electrons out of the bonding orbital to reduce the bond order. Alternatively, in analogy with what happened with backbonding to CO, we might add electron density to the next higher molecular orbital, the antibonding 1σ* orbital. A series of calculations by Jens K. Nørskov and coworkers8 demonstrated that it is the latter that occurs. They also developed the following description of the dissociation dynamics that we trace in Fig. 18.5.
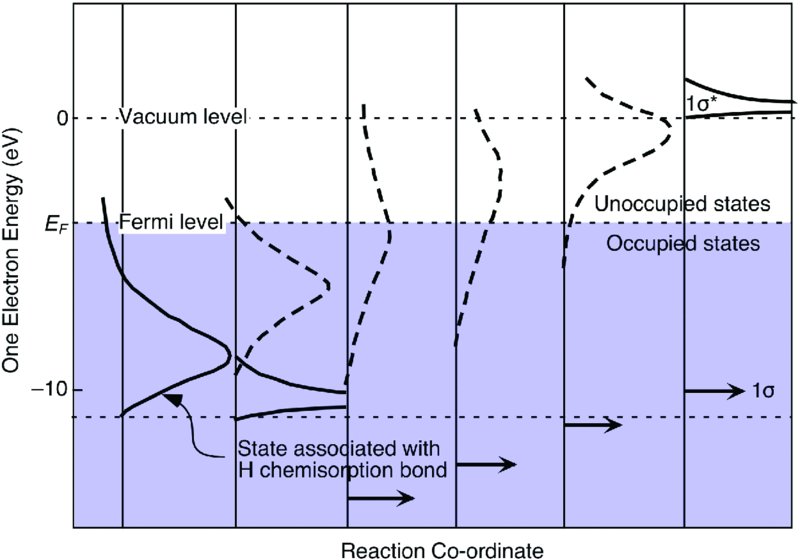
Figure 18.5 Progressive filling of the antibonding molecular orbital of H2 as it approaches the surface weakens the H–H bond and eventually leads to dissociative hydrogen adsorption. The presence of an activation barrier to dissociative adsorption depends on the interplay between the energetic cost of Pauli repulsion and the energetic gain of forming new bonds to the surface. Redrawn after the work of Nørskov, J.K., Houmøller, A., Johansson, P.K., and Lundqvist, B.I. (1981) Phys. Rev. Lett., 46, 257. Original figure © American Physical Society.
As a closed-shell species such as H2 approaches a surface, a repulsive interaction develops due to the Pauli repulsion of the electrons in the solid and the fully occupied 1σ molecular orbital in the molecule. For a rare gas atom this is the end of the story. The interaction of the electrons simply becomes more repulsive as we push the atom closer to the surface. There is a weak physisorption minimum relatively far from the surface caused by van der Waals forces; however, no chemical bond is formed. For H2, on the other hand, electron density can be donated from the metal into the 1σ* antibonding orbital if its energy falls below the Fermi level. Electron transfer leads to a weakening of the bond, and eventually dissociation will occur if enough electron density can be transferred.
We see that there is a competition between the Pauli repulsion, which raises the energy of the system, and the donation of electron density into the 1σ*, which lowers the energy of the system. Donation occurs because the 1σ* drops in energy and broadens as H2 approaches the surface. When it drops below EF, electron density is transferred from the metal to the H2 molecule. This interaction is bonding with respect to the surface but antibonding with respect to the H–H bond. If the energetic stabilization achieved by donation into the 1σ* exceeds the destabilization engendered by the Pauli repulsion, the energy landscape is downhill all the way. Adsorption is nonactivated, analogous to the potential energy curve in Fig. 17.7(a). In contrast, if the destabilization caused by Pauli repulsion exceeds the stabilization accompanying the formation of the chemisorption bond, adsorption will be activated and follow a potential energy curve of the type shown in Fig. 17.7(b). The presence or absence of a barrier depends on which metal is chosen. A high barrier is found on the coinage metals Cu, Ag and Au, while a small or no barrier is found on the platinum group metals, Pt, Pd, Ir, and Rh. The height of the barrier is quite sensitive to electronic structure. Therefore, some sites on a surface, such as steps, may exhibit a lower barrier than others, such as terraces.
From this dynamics we can state a general principle regarding activation barriers in chemical reactions.
It costs energy to break bonds and push occupied states together. Energy is released when bonds are formed. A transition state is formed by pushing molecules together to make and break bonds. When more breaking than making occurs, a large activation barrier will arise.
18.2.5 Promoters and poisons
The geometrical and electronic structure of catalysts can be manipulated to tailor the reactivity of catalysts. Agents that enhance reaction rates are called promoters, while those that decrease reactivity are called poisons. Promoters are usually beneficial. Poisons must often be avoided, though they can also be employed to shut down unwanted side reactions.
The reactivity of a catalyst – its ability to partake in donation and backdonation – is strongly correlated with its geometric and electronic structure. Promoters change (or stabilize) some aspect of geometrical or electronic structure that enhances reaction rates. For example, in the ammonia synthesis reaction N2 dissociation is rate-limiting. Just as for H2 dissociation, N2 dissociation is facilitated by shifting electron density from the surface to antibonding orbitals on the molecule. Increasing the electron density on the metal that is available for donation should help activate the N2 molecule by lowering the barrier to dissociation. The addition of an electropositive metal such as K to the catalyst, which is made of Fe, has precisely this beneficial effect. The adsorbed K atom, which resembles a positive ion when it is chemisorbed may also be able to stabilize the transition state of the dissociating molecule by electrostatic interactions. The addition of K to the ammonia synthesis catalyst is an example of electronic promotion – the addition of promoters to enhance the reactivity of the catalyst.
The Fe catalyst only remains highly active if the Fe is dispersed in nanoscale particles on the surface of a porous Al2O3 substrate. At the high temperatures associated with the Haber–Bosch process, the Fe has a tendency to ball up into larger particles as expected from Ostwald ripening; this process is called sintering. The addition of CaO and MgO to the catalyst is found to stabilize the structure of the catalyst and reduce the rate of sintering. This is an example of geometric promotion – the addition of promoters that keep the catalyst in its active form.
Poisons also act through both geometrical and electronic mechanisms. Geometrical poisoning is most commonly a short-range direct interaction called site blocking. We have already encountered the effects of site blocking in the Langmuir model of adsorption and in the asymmetrical inhibition of CO oxidation. If sites are occupied by atoms or molecules that do not participate in the reaction, then those sites are lost as far as enhancing the rate of reaction. Particularly sensitive to the effects of site-blocking poisons are catalysts that only exhibit reactivity at minority active sites. If these active sites are blocked the reactivity can be shut down entirely.
Poisons can also act through long-range electronic effects. Imagine that we add an electronegative species such as As, P or S rather than an electropositive species to our ammonia synthesis catalyst. The electron-withdrawing nature of these atoms deactivates a number of atoms around them, not just the one site they are bound to. Thankfully, both S and Pb poison the threeway automotive catalyst. Immediately upon introduction of the catalytic converter, which has as its active component a mixture of Pd, Pt and Rh, it became apparent that the S content of fuel has to be reduced and the Pb content had to be removed. The reduction of S is nice because it reduces odors and the formation of particulate matter. Humans will be forever grateful for the removal of Pd from motor fuels, as Pb exposure – particularly at an early age – is correlated with a decreased IQ and increases in both violent and addictive behavior. The removal of Pb from motor fuel has greatly reduced the environmental loading of Pb. The drop in Pd pollution associated with automotive exhaust has been measured directly in Alpine glacial lake sediments and Antarctic ice cores.
18.2.6 Directed practice
What is meant by a short-range or a long-range effect of a promoter or poison?
18.3 Acid–base catalysis
Reactions in aqueous solutions can often be homogeneously catalyzed by acid, base or both, as is the case for ester hydrolysis. A hydrolysis reaction will exhibit pseudo-first-order kinetics in the concentration of the substrate [S]. In specific acid–base catalysis, the rate is equal to the sum of the uncatalyzed reaction, with rate constant k0, plus the rates of the reactions catalyzed by acid and base, with rate constants kH and kOH, respectively,

The concentrations of H+ and OH– are linked by the water autoionization equilibrium

Therefore, the rate of reaction can be written in terms of an effective first-order rate equation

where

Obviously, at pH values far from neutral, only acid or base catalysis – but not both – will contribute significantly to the reaction rate. If at a low pH the reaction rate is dominated by acid catalysis, then we can neglect the base-related term. Taking the logarithm of Eq. (18.8) yields

A plot of lg k versus pH should then have a slope of –1 at sufficiently low pH. If the reaction rate is dominated by the uncatalyzed reaction near neutral pH, the line will become a curve and then a horizontal line when the acid-catalyzed pathway is no longer important due to the low concentration of H+. If increasing the pH further leads to reaction dominated by the base-catalyzed mechanism, the rate constant will then be described by

The plot of lg k versus pH will curve upward and approach a slope of +1 at sufficiently high pH. This ideal behavior is depicted in Fig. 18.6. Obviously, if either the acid-catalyzed or base-catalyzed pathway is negligible, one branch of the curve will be missing. Should the uncatalyzed reaction rate be negligible, the middle portion of the plot exhibits curvature rather than a horizontal line.

Figure 18.6 The effective rate constant is plotted versus pH for cases in which the balance between acid-catalyzed, base-catalyzed and uncatalyzed pathways changes. (a) All three contribute, kH = kOH = 102k0. (b) The uncatalyzed pathway is negligible, kH = kOH = 106k0. (c) The acid-catalyzed pathway dominates, kH = 1010kOH = 104k0. (d) The base-catalyzed pathway dominates, 1011kH = kOH = 105k0.
An important example of acid catalysis occurs in atmospheric chemistry. Sulfuric acid is produced in a clear sky by the reaction mechanism (all species in the gas phase)


M is an unreactive third-body that affects only energy transfer. The rate-determining step is the first reaction, which is sufficiently slow that the atmospheric lifetime of SO2 should be one to two weeks. This contradicts the experimental observation that SO42– concentrations in acid rain are at a maximum over the SO2 source (usually fossil fuel combustion or metal ore smelting). The answer to this riddle is that SO2 dissolves in water droplets found in clouds,

where it can react with hydrogen peroxide that also reversibly dissolves in the droplets


The acid-catalyzed reaction in Eq. (18.16) is extremely rapid, which results in the localization of SO42– production to the atmosphere close to the source rather than allowing for more widespread dispersion.
18.4 Enzyme catalysis
Certain proteins act as biological catalysts and are known as enzymes. Evolution has optimized enzymes to selectively accelerate biochemical reactions with amazing efficiency. For example, the hydrolysis of peptide bonds occurs uncatalyzed in aqueous solutions with a half-life of about 300–600 years. But in the presence of the appropriate enzyme catalyst, this half-life is reduced to roughly 1 ms if the reaction is not limited by diffusion. Evolution has incorporated promoters and structural sensitivity to optimize the performance of enzymes by constructing the active site and its surroundings in response to performance constraints. It has optimized them to work under quite specific conditions. Enzymatic activity is strongly dependent on temperature and pH. The conditions of highest activity are referred to as the optimum temperature and optimum pH.
Proteins that are folded into the conformation that corresponds to their functional form are called native proteins. Many native proteins are stable to temperatures above 100 °C. Above this temperature they undergo a process akin to a melting transition in which the protein unfolds into a nonfunctional form; this process is called denaturation. Enzymes are sensitive to denaturation and some lose their activity only a few degrees above their optimum temperature. Reversible changes in enzymatic activity occur over a range of pH values near the optimum pH. Many enzymes experience irreversible denaturation at extremes of high and low pH.
The first-order approximation to how enzymes work is based on the proposal from Emil Fischer in 1890 of the ‘lock-and-key’ mechanism. A certain substrate S fits into the active site of enzyme E and this facilitates the production of the product P. Whilst there is some truth to this, such as mechanism is literally too rigid. The chemical functionality of enzymes is better understood in terms of five important points:
- Proximity and configuration are critical. One of the most important things that an enzyme does is to bring the reactants into a favorable geometry.
- The enzyme is flexible such that only a specific substrate induces the proper interactions that lead to catalysis. These changes were proposed by David Koshland9 in a stark break with the unforgiving ‘lock-and-key’ mechanism. The nature of the conformational relaxation into the configuration that characterizes the enzyme–substrate complex falls somewhere between two extremes. One corresponds to the induced fit mechanism as originally proposed by Koshland in which the initial recognition step causes the subsequent conformational relaxation. The opposite extreme is called the conformational selection mechanism, in which the proteins explore a number of different conformations. Binding only occurs after the correct configuration is obtained.
- The protein structure surrounding the active site creates a microenvironment that optimizes reactivity of the catalytic groups. This microenvironment shields the active site from the bulk solvent (water). Furthermore, the dynamics of the protein may actually facilitate procession of the activated complex from the transition state to the products by favoring movement along the reaction coordinate. It does so while disfavoring vibrational motions that do not advance the activated complex along the catalytic path.
- Enzymes can cause the substrate to adopt an activated configuration that is much more reactive than its equilibrium configuration.
- Enzymes can stabilize the transition state, often by electrostatic interactions. Stabilization can also occur through hydrogen-bonding interactions that take place because of precise matching of the pKa values of donor and acceptor moieties.
The role of structural dynamics – topology and conformational changes – in enzyme catalysis is central to understanding their reactivity. Thus, as shown in Fig. 18.7 it is better to represent the potential energy diagram leading from reactants to products not in terms of a single one-dimensional Lennard–Jones type curve, but rather in terms of a two-dimensional landscape of such curves. This picture emphasizes that the catalytic energy profile (up and over the barrier) is influenced by the conformational landscape. Changes in conformation change the catalytic energy profile. The existence of multiple conformations allows the reactive system to sample multiple transition states (and reactive intermediates) as it searches the catalytic–conformational energy landscape. The path from reactants to products is anything but a simple up and over the barrier trajectory. If the reaction corresponds to proton-coupled electron transfer (as is often the case in enzyme-catalyzed reactions), the generalized reaction coordinate needs to be further resolved into a collective solvent coordinate along the electron transfer path and another along the proton transfer path, as done in the theoretical work of Sharon Hammes-Schiffer and coworkers.10 Structural changes can also dramatically change the time scales of the motions involved in the reaction path.

Figure 18.7 A schematic representation of the Gibbs energy landscape of an enzyme-catalyzed reaction. Conformational changes occur along both axes. The conformational changes occurring along the reaction coordinate axis correspond to the environmental reorganization that facilitates chemical reaction. The conformation changes directed along the ensemble conformations axis represent the ensembles of configurations existing at all states along the reaction coordinate. Provided by Sharon Hammes-Schiffer. Reproduced with permission from Benkovic, S.J., Hammes, G.G., and Hammes-Schiffer, S. (2008) Biochemistry, 47, 3317. © 2008, American Chemical Society.
Enzymes display different degrees of specificity. Some are exquisitely selective and can transform only one substrate. An example of this type is urease, which only catalyzes the hydrolysis of urea,

Stay updated, free articles. Join our Telegram channel

Full access? Get Clinical Tree


