CHAPTER 17 Properties of the Vasculature
The vasculature consists of a closed system of tubes or vessels that distributes blood from the heart to the tissues and returns blood from the tissues to the heart. It can be divided into three components: the arterial system, which takes blood from the heart and distributes it to the tissues; the venous system, which returns blood from the tissues to the heart; and the microcirculation, which separates the arterial and venous systems and is the site where nutrients and cellular waste products are exchanged between blood and tissues. These components of the vasculature are presented in this chapter. In addition, the properties of blood flow to specific vascular beds and tissues are considered. As an introduction to this material, the physics of blood/fluid flow through the vasculature (i.e., hemodynamics) is reviewed.
HEMODYNAMICS
Velocity of the Bloodstream
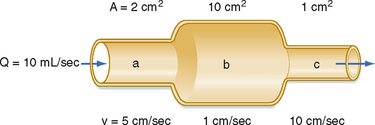
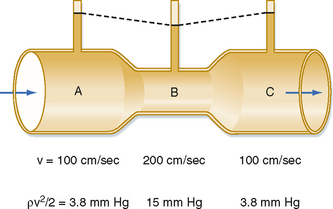
The interrelationships among velocity, flow, and area are shown in Figure 17-1. Because conservation of mass requires that the fluid flowing through a rigid tube be constant, the velocity of the fluid will vary inversely with the cross-sectional area. Thus, fluid flow velocity is greatest in the section of the tube with the smallest cross-sectional area and slowest in the section of the tube with the greatest cross-sectional area.
As shown in Figure 15-3, velocity decreases progressively as blood traverses the arterial system. At the capillaries, velocity decreases to a minimal value. As the blood then passes centrally through the venous system toward the heart, velocity progressively increases again. The relative velocities in the various components of the circulatory system are related only to the respective cross-sectional areas.
Relationship between Velocity and Pressure
The total energy in a hydraulic system consists of three components: pressure, gravity, and velocity. The velocity of blood flow can have an important effect on the pressure within the tube. Consider the effect of velocity on pressure in a tube with different cross-sectional areas (Fig. 17-2). An ideal fluid flows in this system, in which the total energy remains constant. The total pressure within the tube equals the lateral (static) pressure plus the dynamic pressure. The gravitational component can be neglected because the tube is horizontal. The total pressures in segments A, B, and C will be equal, provided that the energy loss from viscosity is negligible (viz., this fluid is an “ideal fluid”). The effect of velocity on the dynamic component (Pdyn) can be estimated from
where ρ is the density of the fluid (g/cm3) and v is velocity (cm/sec). The fluid has a density of 1 g/cm3. In section A, the lateral pressure is 100 mm Hg; note that 1 mm Hg equals 1330 dynes/cm2. From Equation 17-2, Pdyn = 5000 dynes/cm2, or 3.8 mm Hg. In the narrow section B of the tube where the velocity is twice as great, Pdyn = 20,000 dynes/cm2, or 15 mm Hg. Thus, the lateral pressure in section B will be 15 mm Hg less than the total pressure, whereas the lateral pressure in sections A and C will be only 3.8 mm Hg less. In most arterial locations, the dynamic component will be a negligible fraction of the total pressure. However, at sites of an arterial constriction or obstruction, the high flow velocity is associated with a large kinetic energy, and therefore the dynamic pressure component may increase significantly. Hence, the pressure would be reduced and perfusion of distal segments will be correspondingly decreased. This example helps explain how pressure changes in a vessel that is narrowed by atherosclerosis or spasm of the blood vessel wall. That is, in narrowed sections of a tube, the dynamic component increases significantly because the flow velocity is associated with a large kinetic energy.
Relationship between Pressure and Flow
Poiseuille’s Law
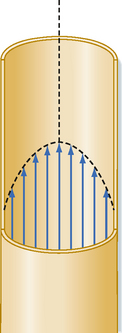
Poiseuille’s law applies to the steady (i.e., nonpulsatile) laminar flow of newtonian fluids through rigid cylindrical tubes. A newtonian fluid is one whose viscosity remains constant, and laminar flow is the type of motion in which the fluid moves as a series of individual layers, with each layer moving at a velocity different from that of its neighboring layers (Fig. 17-3). In the case of laminar flow through a tube, the fluid consists of a series of infinitesimally thin concentric tubes sliding past one another. Despite the differences between the vascular system (i.e., flow is pulsatile, the vessels are not rigid cylinders, and blood is not a newtonian fluid), Poiseuille’s law does provide valuable insight into the determinants of blood flow through the vascular system.
where
Resistance to Flow
Similarly, in fluid mechanics, hydraulic resistance, R, may be defined as the ratio of the pressure drop, Pi − Po, to flow, Q.
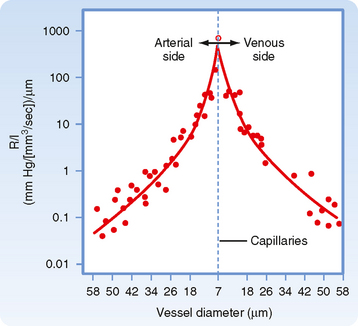
The principal determinant of resistance to blood flow through any vessel is the caliber of the vessel because resistance varies inversely as the fourth power of the radius of the tube. In Figure 17-4, the resistance to flow through small blood vessels was measured and the resistance per unit length of vessel (R/l) was plotted against the vessel diameter. As shown, resistance is highest in the capillaries (diameter of 7 μm), and it diminishes as the vessels increase in diameter on the arterial and venous sides of the capillaries. Values of R/l are virtually proportional to the fourth power of the diameter (or radius) of the larger vessels on both sides of the capillaries.
It is apparent from Figure 15-3 that the greatest drop in pressure occurs in the very small arteries and arterioles. However, capillaries, which have a mean diameter of about 7 μm, have the greatest resistance to blood flow. Nevertheless, it is the arterioles, not the capillaries, that have the greatest resistance of all the different varieties of blood vessels that lie in series with one another (as in Fig. 15-3). This seeming paradox is related to the relative numbers of parallel capillaries and parallel arterioles. Most simply, there are far more capillaries than arterioles in the systemic circulation, and total resistance across the many capillaries arranged in parallel is much less than total resistance across the fewer arterioles arranged in parallel. In addition, arterioles have a thick coat of circularly arranged smooth muscle fibers that can vary the lumen radius. Even small changes in radius alter resistance greatly, as can be seen from the hydraulic resistance equation (Equation 17-6), wherein R varies inversely with r4.
Resistances in Series and in Parallel
In the cardiovascular system, the various types of vessels listed along the horizontal axis in Figure 15-3 lie in series with one another. The individual members of each category of vessels are ordinarily arranged in parallel with one another (Fig. 15-1). Thus, capillaries throughout the body are in most instances parallel elements, except for the renal vasculature (in which the peritubular capillaries are in series with the glomerular capillaries) and the splanchnic vasculature (in which the intestinal and hepatic capillaries are aligned in series with each other). The total hydraulic resistance of components arranged in series or in parallel can be derived in the same manner as those for analogous combinations of electrical resistance.
Resistance of Vessels in Series.
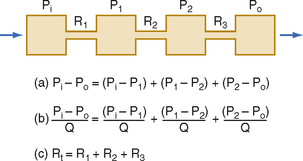
Three hydraulic resistances, R1, R2, and R3, are arranged in series in the system depicted in Figure 17-5. The pressure drop across the entire system (i.e., the difference between inflow pressure, Pi, and outflow pressure, Po) consists of the sum of the pressure drops across each of the individual resistances (equation a). In steady state, the flow, Q, through any given cross section must equal the flow through any other cross section. By dividing each component in equation a by Q (equation b), it is evident from the definition of resistance (Equation 17-5) that for resistances in series, the total resistance, Rt, of the entire system equals the sum of the individual resistances, that is,
Resistance of Vessels in Parallel.
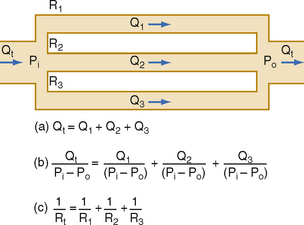
For resistances in parallel, as illustrated in Figure 17-6, inflow and outflow pressure is the same for all tubes. In steady state, the total flow, Qt, through the system equals the sum of the flows through the individual parallel elements (equation a). Because the pressure gradient (Pi − Po) is identical for all parallel elements, each term in equation a may be divided by that pressure gradient to yield equation b. From the definition of resistance, equation c may be derived. This equation states that for resistances in parallel, the reciprocal of the total resistance, Rt, equals the sum of the reciprocals of the individual resistances, that is,
By considering a few simple illustrations, some of the fundamental properties of parallel hydraulic systems become apparent. For example, if the resistances of the three parallel elements in Figure 17-6 were all equal, then
Therefore, from Equation 17-8,
By equating the reciprocals of these terms,
Laminar and Turbulent Flow
Under certain conditions, fluid flow in a cylindrical tube will be laminar, as illustrated in Figure 17-3. As the fluid moves through the tube, a thin layer of fluid in contact with the tube wall adheres to the wall and hence is motionless. The layer of fluid just central to this external lamina must shear against this motionless layer, and therefore the layer moves slowly, but with a finite velocity. Similarly, the next more central layer moves still more rapidly; the longitudinal velocity profile is that of a paraboloid (Fig. 17-3). The fluid elements in any given lamina remain in that lamina as the fluid moves longitudinally along the tube. The velocity at the center of the stream is maximal and equal to twice the mean velocity of flow across the entire cross section of the tube.
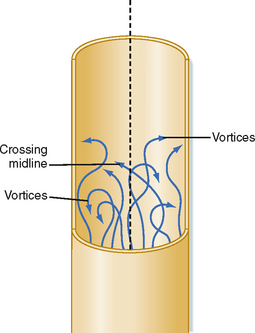
Irregular motions of the fluid elements may develop in the flow of fluid through a tube; such flow is called turbulent. In these conditions, fluid elements do not remain confined to definite laminae, but rapid, radial mixing occurs (Fig. 17-7). Greater pressure is required to force a given flow of fluid through the same tube when the flow is turbulent than when it is laminar. In turbulent flow, the pressure drop is approximately proportional to the square of the flow rate, whereas in laminar flow, the pressure drop is proportional to the first power of the flow rate. Hence, to produce a given flow, a pump such as the heart must do considerably more work if turbulence develops.
where ρ = fluid density, D = tube diameter, v = mean velocity, and η = viscosity. For NR of 2000 or greater, the flow will usually be laminar; for NR of 3000 or greater, the flow will be turbulent; and for NR between 2000 and 3000, the flow will be transitional between laminar and turbulent. Equation 17-12 indicates that high fluid densities, large tube diameters, high flow velocities, and low fluid viscosities predispose to turbulence. In addition to these factors, abrupt variations in tube dimensions or irregularities in the tube walls may produce turbulence.
Rheologic Properties of Blood
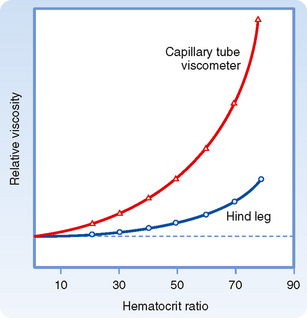
Rheologically, blood is a suspension of formed elements, principally erythrocytes, in a relatively homogeneous liquid, the blood plasma. Because blood is a suspension, the apparent viscosity of blood varies as a function of the hematocrit (ratio of the volume of red blood cells to the volume of whole blood). The viscosity of plasma is 1.2 to 1.3 times that of water. The upper curve in Figure 17-8 shows that blood with a normal hematocrit ratio of 45% has an apparent viscosity 2.4 times that of plasma.* In severe anemia, blood viscosity is low. With greater hematocrit ratios, the slope of the curve increases progressively; it is especially steep at the upper range of erythrocyte concentrations.
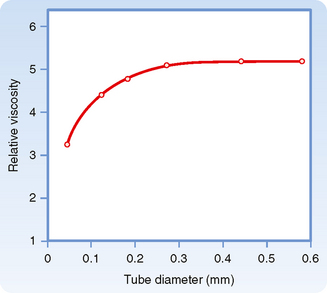
For any given hematocrit ratio, the apparent viscosity of blood, relative to that of water, depends on the dimensions of the tube used in estimating the viscosity. Figure 17-9 demonstrates that the apparent viscosity of blood diminishes progressively as tube diameter decreases below a value of about 0.3 mm. The diameters of the highest-resistance blood vessels, the arterioles, are considerably less than this critical value. This phenomenon therefore reduces the resistance to flow in blood vessels that possess the greatest resistance. The influence of tube diameter on apparent viscosity is explained in part by the actual change in blood composition as it flows through small tubes. The composition of blood changes because the red blood cells tend to accumulate in the faster axial stream, whereas plasma tends to flow in the slower marginal layers. Because the axial portions of the bloodstream contain a greater proportion of red cells and this axial portion will move at greater velocity, the red cells tend to traverse the tube in less time than plasma does. Measurement has shown that red cells do travel faster than plasma through these vascular beds. Furthermore, the hematocrit ratios of the blood contained in the small blood vessels of various tissues are lower than those in blood samples withdrawn from large arteries or veins.
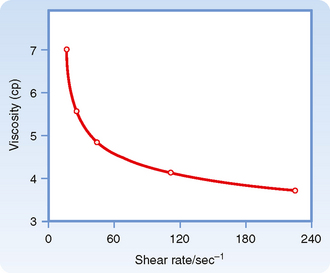
The apparent viscosity of blood diminishes as the flow rate is increased (Fig. 17-10), a phenomenon called shear thinning. The greater the flow, the greater the rate that one lamina of fluid shears against an adjacent lamina. The greater tendency for erythrocytes to accumulate in the axial laminae at higher flow rates is partly responsible for this non-newtonian behavior. However, a more important factor is that at very slow flow rates, the suspended cells tend to form aggregates, which increases blood viscosity. As flow is increased, this aggregation decreases, and so also does the apparent viscosity of blood (Fig. 17-10).
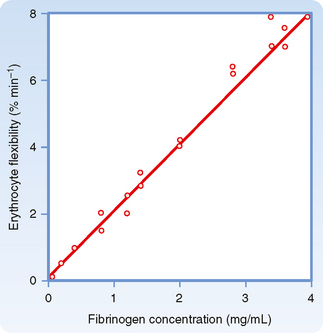
The deformability of erythrocytes is also a factor in shear thinning, especially when hematocrit ratios are high. The mean diameter of human red blood cells is about 7 μm, yet they are able to pass through openings with a diameter of only 3 μm. As blood with densely packed erythrocytes flows at progressively greater rates, the erythrocytes become more and more deformed. Such deformation diminishes the apparent viscosity of blood. The flexibility of human erythrocytes is enhanced as the concentration of fibrinogen in plasma increases (Fig. 17-11). If the red blood cells become hardened, as they are in certain spherocytic anemias, shear thinning may diminish.
THE ARTERIAL SYSTEM
Arterial Elasticity
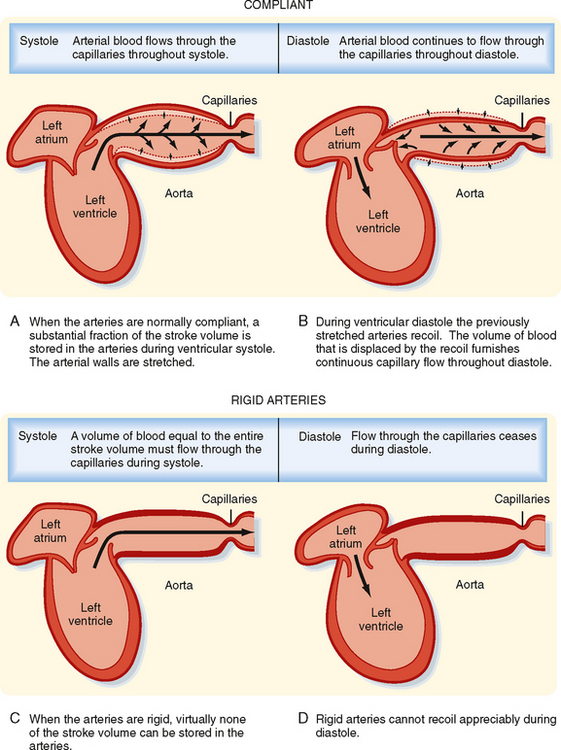
The systemic and pulmonary arterial systems distribute blood to the capillary beds throughout the body. The arterioles are high-resistance vessels of this system that regulate the distribution of flow to the various capillary beds. The aorta, the pulmonary artery, and their major branches have a large amount of elastin in their walls, which makes these vessels highly distensible (i.e., compliant). This distensibility serves to dampen the pulsatile nature of blood flow that results from the heart pumping blood intermittently. When blood is ejected from the ventricles during systole, these vessels distend, and during diastole, they recoil back and propel the blood forward (Fig. 17-12). Thus, the intermittent output of the heart is converted to a steady flow through the capillaries.
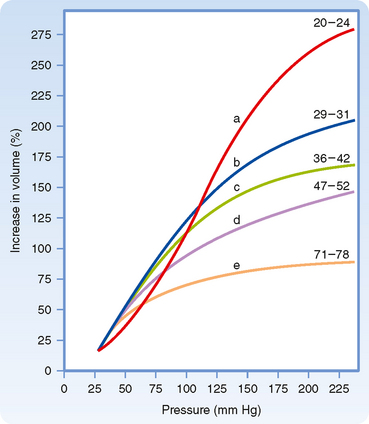
As people age, the elastin content of the large arteries is reduced and replaced by collagen. This reduces arterial compliance (Fig. 17-13). Thus, with age, systolic pressure increases, as does the difference between systolic and diastolic blood pressure, called the pulse pressure (see below).
Determinants of Arterial Blood Pressure
Arterial blood pressure is routinely measured in patients, and it provides a useful estimate of their cardiovascular status. Arterial pressure can be defined as mean arterial pressure, which is the pressure averaged over time, and as systolic (maximal) and diastolic (minimal) arterial pressure within the cardiac cycle (Fig. 17-14). The difference between systolic and diastolic pressure is termed pulse pressure.
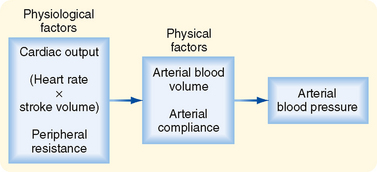
The determinants of arterial blood pressure are arbitrarily divided into “physical” and “physiological” factors (Fig. 17-15). The two physical factors or fluid mechanical characteristics are fluid volume (i.e., blood volume) within the arterial system and the static elastic characteristics (compliance) of the system. The physiological factors are cardiac output (which equals heart rate × stroke volume) and peripheral resistance.
Mean Arterial Pressure
Mean arterial pressure,  , may be estimated from an arterial blood pressure tracing by measuring the area under the pressure curve and dividing this area by the time interval involved (Fig. 17-14). Alternatively,
  can be satisfactorily approximated from the measured values of systolic (Ps) and diastolic (Pd) pressure by means of the following formula:
Consider that mean arterial pressure depends on only two physical factors: mean blood volume in the arterial system and arterial compliance (Fig. 17-16). Arterial volume, Va, in turn depends on the rate of inflow, Qh, into the arteries from the heart (cardiac output) and on the rate of outflow, Qr, from the arteries through the resistance vessels (peripheral runoff). These relationships are expressed mathematically as
where dVa/dt is the change in arterial blood volume per unit time. If Qh exceeds Qr, arterial volume increases, the arterial walls are stretched further, and pressure rises. The converse happens when Qr exceeds Qh. When Qh equals Qr, arterial pressure remains constant. Thus, increases in cardiac output raise mean arterial pressure, as do increases in peripheral resistance. Conversely, decreases in cardiac output or peripheral resistance decrease mean arterial pressure.
Arterial Pulse Pressure
Arterial pulse pressure is systolic pressure minus diastolic pressure. It is principally a function of just one physiological factor, stroke volume, which determines the change in arterial blood volume (a physical factor) during ventricular systole. This physical factor, plus a second physical factor (arterial compliance), determines the arterial pulse pressure (Fig. 17-16).
Stroke Volume.
As described previously, mean arterial pressure depends on cardiac output and peripheral resistance. During the rapid ejection phase of systole, the volume of blood introduced into the arterial system exceeds the volume that exits the system through the arterioles. Arterial pressure and volume therefore rise to a peak pressure, which is systolic pressure. During the remainder of the cardiac cycle (i.e., ventricular diastole), cardiac ejection is zero, and peripheral runoff now greatly exceeds cardiac ejection. The resultant decrement in arterial blood volume thus causes pressure to fall to a minimum, which is diastolic pressure. The effect of stroke volume on pulse pressure when arterial compliance is constant is illustrated in Figure 17-17.
Arterial Compliance.
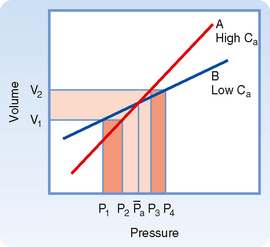
Arterial compliance also affects pulse pressure. This relationship is illustrated in Figure 17-18. When cardiac output and TPR are constant, a decrease in arterial compliance results in an increase in pulse pressure. Diminished arterial compliance also imposes a greater workload on the left ventricle (i.e., increased afterload), even if stroke volume, TPR, and mean arterial pressure are equal in the two individuals.
Total Peripheral Resistance and Arterial Diastolic Pressure.
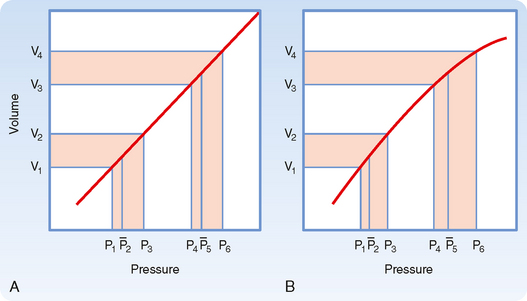
As previously discussed, if the heart rate and stroke volume remain constant, an increase in TPR will increase mean arterial pressure. When arterial compliance is constant, an increase in TPR leads to proportional increases in systolic and diastolic pressure such that the pulse pressure is unchanged (Fig. 17-19, A). However, arterial compliance is not linear. As mean arterial pressure increases and the artery is stressed, compliance decreases (Fig. 17-19, B). Because of the decrease in arterial compliance with increased arterial pressure, pulse pressure will increase when arterial pressure is elevated.
Peripheral Arterial Pressure Curves
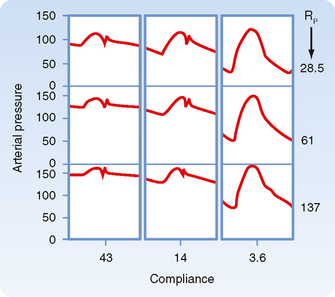
In chronic hypertension, a condition characterized by a persistent elevation in TPR, the arterial pressure-volume curve resembles that shown in Figure 17-19, B. Because arteries become substantially less compliant when arterial pressure rises, an increase in TPR will elevate systolic pressure more than it will elevate diastolic pressure. Diastolic pressure is elevated in such individuals, but ordinarily not more than 10 to 40 mm Hg above the average normal level of 80 mm Hg. Not uncommonly, however, systolic pressure is elevated by 50 to 100 mm Hg above the average normal level of 120 mm Hg. The combination of increased resistance and diminished arterial compliance is represented in Figure 17-20.
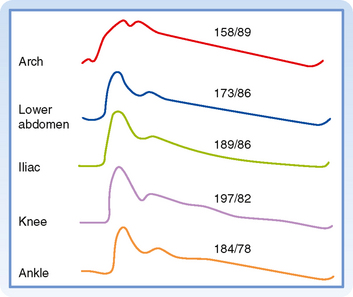
The arterial pressure contour becomes distorted as the wave is transmitted down the arterial system. This distortion in the pressure wave contour is demonstrated in Figure 17-21. These changes in contour are pronounced in young individuals, but they diminish with age. In elderly patients, the pulse wave may be transmitted virtually unchanged from the ascending aorta to the periphery.
Blood Pressure Measurement in Humans
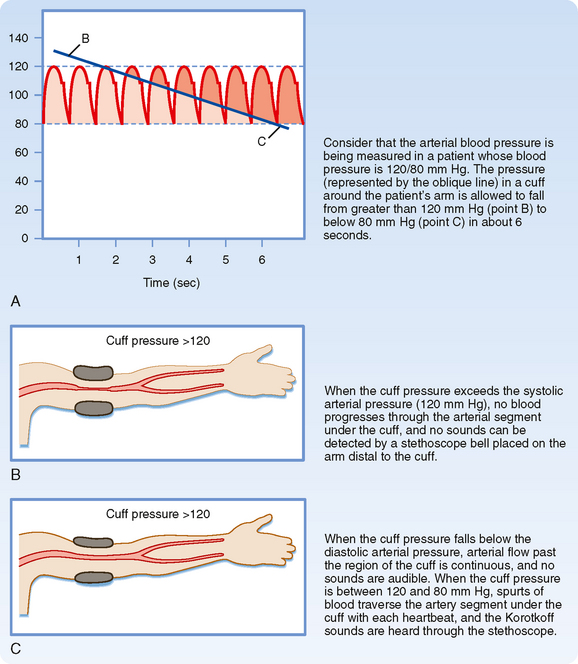
When blood pressure readings are taken from the arm, systolic pressure may be estimated by palpating the radial artery at the wrist (palpatory method). While pressure in the cuff exceeds the systolic level, no pulse is perceived. As pressure falls just below the systolic level (Fig. 17-22, A), a spurt of blood passes through the brachial artery under the cuff during the peak of systole, and a slight pulse will be felt at the wrist.
The auscultatory method is a more sensitive and therefore a more precise technique for measuring systolic pressure, and it also permits diastolic pressure to be estimated. The practitioner listens with a stethoscope applied to the skin of the antecubital space over the brachial artery. While the pressure in the cuff exceeds systolic pressure, the brachial artery is occluded and no sounds are heard (Fig. 17-22, B). When the inflation pressure falls just below the systolic level (120 mm Hg in Fig. 17-22, A), a small spurt of blood escapes the occluding pressure of the cuff, and slight tapping sounds (called Korotkoff sounds) are heard with each heartbeat. The pressure at which the first sound is detected represents systolic pressure. It usually corresponds closely with the directly measured systolic pressure. As the inflation pressure of the cuff continues to fall, more blood escapes under the cuff per beat and the sounds become louder. When the inflation pressure approaches the diastolic level, the Korotkoff sounds become muffled. When the inflation pressure falls just below the diastolic level (80 mm Hg in Fig. 17-22, A), the sounds disappear; the pressure reading at this point indicates diastolic pressure. The origin of the Korotkoff sounds is related to the discontinuous spurts of blood that pass under the cuff and meet a static column of blood beyond the cuff; the impact and turbulence generate audible vibrations. Once the inflation pressure is less than diastolic pressure, flow is continuous in the brachial artery, and sounds are no longer heard (Fig. 17-22, C).
THE VENOUS SYSTEM
Capacitance and Resistance
Veins are elements of the circulatory system that return blood to the heart from tissues. Moreover, veins constitute a very large reservoir that contains up to 70% of the blood in the circulation. The reservoir function of veins makes them able to adjust blood volume returning to the heart, or preload, so that the needs of the body can be matched when cardiac output is altered (see Chapter 19). This high capacitance is an important property of veins.
Variations in venous return are achieved by adjustments in venomotor tone, respiratory activity (see Chapter 19), and orthostatic stress or gravity.
Gravity
The hemodynamic effects of such venous distention (venous pooling) resemble those caused by the hemorrhage of an equivalent volume of blood from the body. When an adult person shifts from a supine position to a relaxed standing position, 300 to 800 mL of blood pools in the legs. This pooling may reduce cardiac output by about 2 L/min. The compensatory adjustments to assumption of a standing position are similar to the adjustments to blood loss (see also Chapter 19). There is a reflex increase in heart rate and cardiac contractility. In addition, both arterioles and veins constrict, with the arterioles being affected to a greater extent than the veins.
Muscular Activity and Venous Valves
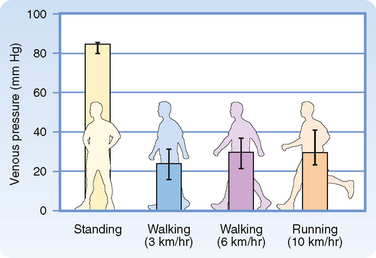
When a recumbent person stands but remains at rest, the pressure in the veins rises in the dependent regions of the body (Fig. 17-23). The venous pressure (Pv) in the legs increases gradually and does not reach an equilibrium value until almost 1 minute after standing. The slowness of this rise in Pv is attributable to the venous valves, which permit flow only toward the heart. When a person stands, the valves prevent blood in the veins from falling toward the feet. Hence, the column of venous blood is supported at numerous levels by these valves. Because of these valves, the venous column can be thought of as consisting of many discontinuous segments. However, blood continues to enter the column from many venules and small tributary veins, and the pressure continues to rise. As soon as the pressure in one segment exceeds that in the segment just above it, the intervening valve is forced open. Ultimately, all the valves are open and the column is continuous.
Precise measurement reveals that the final level of Pv in the feet during quiet standing is only slightly greater than that in a static column of blood extending from the right atrium to the feet. This finding indicates that the pressure drop caused by blood flow from the foot veins to the right atrium is very small. This very low resistance justifies considering all the veins as a common venous compliance in the circulatory system model illustrated in Chapter 19.
When an individual who has been standing quietly begins to walk, venous pressure in the legs decreases appreciably (Fig. 17-23). Because of the intermittent venous compression exerted by the contracting leg muscles and because of the operation of the venous valves, blood is forced from the veins toward the heart. Hence, muscular contraction lowers the mean venous pressure in the legs and serves as an auxiliary pump. Furthermore, muscular contraction prevents venous pooling and lowers capillary hydrostatic pressure. In this way, muscular contraction reduces the tendency for edema fluid to collect in the feet during standing.
MICROCIRCULATION AND LYMPHATICS
The lymphatic system is composed of lymphatic vessels, nodes, and lymphoid tissue. This system collects the fluid and proteins that have escaped from blood and transports them back into the veins for recirculation in blood. In this section we examine in detail the network of the smallest blood vessels of the body, as well as the lymphatic vessels.
Microcirculation
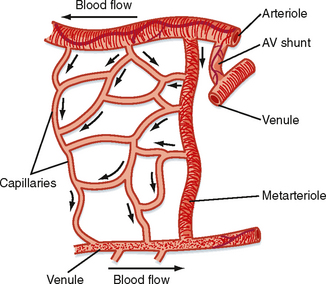
The microcirculation is defined as the circulation of blood through the smallest vessels of the body—arterioles, capillaries, and venules. Arterioles (5 to 100 μm in diameter) have a thick smooth muscle layer, a thin adventitial layer, and an endothelial lining (see Fig. 15-2). Arterioles give rise directly to capillaries (5 to 10 μm in diameter) or in some tissues to metarterioles (10 to 20 μm in diameter), which then give rise to capillaries (Fig. 17-24). Metarterioles can either bypass the capillary bed and connect to venules or directly connect to the capillary bed. Arterioles that give rise directly to capillaries regulate flow through these capillaries by constriction or dilation. The capillaries form an interconnecting network of tubes with an average length of 0.5 to 1 mm.
< div class='tao-gold-member'>
Stay updated, free articles. Join our Telegram channel

Full access? Get Clinical Tree










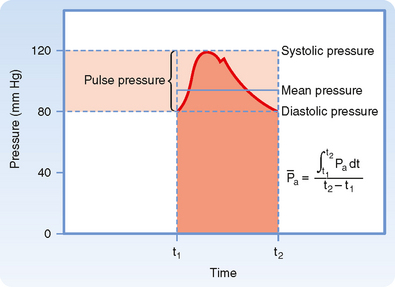
 ) represents the area under the arterial pressure curve (shaded area) divided by the duration of the cardiac cycle (t2 − t1).

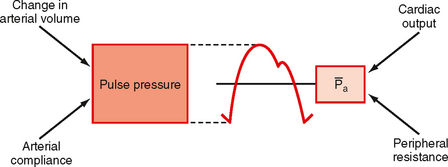
 ) are cardiac output and total peripheral resistance.
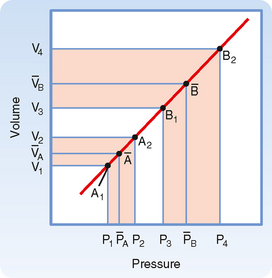
 and a greater pulse pressure [(P4 − P3) > (P2 − P1)].