Physiology of the Cardiovascular System
LANGUAGE OF SCIENCE
 Before reading the chapter, say each of these terms out loud. This will help you avoid stumbling over them as you read.
[aort- lifted, -ic relating to, re- back or again, -flex bend]
(ay-tree-oh-ven-TRIK-yoo-lar BUN-del)
[atrio- entrance courtyard, -ventr- belly, -icul- little, -ar relating to]
[baro- pressure, –recept- receive, -or agent]
[capill- hair, -ary relating to]
[cardi- heart, -ac relating to, cycle circle]
[cardi- heart, -ac relating to]
(kah-ROT-id SYE-nus REE-fleks)
[caro- heavy sleep, -id relating to, sinus hollow, re- back or again, -flex bend]
(kee-moh-ree-SEP-tor REE-fleks)
[chemo- chemical, –recept- receive, -or agent, re- back or again, -flex bend]
[dia- through, -stole contraction]
[dia- through, -stol- contraction, -ic relating to]
[hemo- blood, -dynami- force, -ic relating to]
[inter- between, –atri- entrance courtyard, –al relating to]
[inter- between, -nod- knot, -al relating to]
[ischem- hold back, -ic relating to]
(MED-uh-lair-ee is-KEE-mik REE-fleks)
[ortho- upright, -stat- standing, -ic relating to]
[named for letter of Roman alphabet]
[per- through, -fus- pour, -sion process]
[peri- around, -phera- boundary, -al relating to]
[Jean L.M. Poiseuille French physiologist]
[press- pressure, -re- back or again, -flex bend]
[named for letters of Roman alphabet]
renin-angiotensin-aldosterone system (RAAS)
(REE-nin-an-jee-oh-TEN-sin-al-DAH-stair-ohn)
[residu- remainder, -al relating to]
[sin- hollow (sinus), atri- entrance courtyard, -al relating to, nod- knot]
Starling’s law of the capillaries
[Ernest H. Starling English physiologist, capill- hair, -ary relating to]
[Ernest H. Starling English physiologist]
[sub- under, -endo- within, -cardi- heart, -al relating to]
[named for letter of Roman alphabet]
total peripheral resistance (TPR)
[peri- around, -phera- boundary, -al relating to, -al relating to, resist- withstand, -ance act of]
[named for letter of Roman alphabet]
[vas- vessel, -constrict- draw tight, -tion state]
[vaso- vessel, -dilat- widen, -tion state]
[vas- vessel, -motor move, mechan- machine, -ism state]
(vay-so-MOH-tor press-oh-REE-fleks)
[vas- vessel, -motor move, press- pressure, -re- back or again, -flex bend]
LANGUAGE OF MEDICINE
[ana- without, -phylact- protection, -ic relating to]
atrial fibrillation (A-fib or AF)
[atri- entrance courtyard, -al relating to, fibr- fiber, -illa- little, -ation process]
[brady- slow, –cardi- heart, -ia condition]
[cardi- heart, -gen- produce, -ic relating to]
[cardi- heart, –myo- muscle, -path- disease, –y state]
[circulat- go around, -ory relating to]
congestive heart failure (CHF)
[congest- crowd together, -ive relating to]
[cor heart, pulmon- lung, -ale relating to]
[dia- apart or through, –stol- contraction, -ic relating to]
[digit- finger, -alis relating to (from finger–shaped flowers of foxglove plant)]
[dig- finger (from digitalis or foxglove), -oxin poison or toxin]
[dys- disordered, -rhythm- rhythm, -ia condition]
[ec- out of, –top- place, -ic relating to]
electrocardiogram (ECG or EKG)
[electro- electricity, -cardio- heart, -gram drawing]
(eh-lek-troh-kar-dee-OG-rah-fee)
[electro- electricity, -cardio- heart, -graph- draw, -y process]
[hyper- excessive, –capn- vapor (CO2), -ia condition]
[hyper- excessive, -tens- stretch or pull tight, -sion state]
[hypo- under or below, –kal- potassium, -emia blood condition]
[hypo- under or below, -tens- stretch or pull tight, -sion state]
[hypo- under or below, –vol- whirl, -emi(a)- blood condition, –ic relating to]
[hypo- under or below, -ox- oxygen, -ia condition]
[Nicolai Korotkoff Russian physician]
[lamina- plate, -ar relating to]
[neuro- nerve, -gen- produce, -ic relating to]
[septi- putrid, -ic relating to]
[sinus hollow, dys- disordered, –rhythm- rhythm, -ia condition]
[sphygmo- pulse, -mano- thin, -meter measure]
[systole- contraction, -ic relating to]
[tachy- rapid, -cardi- heart, -ia condition]
turbulent flow (TER-byoo-lent)
[vas- vessel, -dilat- widen, -ory relating to]
ventricular fibrillation (V-fib or VF)
(ven-TRIK-yoo-lar fib-ril-LAY-shun)
[ventr- belly, -icul- little, -ar relating to, fibr- fiber, -illa- little, -ation process]
HEMODYNAMICS
Hemodynamics is a term used to describe a collection of mechanisms that influence the active and changing—or dynamic—circulation of blood (Figure 22-1). Circulation is, of course, a vital function. It constitutes the only means by which cells can receive materials needed for their survival and can have their wastes removed. Circulation is necessary, and circulation of different volumes of blood per minute at different times is also essential for healthy survival. For example, more active cells need more blood per minute than less active cells. The reason underlying this principle is obvious. The more work cells do, the more energy they use, and the more oxygen and nutrients they remove from the blood. Because blood circulates, it can continually bring in more oxygen and nutrients to replace what is consumed. The greater the activity of any part of the body, the greater the volume of blood circulating through it. This requires that circulation control mechanisms accomplish two functions: maintain circulation (keep blood flowing) and vary the volume and distribution of the blood circulated. Therefore as any structure increases its activity, an increased volume of blood must be distributed to it; that is, blood must be shifted from the less active tissues to the more active tissues.
To achieve these two ends, a great many factors must operate together as one smooth-running, although complex, machine. Incidentally, this is an important physiological principle that you have no doubt observed by now—that every body function depends on many other functions. A constellation of separate processes or mechanisms acts as a single integrated mechanism. Together, these separate mechanisms perform one large function. For example, many mechanisms together accomplish the large function we call circulation.
This chapter is about hemodynamics—the mechanisms that keep blood flowing properly. We begin with a discussion of the heart as a pump and then move on to the even bigger picture of blood flow through the entire cardiovascular system.
THE HEART AS A PUMP
In Chapter 21 we discussed the functional anatomy of the heart. Its four chambers and their valves make up two pumps: a left pump and a right pump. The left pump (left side of the heart) helps move blood through the systemic circulation, and the right pump (right side of the heart) helps move blood through the pulmonary circulation. We will now step back from our previous discussion of the valves and chambers of the heart to look at the bigger picture and see how these two linked pumps function together as a single unit. First, we will discuss the role of the electrical conduction system of the heart in coordinating heart contractions. Then we will discuss how these coordinated contractions produce the pumping cycle of the heart.
Conduction System of the Heart
For the heart to pump effectively, the impulses (action potentials) that trigger myocardial contraction must be coordinated carefully. This requires a system for generating rhythmic impulses and distributing them quickly to the different regions of the myocardium along impulse-conducting pathways. Without such a system, different regions of the myocardium would be contracting too slowly and at slightly different rates.
Four structures make up the core of the electrical conduction system of the heart:
These structures are represented in Figure 22-2 and described in the following paragraphs.
Each of the structures of the heart’s conduction system consists of cardiac muscle modified enough in structure to differ in function from ordinary cardiac muscle. The specialty of ordinary cardiac muscle is contraction. In this, it is like all muscle, and like all muscle, ordinary cardiac muscle can also conduct impulses. However, the myocardial fibers of the conduction system are more highly specialized, both structurally and functionally, than ordinary cardiac muscle tissue. They are not contractile. Instead, they permit only generation or rapid conduction of an action potential through the heart.
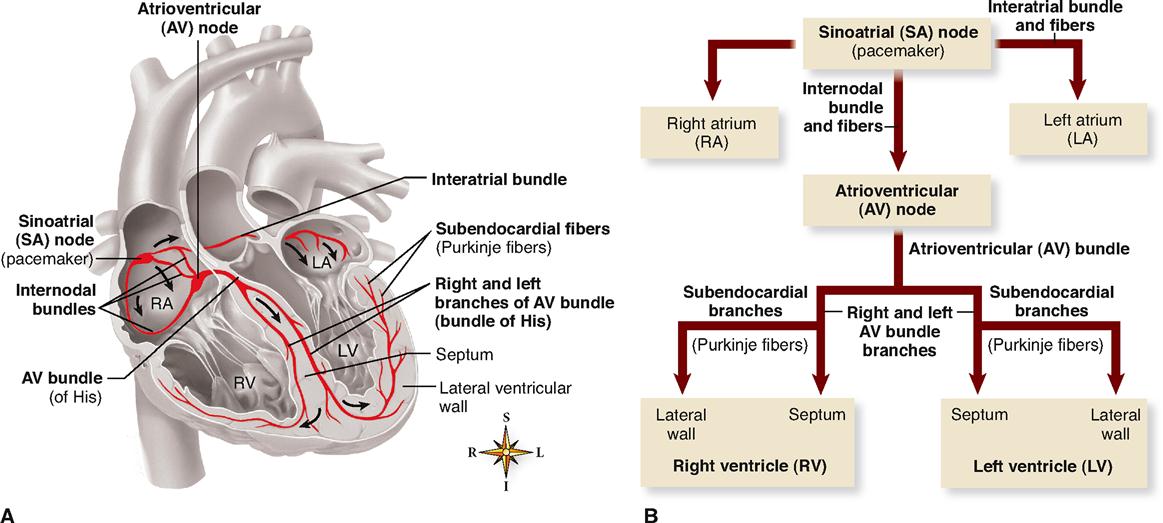
The normal cardiac impulse that initiates mechanical contraction of the heart arises in the SA node (or pacemaker), located just beneath the right atrial epicardium at its junction with the superior vena cava (Figure 22-2, A). Pacemaker cells in the node possess an intrinsic rhythm. This means that without any stimulation by nerve impulses from the brain and cord, they themselves initiate impulses at regular intervals. Even if pacemaker cells are removed from the body and placed in a nutrient solution, completely separated from all nervous and hormonal control, they will continue to beat! In an intact living heart, of course, nervous and hormonal regulation does occur and the SA node generates a pace accordingly.
Each impulse generated at the SA node travels swiftly throughout the muscle fibers of both atria. An interatrial bundle of conducting fibers facilitates rapid conduction to the left atrium. Thus stimulated, the atria begin to contract. As the action potential enters the AV node by way of three internodal bundles of conducting fibers, its conduction slows markedly, thus allowing for complete contraction of both atrial chambers before the impulse reaches the ventricles.
After passing slowly through the AV node, conduction velocity increases as the impulse is relayed through the AV bundle (bundle of His) into the ventricles. Here, right and left bundle branches and the subendocardial branches (Purkinje fibers) in which they terminate conduct the impulses throughout the muscle of both ventricles, stimulating them to contract almost simultaneously.
Thus the SA node initiates each heartbeat and sets its pace—it is the heart’s own natural pacemaker. Under the influence of autonomic and endocrine control, the SA node will normally “discharge,” or “fire,” at an intrinsic rhythmical rate of 70 to 75 beats/min under resting conditions. However, if for any reason the SA node loses its ability to generate an impulse, pacemaker activity will shift to another excitable component of the conduction system, such as the AV node or the subendocardial branches (Purkinje fibers). Pacemakers other than the SA node are abnormal and are usually ectopic pacemakers. Ectopic is a word that means “out of place.” Although ectopic pacemakers fire rhythmically, their rate of discharge is generally much slower than that of the SA node. For example, a pulse of 40 to 60 beats/min would result if the AV node were forced to assume pacemaker activity.
If the heart’s own pacemaker fails to maintain a healthy heart rhythm, an artificial pacemaker can be implanted to restore normal function. Check out Artificial Cardiac Pacemakers online at A&P Connect to see how this is done.

Electrocardiogram (ECG)
ELECTROCARDIOGRAPHY
Impulse conduction generates tiny electrical currents in the heart that spread through surrounding tissues to the surface of the body. This fact has great clinical importance. Why? Because from the skin, visible records of the heart’s electrical activity can be made with an instrument called an electrocardiograph. Skilled interpretation of these records may sometimes make the difference between life and death.
The electrocardiogram (ECG when written or EKG when spoken) is a graphic record of the heart’s electrical activity, its conduction of impulses. It is not a record of the heart’s contractions but of the electrical events that precede them. To produce an electrocardiogram, electrodes of a recording voltmeter (electrocardiograph) are attached to the limbs and/or chest of the subject (Figure 22-3, A). Changes in voltage, which represent changes in the heart’s electrical activity, are observed as deflections of a line drawn on paper or traced on a video monitor.
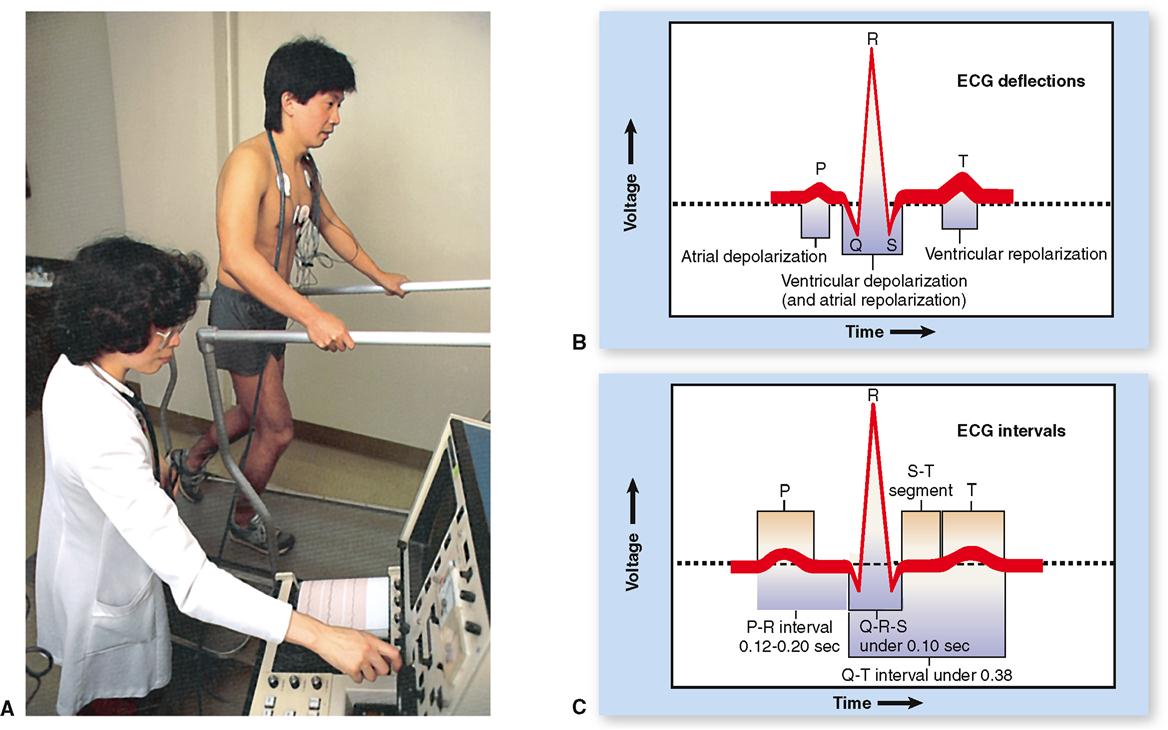
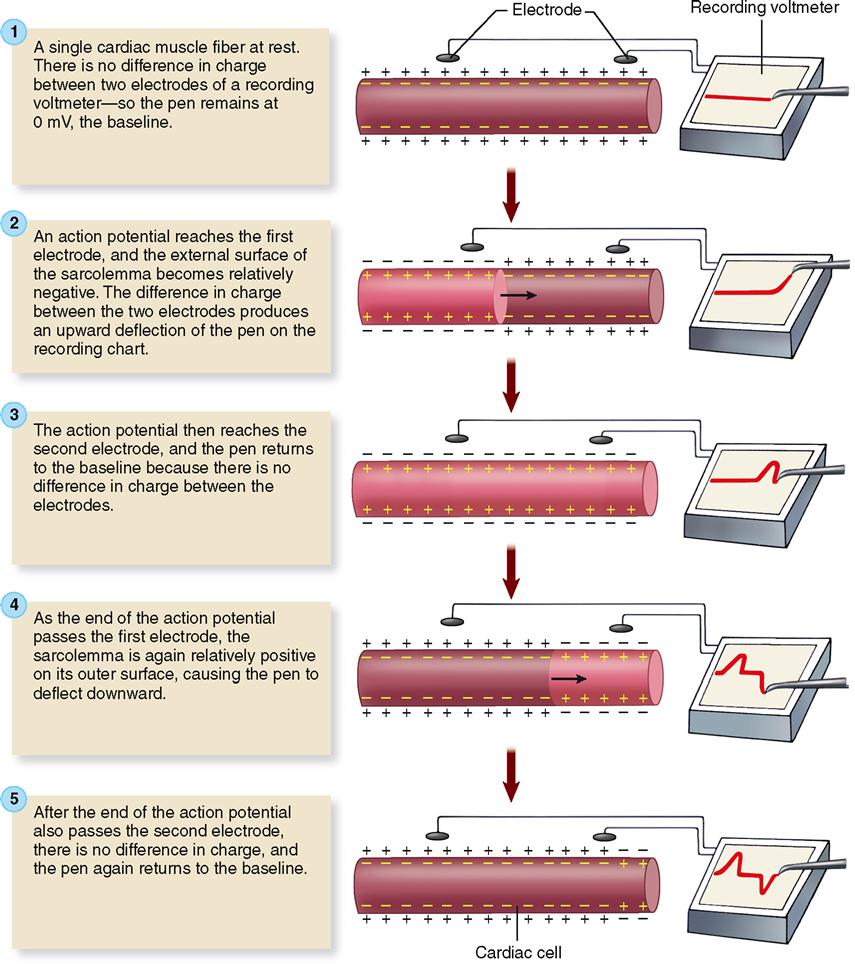
Figure 22-4 explains the basic theory behind electrocardiography. To keep things simple, a single cardiac muscle fiber is shown with the two electrodes of a recording voltmeter nearby. Before the action potential reaches either electrode, there is no difference in charge between the electrodes, and thus no change in voltage is recorded on the voltmeter graph (Figure 22-4, step 1). As an action potential reaches the first electrode, the external surface of the sarcolemma becomes relatively negative and so the voltmeter records a difference in charge between the two electrodes as an upward deflection of the pen on the recording chart (Figure 22-4, step 2). When the action potential also reaches the second electrode, the pen returns to the zero baseline because there is no difference in charge between the two electrodes (Figure 22-4, step 3). As the end of the action potential passes the first electrode, the sarcolemma is again relatively positive on its outer surface, causing the pen to again deflect away from the baseline. This time, because the direction of the negative and positive electrodes is reversed, the pen deflects downward rather than upward (Figure 22-4, step 4). After the end of the action potential also passes the second electrode, the pen again returns to the zero baseline (Figure 22-4, step 5). In short, depolarization of cardiac muscle causes a deflection of the graphed line; repolarization causes a deflection in the opposite direction.
Electrocardiography electrodes are normally quite some distance from myocardial tissue, but, given the massive size of the myocardial syncytium, it should not be surprising that even cutaneous electrodes can detect changes in the heart’s polarity.
There are a number of locations and patterns of attaching ECG leads. Different ECG setups produce different results—thus allowing physicians to “see” the electrical activity of the heart from different angles. See how this is done in Electrocardiography online at A&P Connect.

ECG WAVES
Because electrocardiography is far too complex a subject to explain fully here, normal ECG deflection waves and the ECG intervals between them shall be discussed only briefly. As shown in Figures 22-3, B, and 22-5, the normal ECG is composed of deflection waves called the P wave, QRS complex, and T wave. (The letters do not represent any words; they are simply an arbitrarily chosen sequence of letters of the alphabet.)
P Wave
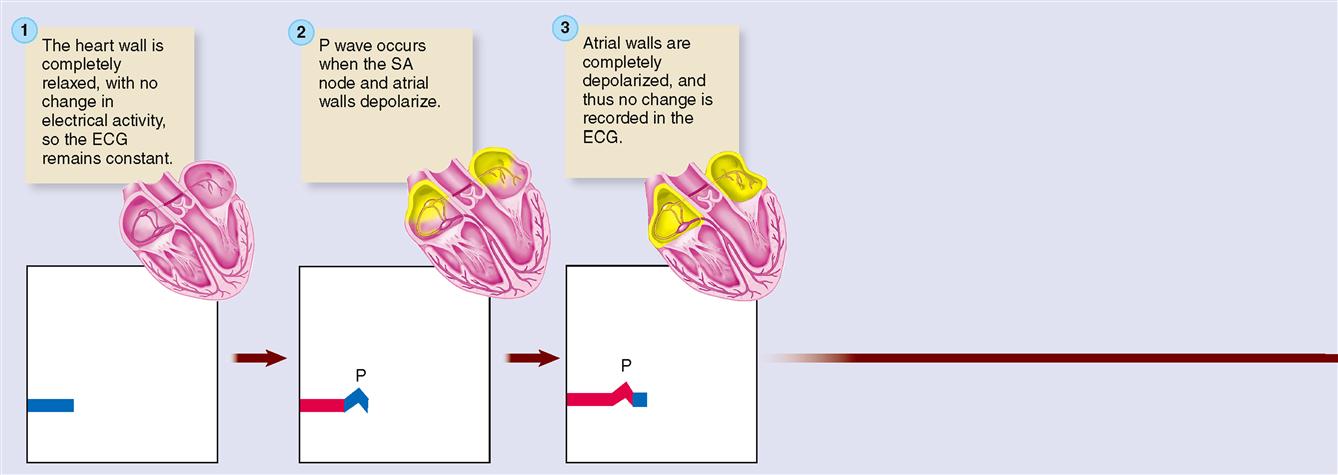
The P wave represents depolarization of the atria. That is, the P wave is the deflection caused by the passage of an electrical impulse from the SA node through the musculature of both atria. P wave abnormalities often reflect atrial enlargement.
QRS Complex
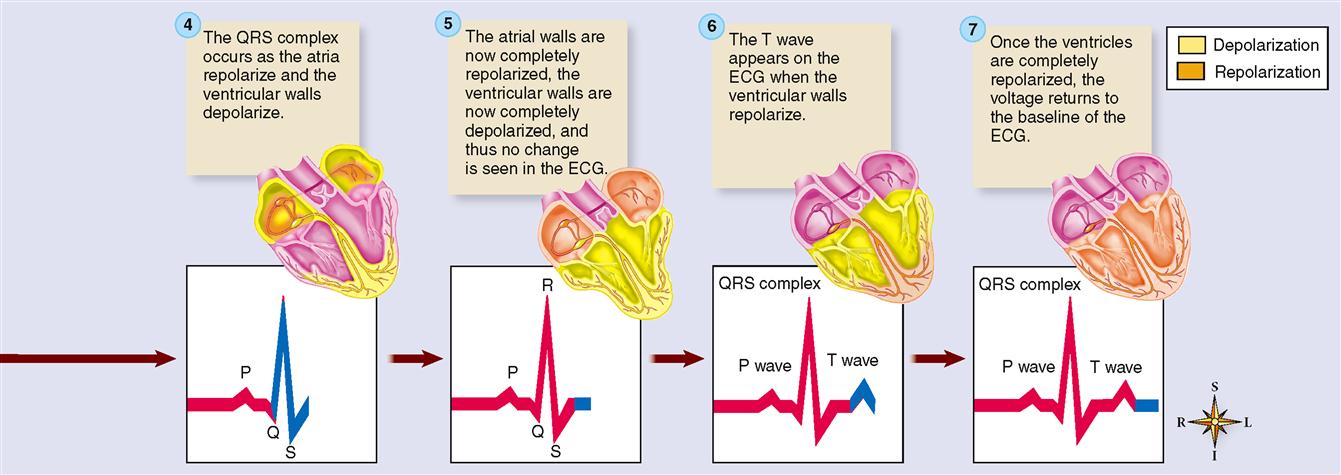
The QRS complex represents depolarization of the ventricles. Depolarization of the ventricles is a complex process, involving depolarization of the interventricular septum and the subsequent spread of depolarization by the subendocardial branches (Purkinje fibers) through the lateral ventricular walls. Rather than getting mired in a detailed explanation, let us simplify matters by stating that the combined duration of all three deflections of the QRS complex (Q, R, and S) represent the time required (0.07–0.11 seconds) for ventricular depolarization. (See Figure 22-2, C.)
At the same time that the ventricles are depolarizing, the atria are repolarizing. As we explained earlier, we should expect to see a deflection that is opposite in direction to the P wave that represented depolarization. However, the massive ventricular depolarization that is occurring at the same time overshadows the voltage fluctuation produced by atrial repolarization. Thus we can say that the QRS complex represents both ventricular depolarization and atrial repolarization. If the QRS duration is prolonged, ventricular conduction delay is probably occurring.
T Wave
The T wave reflects repolarization of the ventricles. In atria, the first part of the myocardium to depolarize is the first to repolarize. In ventricles, on the other hand, the first part of the myocardium to depolarize is the last to repolarize. Thus ECG deflections for both depolarization and repolarization are in the same direction. An inverted T wave is often seen following myocardial muscle damage.
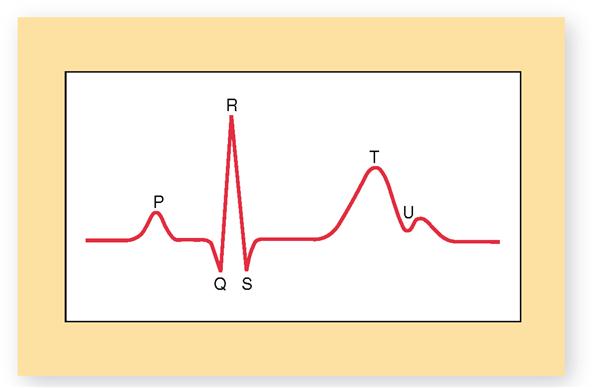
Sometimes, an additional U wave may be seen in the electrocardiogram (Figure 22-6). The U wave, when visible, appears as a tiny “hump” at the end of the T wave. The U wave is thought to represent late repolarization of subendocardial branches (Purkinje fibers) in the papillary muscle of the ventricular myocardium. However, some cardiologists believe it is simply a two-part T wave resulting from longer duration of the action potential in some ventricular myocardial cells. If not too big, U waves are usually considered to be normal. Sometimes, however, U waves can be a sign of hypokalemia (low blood potassium) or too much digoxin (a heart medication).
ECG INTERVALS
The principal ECG intervals between P, QRS, and T waves are shown in Figure 22-3, C. Measurement of these intervals can provide valuable information concerning the rate of conduction of an action potential through the heart, as we shall see later in this chapter. Figure 22-5 summarizes the relationship between the electrical events of the myocardium and the ECG recordings.
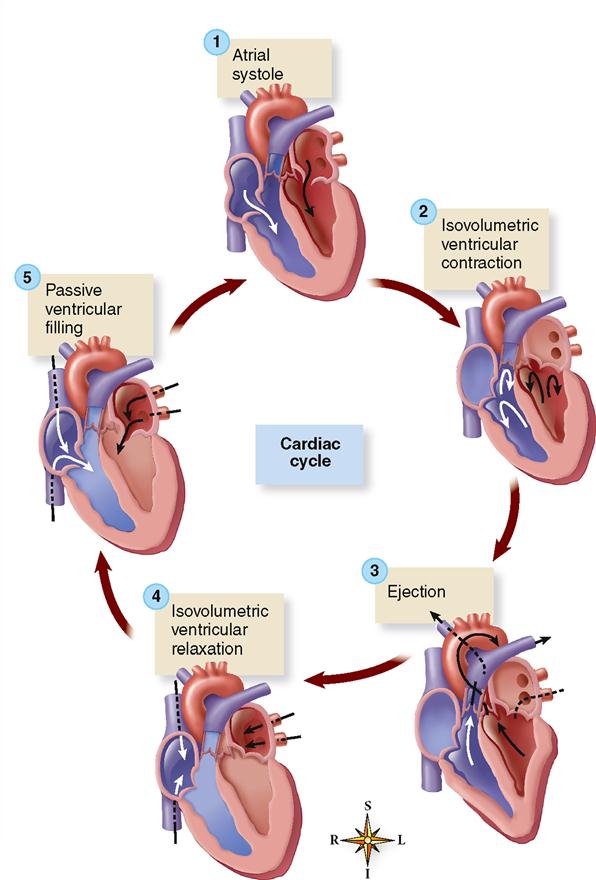
Cardiac Cycle
The term cardiac cycle means a complete heartbeat, or pumping cycle, consisting of contraction (systole) and relaxation (diastole) of both atria and both ventricles. The two atria contract simultaneously. Then, as the atria relax, the two ventricles contract and relax, instead of the entire heart contracting as a unit. This gives a kind of pumping action to the movements of the heart. The atria remain relaxed during part of the ventricular relaxation and then start the cycle over again. The cycle as a whole is often divided into time intervals for discussion and study. The following sections describe several of the important events of the cardiac cycle. As you read through these sections, refer frequently to Figure 22-7, which is a composite chart that graphically illustrates and integrates changes in pressure gradients in the left atrium, left ventricle, and aorta with ECG and heart sound recordings. Aortic blood flow and changes in ventricular volume are also shown. Refer also to Figure 22-8, which shows the major phases of the cardiac cycle.

Recall that damage to the myocardium that sometimes affects the heart’s ECG and pumping cycle may result from a heart attack. Review the illustrated walk-through of a Heart Attack! online at A&P Connect.

ATRIAL SYSTOLE
This phase of the cardiac cycle begins with the P wave of the ECG. Passage of the electrical wave of depolarization is then followed almost immediately by actual contraction (systole) of the atrial musculature.
The contracting force of the atria creates a pressure gradient that pushes blood out of the atria into the relaxed ventricles. Keep in mind that fluid moves from an area of high pressure toward an area of lower pressure—an important principle of hemodynamics that helps explain how the heart functions as a pump. Because of the high pressure of atrial blood during atrial systole, blood moves into the relaxed ventricles, where the pressure is lower.
The pressure gradient not only drives the movement of blood from the atria into the ventricles, it also keeps the atrioventricular (or cuspid) valves open during this phase. The ventricles are relaxed and rapidly filling with blood. The semilunar valves are closed because during this phase the arterial pressure is higher than pressure in the relaxed ventricles. This pressure gradient pushes blood against the semilunar valves and thereby prevents reentry of blood from the pulmonary artery or aorta.
ISOVOLUMETRIC VENTRICULAR CONTRACTION
The onset of ventricular systole coincides with the R wave of the ECG and the appearance of the first heart sound.
Iso- is a combining form denoting equality or uniformity, and volumetric denotes measurement of volume. Thus isovolumetric is a term that means “having the same measured volume.” During the brief period of isovolumetric ventricular contraction the intraventricular pressure begins to increase. This is enough of a pressure increase in the ventricles to overcome atrial pressure and close the atrioventricular valves—producing the first heart sound—but not enough to overcome arterial pressure and open the semilunar valves. This phase occurs between the start of ventricular systole and the opening of the semilunar valves, during which ventricular volume remains constant as the pressure increases rapidly.
EJECTION
The semilunar valves open and blood is ejected from the heart when the pressure in the ventricles exceeds the pressure in the pulmonary artery and aorta. An initial, shorter phase, called rapid ejection, is characterized by a marked increase in ventricular and aortic pressure and in aortic blood flow. The T wave of the ECG appears during the later, longer phase of reduced ejection (characterized by a less abrupt decrease in ventricular volume). A considerable quantity of blood, called the residual volume, normally remains in the ventricles at the end of the ejection period. In heart failure the residual volume remaining in the ventricles may greatly exceed that ejected during systole.
ISOVOLUMETRIC VENTRICULAR RELAXATION
Ventricular diastole, or relaxation, begins with the isovolumetric ventricular relaxation period of the cardiac cycle. It is the period between closure of the semilunar valves and opening of the atrioventricular valves. At the end of ventricular ejection, the semilunar valves close when the ventricular pressure drops below arterial pressure and pushes the valve flaps closed. As the valves snap shut, they produce the second heart sound. Closure of the semilunar valves prevents blood from reentering the ventricular chambers from the pulmonary trunk and aorta. Both sets of valves are closed, and the ventricles are relaxing.
Ventricular relaxation causes a dramatic fall in intraventricular pressure but not enough to open the atrioventricular valves. Because the valves are closed, there is no change in volume. The atrioventricular valves do not open until the pressure in the atrial chambers increases above that in the relaxing ventricles.
PASSIVE VENTRICULAR FILLING
As the ventricles continue to relax, the intraventricular pressure continues to drop. That, along with rising intraatrial pressure produced by return of venous blood, produces a pressure gradient sufficient to force open the atrioventricular valves. Blood then rushes into the relaxing ventricles.
The rapid influx of blood into the ventricles lasts about 0.1 second and results in a dramatic increase in ventricular volume. The term diastasis is often used to describe a later, longer period of slow ventricular filling as ventricular diastole ends. The abrupt inflow of blood that occurred immediately after opening of the atrioventricular valves is followed by a slow but continuous flow of venous blood into the atria and then through the open atrioventricular valves into the ventricles. Diastasis lasts about 0.2 second and is characterized by a gradual increase in ventricular pressure and volume.
At the end of this phase of the cardiac cycle, a new P wave triggers the contraction of atria that marks the beginning of another atrial systole phase—and new cardiac cycle.
Review Echocardiography online at A&P Connect to learn how sound waves are used to visualize the events of the cardiac cycle.

Heart Sounds
The heart makes certain typical sounds during each cardiac cycle that are described as sounding like “lubb-dupp” when heard through a stethoscope.
The first, or systolic, sound is caused primarily by the contraction (systole) of the ventricles and also by vibrations of the closing atrioventricular, or cuspid, valves. It is longer and lower than the second, or diastolic, sound, which is short and sharp and is caused by vibrations of the closing semilunar valves as the ventricles relax (diastole) (see Figure 22-7).
Heart sounds have clinical significance because they provide information about the valves of the heart. Any variation from normal in the sounds indicates imperfect functioning of the valves. Heart murmur is one type of abnormal heart sound heard frequently. It is sometimes described as a “swishing” sound that may signify incomplete closing of the valves (valvular insufficiency) or stenosis (constriction, or narrowing) of them.
PRIMARY PRINCIPLE OF CIRCULATION
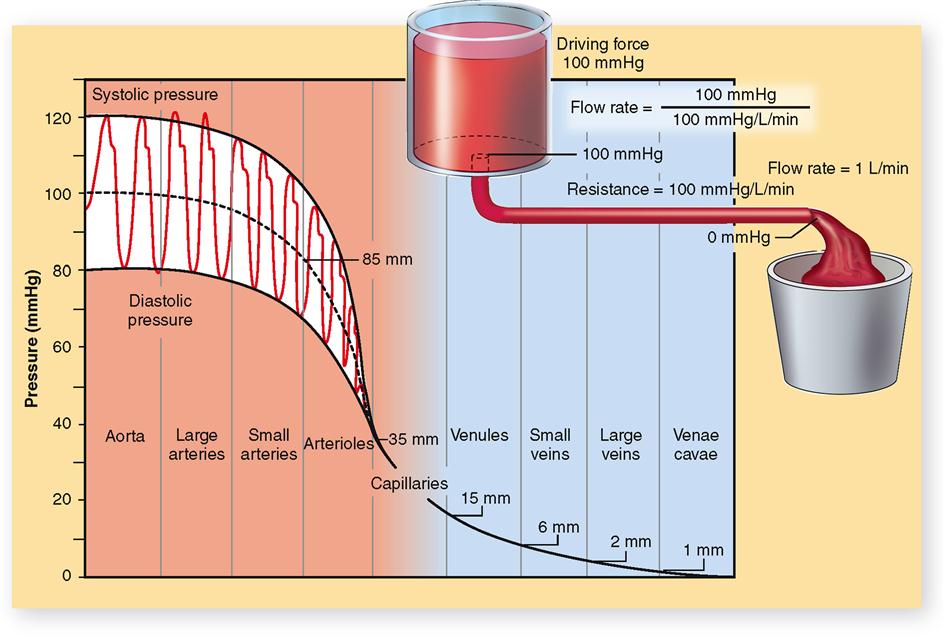
Blood circulates for the same reason that any fluid flows—whether it is water in a river, water in a garden hose, fluid in hospital tubing, or blood in vessels. A fluid flows because a pressure gradient exists between different parts of its volume (Figure 22-9).
This primary fluid flow principle derives from Newton’s first and second laws of motion. In essence, these laws state the following principles:
Thus the primary principle about circulation is this: blood flows because of a pressure gradient. We have already seen this principle operate to drive the flow of blood through the heart during the cardiac cycle (see pp. 687–689). It also applies to a whole circulatory loop—blood circulates from the left ventricle and returns to the right atrium of the heart because a blood pressure gradient exists between these two structures. Likewise, blood circulates from the right ventricle and returns to the left atrium because of a pressure gradient. By blood pressure gradient, we mean the difference between the blood pressure in one structure and the blood pressure in another.
An example of a normal blood pressure measurement in the aorta, as the left ventricle contracts and thereby pumps blood into it, is 120 mmHg; as the left ventricle relaxes, blood pressure decreases to 80 mmHg. The midpoint of aortic pressure in this instance is 100 mmHg. Figure 22-9 shows the systolic and diastolic pressures in the arterial system and illustrates the progressive fall in pressure from a midpoint of 100 mmHg in the aorta down to 0 mmHg by the time blood reaches the venae cavae and right atrium. The progressive fall in pressure as blood passes through the circulatory system is directly related to flow resistance. Resistance to blood flow in the aorta is almost zero. Although the pumping action of the heart causes fluctuations in aortic blood pressure (systolic 120 mmHg; diastolic 80 mmHg), the midpoint of pressure remains almost constant, dropping perhaps only 1 or 2 mmHg. The greatest drop in pressure (about 50 mmHg) occurs as blood goes through the arterioles because they present the greatest resistance to blood flow. The importance of flow resistance to maintaining a healthy pressure gradient is explored further in the next part of the chapter.
P1–P2 is often used to represent a pressure gradient, with P1 the symbol for the higher pressure and P2 the symbol for the lower pressure. For example, blood enters the arterioles at 85 mmHg and leaves at 35 mmHg. Which measurement is P1? P2? What is the blood pressure gradient? It would cause blood to flow through the arterioles toward the capillaries.
Of course, this principle applies to local blood flow as well as an entire circulatory loop. For example, pressure in the arteries and arterioles of the kidney must be higher than the blood pressure in the capillaries and veins of the kidney in order for blood to flow through the tissues of the kidney. This local pressure gradient needed to maintain blood flow in a tissue is called perfusion pressure (perfusion means “flow through”).
ARTERIAL BLOOD PRESSURE
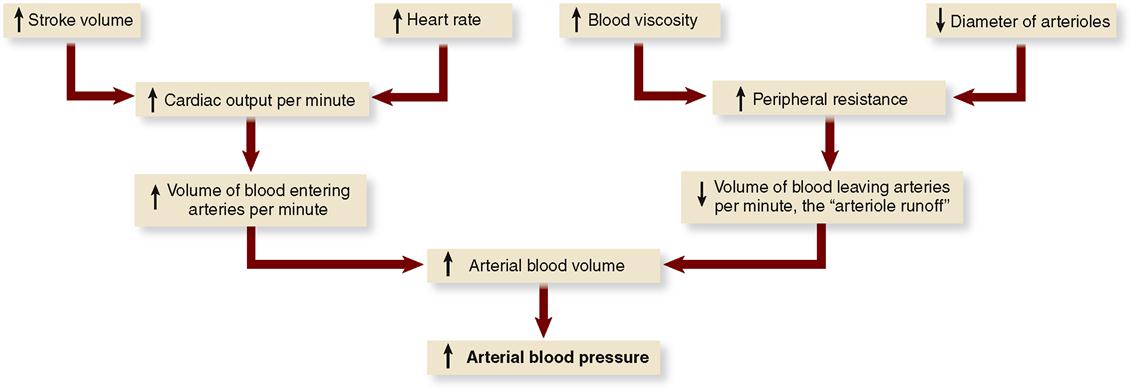
According to the primary principle of circulation, high pressure in the arteries must be maintained to keep blood flowing through the cardiovascular system. The chief determinant of arterial blood pressure is the volume of blood in the arteries. Arterial blood pressure is directly proportional to arterial blood volume. This means that an increase in arterial blood volume tends to increase arterial pressure, and conversely, a decrease in arterial volume tends to decrease arterial pressure.
Many factors determine arterial pressure through their influence on arterial volume. Two of the most important—cardiac output and peripheral resistance—are directly proportional to blood volume (Figure 22-10).
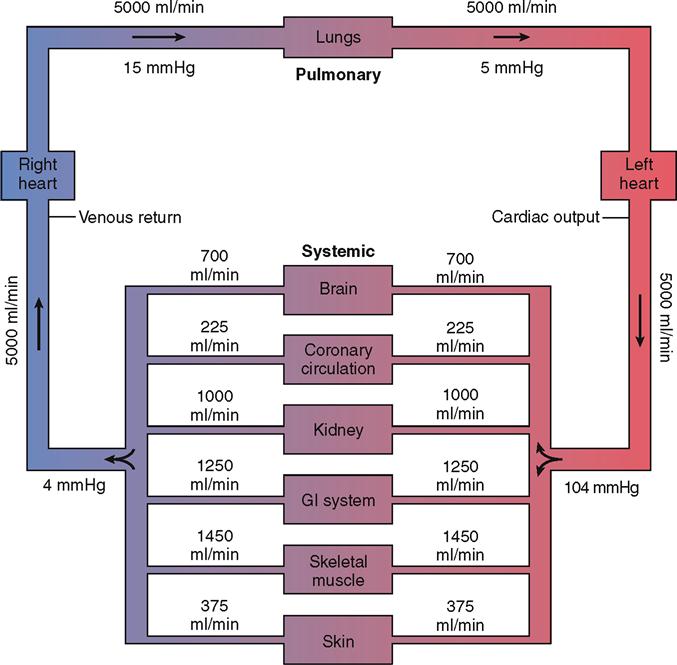
Cardiac Output
Cardiac output (CO) is the amount of blood that flows out of a ventricle of the heart per unit of time. The resting cardiac output from the left ventricle into the systemic arteries is roughly 5000 ml/min, for example. As Figure 22-11 shows, the cardiac output influences the flow rate to the various organs of the body. For the sake of discussion, we focus mainly on cardiac output from the left ventricle into the systemic loop—but the same principles apply to cardiac output from either the left or the right ventricle.