INTRODUCTION
LEARNING OBJECTIVES
After studying this chapter you should:
Understand how anemia impacts oxygen transport and the ways in which anemic patients compensate for decreased oxygen-carrying capacity.
Develop a coherent approach to the clinical and laboratory evaluation of patients with anemia.
Understand and use classification of anemia based on production versus destruction and on red cell size (mean cell volume).
Be able to explain the phenomenon of ineffective erythropoiesis—its diagnosis and role in pathogenesis.
Understand the process by which red cells are broken down, the catabolism of heme in macrophages, and the transport of bilirubin in the plasma and its conjugation in the liver.
DEFINITION OF ANEMIA
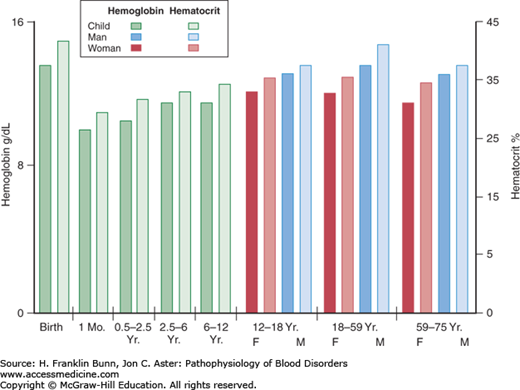
As stated in Chapter 1, the primary function of the red blood cell is to transport oxygen to respiring cells and tissues. Anemia is defined as a significant deficit in the mass of circulating red blood cells. As a result, the capacity of the blood to deliver oxygen is compromised. Clinicians document the presence of anemia by measurement of either the concentration of hemoglobin in the blood or the hematocrit, which is the ratio of the volume of red cells to the total volume of a blood sample. A patient is anemic if the hemoglobin or hematocrit value is more than two standard deviations below normal. As shown in Figure 3-1, the lower limits of normal vary with the age of the individual and, in adults, with gender. Occasionally, the documentation of anemia is confounded by a concurrent alteration in the plasma volume. For example, if a patient with a low mass of circulating red blood cells is also hypovolemic, owing to a concurrent loss of plasma volume from dehydration, the blood hemoglobin and hematocrit levels will be falsely elevated and may even be in the normal range. Another important example, discussed in more detail later in this chapter, is acute hemorrhage, in which there is concomitant loss of both red blood cells and plasma.
OXYGEN TRANSPORT IN ANEMIA
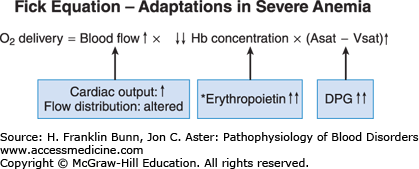
Oxygen transport to a given region in the body, as expressed in the Fick equation, is a product of three independent variables: blood flow, hemoglobin concentration, and the fraction of hemoglobin that has unloaded oxygen during transit from artery to vein. In anemic patients, the oxygen-carrying capacity of the blood is, by definition, low. As shown in Figure 3-2 and explained below, the two other components in the Fick equation undergo compensatory changes.
In all anemic individuals, there is enhanced shunting of blood to vital organs, including the heart, brain, liver, and kidneys, at the expense of non-vital organs. Anemic patients are pale because blood is shunted away from the skin to preserve oxygenation of these crucial organs. In patients with mild or moderate anemia, the cardiac output is normal at rest but, with exercise, increases more than that of a normal individual. In severe anemia, the resting cardiac output is increased, putting patients at risk of developing high-output cardiac failure, particularly those with coronary artery disease or other forms of preexistent cardiovascular disease.
The variable (Asat-Vsat) in the Fick equation is the difference in percent oxygenation between the arterial (A) and venous (V) blood. This AV difference in oxygen saturation depends on the oxygen-binding curve. Figure 3-3 compares curves from an anemic patient and a normal individual. As the top panel shows, the anemic curve is shifted to the right. At any given oxygen tension (pO2), the oxygen saturation is lower in the anemic individual. Thus, red cells of anemic patients have decreased oxygen affinity. This change is due entirely to elevated levels of 2,3-diphosphoglycerate (2,3-DPG) in red cells. 2,3-DPG and pH are the primary determinants of oxygen affinity in human red cells. Arterial blood normally has a pO2 of about 95 Torr and is nearly 100% saturated with oxygen. As red cells from a normal individual pass from an artery through its capillary bed to its vein, oxygen is released to respiring cells. At a normal venous pO2 of about 40 Torr, the oxygen saturation is about 80%. Thus, as shown on the left in Figure 3-3, 20% of the oxygen in the blood is unloaded. In contrast, in patients with anemia and elevated levels of red cell 2,3-DPG, the lower oxygen affinity of the blood enables a much higher fraction of the oxygen (about 35%) to be unloaded. This is a critically important way in which anemic patients compensate for their major deficit in red cell mass.
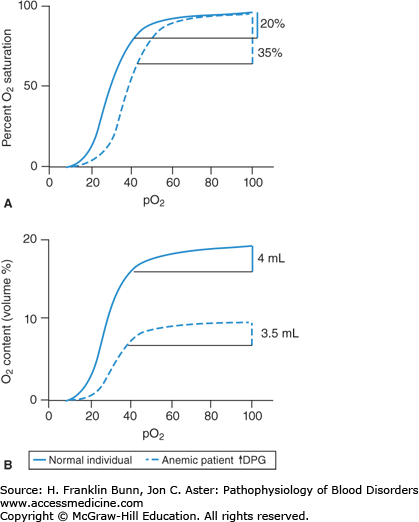
This benefit is shown quantitatively in the bottom panel of Figure 3-3. Here, the oxygen-binding curves are depicted with the volume fraction of oxygen plotted on the Y-axis. One gram of hemoglobin binds up to 1.34 mL of oxygen under standard conditions of temperature and pressure. Thus, in a normal individual with a hemoglobin of 15 g/dL, the oxygen-carrying capacity of the blood will be 15 × 1.34 or 20 mL O2/dL. In traversing the earlier-mentioned capillary bed, 20% of this oxygen will be unloaded, that is, 4 mL per 100 mL of blood. In contrast, an anemic patient with a hemoglobin of 7.5 g/dL has an oxygen-binding capacity that is half normal, that is, 10 mL O2/dL. If this patient had red cells with normal oxygen affinity, 20% or only 2 mL of oxygen would be unloaded per 100 mL of blood. However, as shown on the right in Figure 3-3, because the patient’s red cells have a lower affinity for oxygen, 3.5 mL is unloaded, nearly as much as normal.
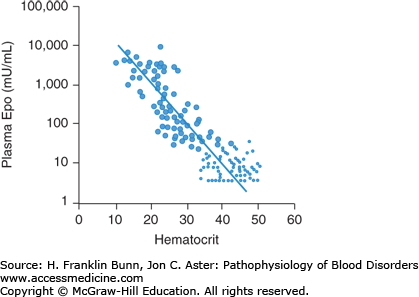
There are two ways in which anemia impacts the middle component of the Fick equation, depicted in Figure 3-2. As mentioned earlier, by definition, hemoglobin concentration is low in anemic patients. The reduction in the oxygen-carrying capacity of the blood results in cellular hypoxia. A molecular sensor in all cells of the body detects even mild degrees of hypoxia and induces a hypoxia-inducible transcription factor called HIF. In the kidney, and to a lesser extent in the liver, HIF up-regulates the expression of the hormone erythropoietin, which stimulates red blood cell production. The physiology and cell biology of erythropoietin is discussed in more detail in Chapter 2. The regulated production of erythropoietin enables normal individuals to maintain nearly constant levels of circulating red cells. In anemic patients, the hypoxic signal in the kidneys and liver results in a marked enhancement in erythropoietin production. As shown in Figure 3-4, plasma erythropoietin levels are inversely proportional to the hematocrit and, in severely anemic patients, can be 1000-fold higher than normal. The erythroid progenitors in patients with anemia due to impaired red cell production are unresponsive to such high levels of plasma erythropoietin. In contrast, in patients whose anemia is due to blood loss or a short red cell life span, this regulatory loop maximizes red cell production and constitutes a third important mode of compensation.
SIGNS AND SYMPTOMS OF ANEMIA
Patients with mild or moderate anemia are often asymptomatic. Many note breathlessness and/or fatigue only upon strenuous exercise. In severe anemia, dyspnea and fatigue are common complaints. These symptoms reflect limitations in the earlier-mentioned compensations for the tissue hypoxia imposed by a low red blood cell mass.
Stay updated, free articles. Join our Telegram channel

Full access? Get Clinical Tree


