Obesity: Epidemiology, Etiology, and Prevention1
Sarit Polsky
Victoria A. Catenacci
Holly R. Wyatt
James O. Hill
1Abbreviations: AD-36, adenovirus-36; BMI, body mass index; BMR, basal metabolic rate; HFCS, high-fructose corn syrup; MCR4, melanocortin-4 receptor; NHANES, National Health and Nutrition Examination Survey; PAEE, physical activity-related energy expenditure; PWS, Prader-Willi syndrome; REE, resting energy expenditure; TEE, total energy expenditure; TEF, thermic effect of food; WHO, World Health Organization.
Whether obesity develops within an individual depends on complex interactions among genetic, environmental, and behavioral factors, all acting on energy balance (i.e., energy intake, energy expenditure, energy storage). Obesity has existed in the population throughout recorded history, but only in more recent generations has it increased to an extent that US public health experts are calling it an epidemic (1). This rapid increase in the prevalence of obesity within society has captured the interest not just of health care professionals but also of the media, employers, schools, private industry, and policy makers. Obesity is a chief contributor to preventable death in the United States and poses a major public health challenge. Because of the association between obesity and many other chronic diseases, obesity has become the public health issue of our time. This chapter deals with the reasons that obesity develops within individual persons and societies.
EPIDEMIOLOGY OF OBESITY
Consequences of an Ancient Metabolism in a Modern World
Genes involved in the regulation of body weight are estimated to have evolved 200,000 to 1 million years ago, at a time when environmental factors controlling habitual physical activity and food acquisition were dramatically different (2). The rapid increase in the global prevalence of obesity occurred in a time too short for a change in the gene pool, a finding suggesting that factors in the environment are promoting weight gain. Humans evolved in an environment of paucity in which high levels of physical activity were necessary for survival and food acquisition. Starvation, not obesity, was a serious threat. Physiologic mechanisms were useful to oppose weight loss but not weight gain. The abilities to conserve and store energy were critical for survival; inefficient energy storage and excessive nonessential physical activity were maladaptive. Over time, the modern environment changed to one with endless varieties of inexpensive, plentiful, palatable, energy-dense foods and ever-increasing technologic advances designed to decrease physical activity. As a result, our current environment has an extraordinarily strong and sustained propensity to promote positive energy balance and obesity. Our physiology has not developed to oppose these environmental pressures, so the relatively recent increase in the prevalence of obesity in the population can be attributed to a mismatch between our physiology and our environment.
Worldwide Rates of Obesity
The World Health Organization (WHO) estimated that numbers of obese adults worldwide have more than doubled from 1980 to 2011, bringing total numbers of obese adults to approximately 500 million (3). An estimated 43 million children younger than 5 years old were overweight worldwide in 2010, 8 million of whom were in developed countries (3). The relationship between economic development and obesity is apparent. Less-developed
countries show increases in obesity as they become more affluent (4). The WHO categorizes countries according to economic development, and the frequency of obesity in the population is related to the degree of economic development. As economies grow from “least developed” to “developing” to “economy in transition” to “developed market economy,” the obesity prevalence increases from 1.8% to 4.8% to 17.1% to 20.4%, respectively (5). Overall, in countries with the poorest economies, obesity is rare, except in the highest socioeconomic groups. At present, overweight and obesity combined are associated with more worldwide deaths than underweight (3).
countries show increases in obesity as they become more affluent (4). The WHO categorizes countries according to economic development, and the frequency of obesity in the population is related to the degree of economic development. As economies grow from “least developed” to “developing” to “economy in transition” to “developed market economy,” the obesity prevalence increases from 1.8% to 4.8% to 17.1% to 20.4%, respectively (5). Overall, in countries with the poorest economies, obesity is rare, except in the highest socioeconomic groups. At present, overweight and obesity combined are associated with more worldwide deaths than underweight (3).
Changes in United States Obesity Rates over Time
Since the mid-1980s, the prevalence of obesity has increased steadily and markedly in both Westernized and non-Westernized countries. More recent US data suggest that obesity prevalence may be leveling off, but it remains high (6). For the first time in history, most (69.2%) US adults are overweight or obese (6, 7), and as such they have substantially increased morbidity and mortality from hypertension, stroke, coronary artery disease, dyslipidemia, type 2 diabetes mellitus, sleep apnea, and numerous other conditions. Higher body mass index (BMI) also increases all-cause mortality.
The most accurate US data about changes over time in overweight and obesity rates come from the National Health and Nutrition Examination Survey (NHANES). The NHANES program of the National Center for Health Statistics, Centers for Disease Control and Prevention, includes a series of cross-sectional nationally representative health examination surveys beginning in 1960. The height and weight of a large representative sample of the population are taken in these surveys. Each cross-sectional survey provides a national estimate for the US population at the time of the survey, thus enabling an examination of trends over time in population. Previous national surveys include the National Health Examination Survey (NHES I, 1960 to 1962) and the first, second, and third NHANES surveys (NHANES I, 1971 to 1974; NHANES II, 1976 to 1980; and NHANES III, 1988 to 1994). Beginning in 1999, NHANES became a continuous survey without a break between cycles, and the data for the first 12 years of the continuous NHANES (1999 to 2010) were published in 2012 (6).
Review of the NHANES data reveals that the prevalence of obesity was relatively constant from 1960 to 1980 and then increased, as reported in NHANES III (1988 to 1994). The data from NHANES 1999 to 2000 show further increases for both men and women in all age groups and all racial and ethnic groups studied (8). However, over the 12-year period of NHANES 1999 to 2010, a significant increase in obesity was noted only among men, African-American women, and Mexican-American women (6). According to NHANES 2007 to 2008, an estimated 68% of adults in the United States are overweight (BMI 25 to 29.9) or obese (BMI >30). This finding represents a prevalence that is 12% higher than the overweight and obesity estimates obtained from NHANES III (1988 to 1994) and 21% higher than in NHANES I (1971 to 1974) (9). Among adults 20 to 74 years old, the estimated prevalence of obesity (BMI >30) doubled between NHANES II and NHANES 1999 to 2000 from approximately 15% to 31%, with further though less dramatic increases since then (10). These data are presented graphically in Figure 58.1.
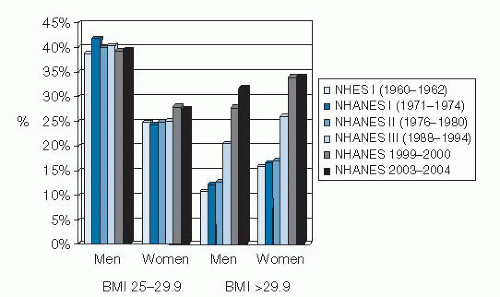 Fig. 58.1. Age-adjusted prevalence of overweight and obesity for US adults ages 20 to 74 years, 1960 to 2000. BMI, body mass index; NHES, National Health Examination Survey; NHANES, National Health and Nutrition Examination Survey. (Data with permission from Ogden CL, Yanovski SZ, Carroll MD, and Flegal KM. Prevalence and trends of overweight and obesity among adults ages 20-74 years in the United States, 1960-2004. Gastroenterology 2007;132:2087-2102.) |
In addition, data from the Behavioral Risk Factor Surveillance System, as analyzed by Sturm (11), indicate that the prevalence of clinically severe obesity is increasing much faster than that of mild obesity. Between 1986 and 2000, the prevalence of a self-reported BMI of 40 or greater (<100 lb [45 kg] overweight) quadrupled from approximately 1 in 200 adults in the United States to 1 in 50; the prevalence of a BMI of 50 or greater increased by a factor of 5, from approximately 1 in 2000 to 1 in 400. In contrast, obesity (BMI >30) roughly doubled during the same period, from approximately 1 in 10 to 1 in 5. Thus, the published increases in overweight and obesity may underestimate the consequences for the health care system because obesity-related comorbidities are much higher among severely obese persons.
Demographic Effects of Obesity in the United States
Gender
Obesity affects both men and women, although with some notable sex differences. More men than women are overweight, but more women than men are obese (12). Overweight and obesity prevalence differences between men and women vary greatly across racial and ethnic groups. In data from NHANES 2009 to 2010 (6), obesity rates are similar in white men (36.4%) and women (33.4%). Obesity rates are much higher in African-American women
(58.6%) than in African-American men (38.8%), and similarly, obesity rates are higher in Hispanic women (40.7%) than in Hispanic men (35.3%). Body fat distribution also differs between the sexes, with men more predisposed to visceral (abdominal) obesity.
(58.6%) than in African-American men (38.8%), and similarly, obesity rates are higher in Hispanic women (40.7%) than in Hispanic men (35.3%). Body fat distribution also differs between the sexes, with men more predisposed to visceral (abdominal) obesity.
Race
In NHANES 2009 to 2010, the prevalence of overweight and obesity for adults was 67% for non-Hispanic whites, 77% for non-Hispanic blacks, and 79% for Hispanics (6). The prevalence of overweight and obesity in men varied by race and ethnic group, such that non-Hispanic whites had the lowest prevalence (74%) and Hispanics had the highest (82%) (6). Among women, a different race and ethnic pattern was seen, with the higher prevalence of overweight and obesity existing among non-Hispanic black women (82%) and the lowest among non-Hispanic whites (60%) (6). These data are presented in Figure 58.2. Among younger males (aged 2 to 19 years), Hispanics had higher obesity prevalence than non-Hispanic whites or non-Hispanic blacks (13). Among younger females (aged 2 to 19 years), non-Hispanic blacks had the highest prevalence of obesity compared with the other NHANES race and ethnic groups (13). Some groups of Native Americans (e.g., the Pima Indians of Arizona) had even higher rates of obesity. Evidence indicates that these racial differences persist even after controlling for socioeconomic status (12).
Socioeconomic Status
Among men in the United States, an inconsistent relationship exists between socioeconomic status and obesity whereas an inverse relationship is noted among women (14). There is also a clear trend for the prevalence of obesity to decrease with increasing levels of education. In 1999, an 11% difference in the prevalence of obesity was reported between those who had less than a high school education (25.3%) and those who had a college education or more (14.3%) (5). Although the prevalence of obesity differs by socioeconomic status, the increases over time seem to be similar in all socioeconomic groups.
Age
The prevalence of obesity rises steadily from age 20 to age 60 years, at which time it peaks. After age 60 years, obesity rates begin to decline (12). Investigators have suggested that the increased mortality associated with obesity is selectively weaning the obese from the elderly population, thereby decreasing prevalence of obesity (5).
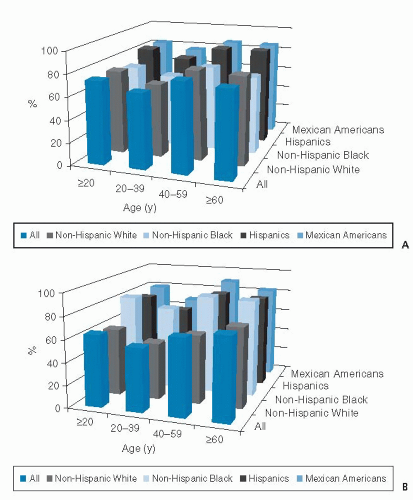 Fig. 58.2. Prevalence of overweight and obesity for adults aged 20 years or older by age, sex, and racial or ethnic group: United States 2009-2010. A. Men. B. Women. (Data with permission from Flegal KM, Carroll MD, Kit BK et al. Prevalence of obesity and trends in the distribution of body mass index among US adults, 1999-2010. JAMA 2012;307:491-7.) |
Childhood Obesity
Obesity among school-age children and adolescents, defined as BMI for age greater than or equal to the 95th percentile, has tripled since 1980 (15). Data from NHANES 2009 to 2010 showed that approximately 10% of children less than 2 years old and 17% of children 2 to 19 years old were obese in the United States (13). Childhood obesity portends obesity in adulthood as well as an increased risk of obesity-related diseases (16). Investigators have estimated that 30% of adults become obese during childhood, and approximately 80% of obese adolescents become obese adults (17). Obesity-related disorders including type 2 diabetes mellitus, hypertension, gallbladder disease, hyperlipidemia, orthopedic complications, sleep apnea, and nonalcoholic steatohepatitis are now seen with increasing frequency in the pediatric population (18). Prevention and treatment of childhood obesity are discussed in detail in another chapter.
OBESITY AS A DISORDER OF ENERGY BALANCE
Obesity can develop only as a result of an imbalance between energy intake and energy expenditure (i.e., positive energy balance). Understanding the etiology of obesity requires understanding the complex ways in which positive energy balance can occur. Both energy intake and energy expenditure are influenced by genetic factors and many factors within the environment in which we live. Further, changes in energy expenditure can influence energy intake and vice versa. Because of this complexity, the development of obesity cannot be attributed simply to excessive energy intake or low energy expenditure. High energy intake leads to obesity only if it is not matched by high energy expenditure, and low energy expenditure leads to obesity only if it is not matched by low energy intake.
Energy balance can be illustrated in the following equation, often called the energy balance equation. The equation states that any change in body weight (ΔBody weight) must be caused by a difference between energy intake (Ein) and energy expenditure (Eout):
The first law of thermodynamics states that energy can be neither created nor destroyed. Energy balance in the body occurs when the energy content of food consumed is matched by the amount of energy expended. For body weight to change, energy imbalance must occur. When intake is lower than expenditure, negative energy balance occurs, and body energy stores are reduced. When energy intake exceeds expenditure, positive energy balance occurs, and body energy stores are increased.
Factors that affect the etiology of obesity must affect one or more components of energy balance. This is why an understanding of energy balance is essential to comprehend how obesity develops.
Components of Energy Balance
Energy Intake
We take in energy in the foods we eat. The major macronutrient sources of dietary energy are fat, carbohydrate, protein, and alcohol. Humans regulate their food intake in a complex way that is incompletely understood. After consumption of food, satiety signals are generated in the periphery from the mouth, from the rest of the gastrointestinal system, and as a consequence of peripheral metabolic processes involved in digestion and absorption of nutrients. Signals from the periphery are monitored by a sophisticated neural system that is incompletely understood. Many hormones and peptides, deriving both from the periphery and from the central nervous system, appear to be involved in the food intake regulatory system. Neural peptides such as α-melanocyte-stimulating hormone, Agouti-related peptide, neuropeptide Y, and melanocyte-concentrating hormone are known to influence eating behavior (19). In addition, gut peptides such as cholecystokinin, gastrin-releasing peptide, glucagonlike peptide-1, bombesin, insulin, peptide YY, and ghrelin can also modify feeding behaviors (19, 20). Longer range signals of satiety may be related to body energy stores (e.g., body fat, glycogen). Leptin is a hormone secreted from adipocytes as fat cell size increases and may serve as a signal within the brain to decrease food intake and increase energy expenditure (21). Circulating nutrients, such as free fatty acids, glucose, and triglycerides, affect food intake as well (22, 23, 24).
Energy Expenditure
Total energy expenditure (TEE) is the sum of resting energy expenditure (REE), thermic effect of food (TEF), and physical activity-related energy expenditure (PAEE). The components of TEE and a comparison of TEE in sedentary and active persons are shown in Figure 58.3.
Resting Energy Expenditure.
The majority of human energy expenditure is through the body’s metabolism at rest, called REE. REE comprises 60% to 80% of TEE in most people. REE is the energy required by the body
to maintain basic physiologic functions such as pumping blood, making hormones, and maintaining body temperature. Basal metabolic rate (BMR) is the theoretic minimum level of energy expended by the body to sustain life. REE is the body’s energy expenditure measured during rest in the fasted state. REE is slightly (˜3%) higher than BMR because of the energy required for arousal. REE is, in general, related to lean body mass, primarily organ and muscle mass. The resting energy requirements of different organs and tissues differ dramatically and are shown in Table 58.1. In adults, lean organs account for almost 75% of REE, although they constitute only 10% of body weight. Skeletal muscle consumes approximately 20% of REE and comprises 40% of body weight. Adipose tissue normally comprises 20% of body weight but consumes only 5% of REE. To illustrate this point, take the example of a physiologically normal 70-kg man. His 300-mg kidney would consume approximately 360 kcal/day, whereas the 15 kg of adipose tissue consumes a total of only 80 kcal/day. REE is generally higher in obese persons than in lean persons because of an increase in lean body mass (organ mass and muscle mass), in addition to the increase in adipose tissue in the obese (25).
to maintain basic physiologic functions such as pumping blood, making hormones, and maintaining body temperature. Basal metabolic rate (BMR) is the theoretic minimum level of energy expended by the body to sustain life. REE is the body’s energy expenditure measured during rest in the fasted state. REE is slightly (˜3%) higher than BMR because of the energy required for arousal. REE is, in general, related to lean body mass, primarily organ and muscle mass. The resting energy requirements of different organs and tissues differ dramatically and are shown in Table 58.1. In adults, lean organs account for almost 75% of REE, although they constitute only 10% of body weight. Skeletal muscle consumes approximately 20% of REE and comprises 40% of body weight. Adipose tissue normally comprises 20% of body weight but consumes only 5% of REE. To illustrate this point, take the example of a physiologically normal 70-kg man. His 300-mg kidney would consume approximately 360 kcal/day, whereas the 15 kg of adipose tissue consumes a total of only 80 kcal/day. REE is generally higher in obese persons than in lean persons because of an increase in lean body mass (organ mass and muscle mass), in addition to the increase in adipose tissue in the obese (25).
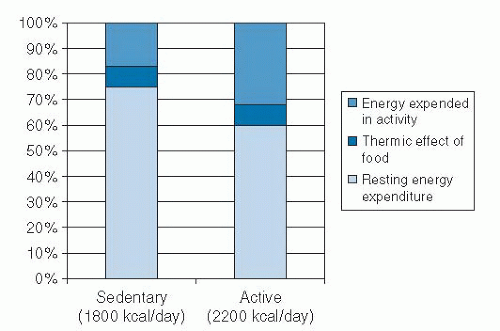 Fig. 58.3. Components of total energy expenditure (TEE) in sedentary and active persons. |
TABLE 58.1 CONTRIBUTION OF DIFFERENT ORGANS AND TISSUES TO ENERGY EXPENDITURE | |||||||||||||||||||||||||||||||||||||||||||||||||||
|---|---|---|---|---|---|---|---|---|---|---|---|---|---|---|---|---|---|---|---|---|---|---|---|---|---|---|---|---|---|---|---|---|---|---|---|---|---|---|---|---|---|---|---|---|---|---|---|---|---|---|---|
| |||||||||||||||||||||||||||||||||||||||||||||||||||
Physical Activity-Related Energy Expenditure.
PAEE is the component of energy expenditure that is most under voluntary control because it is influenced most strongly by the amount of physical activity. PAEE is the most variable component of energy expenditure and can easily range from 10% of TEE in sedentary persons to 40% of TEE in highly active persons. PAEE includes volitional activities such as daily activities and exercise and nonvolitional behaviors such as spontaneous muscle contractions, maintenance of posture, and fidgeting. Although obese and lean persons expend the same amount of energy during activities in which the body weight is supported, obese persons expend more energy than lean persons during weight-bearing activities because of the increased work involved in carrying more weight. Physical activity provides the greatest source of flexibility in the energy expenditure system, and it is the component through which large changes in energy expenditure can be achieved.
Thermic Effect of Food.
TEF is the increase in energy expenditure associated with digestion, absorption, and storage of ingested macronutrients, usually 7% to 10% of the total caloric content of the meal. The energy cost of a meal is associated with the macronutrient composition of food consumed. The TEF is higher for carbohydrate and protein than for fat. The reason for this finding is that the process for energy storage of ingested fat is very efficient, whereas for carbohydrate and protein, additional energy is needed for conversion to an appropriate storage form (e.g., glucose to glycogen, amino acids to protein). Whether obese persons have a systematically lower TEF than lean persons is a matter of great controversy. Certainly, data suggest that this is the case, but supposed differences are very small and are of questionable importance in body weight regulation. If such differences are present, it is not clear whether they existed before the development of obesity and thus may have contributed to weight gain or whether they arise as a consequence of the obese state (26). A reduction in TEF in the obese person could be related to the increased insulin resistance and blunted sympathetic nervous system activity that is often associated with obesity (27).
Energy Stored in the Body.
The body stores energy as protein, carbohydrate, and fat. The body has very limited storage capacity for both protein (in muscle and organs) and carbohydrate (as glucose and glycogen). The capacity of the body to store fat in adipose tissue depots is virtually unlimited. Because of their high energy density and hydrophobic nature, triglycerides are a fivefold better fuel per unit mass than glycogen. A lean adult has approximately 35 billion adipocytes, each containing 0.4 to 0.6 μg of triglyceride. Triglycerides liberate 9.3 kcal/g when oxidized; by comparison, glycogen stored in the liver and muscle produces 4.1 kcal/g when oxidized. Triglycerides are stored very compactly inside the fat cell, thereby accounting for 85% of its weight. Thus, total storage capacity of adipose tissue in lean persons is approximately 80,000 to 130,000 kcal. In obese persons, triglyceride stores can increase tremendously because of both increased adipocyte size and increased
adipocyte cell number. The total body stores of glycogen and protein (as muscle) in an average 70-kg man are approximately 1800 and 110,000 kcal, respectively, in a person of normal weight. However, the body can mobilize only approximately half its protein stores for fuel before life-threatening loss of lean tissue occurs. Thus, adipose tissue represents an effective mechanism for storing fuel and permits survival during periods of food deprivation. The duration of survival during starvation depends on the amount of body fat mass; in lean men, death occurs after approximately 60 to 90 days. In contrast, obese persons have undergone prolonged therapeutic fasts by ingesting only noncaloric fluids, vitamins, and minerals for more than a year without consequences (28).
adipocyte cell number. The total body stores of glycogen and protein (as muscle) in an average 70-kg man are approximately 1800 and 110,000 kcal, respectively, in a person of normal weight. However, the body can mobilize only approximately half its protein stores for fuel before life-threatening loss of lean tissue occurs. Thus, adipose tissue represents an effective mechanism for storing fuel and permits survival during periods of food deprivation. The duration of survival during starvation depends on the amount of body fat mass; in lean men, death occurs after approximately 60 to 90 days. In contrast, obese persons have undergone prolonged therapeutic fasts by ingesting only noncaloric fluids, vitamins, and minerals for more than a year without consequences (28).
Consequences of Energy Imbalance
The average person consumes close to 1 million calories per year, yet many persons are able to maintain a remarkable state of equilibrium. Even a slight perturbation in energy balance would lead to dramatic weight gain or loss. An error in matching intake to expenditure of only 5% would result in a change of 15 kg over the course of a year. Short-term overfeeding and underfeeding studies suggest that energy expenditure is affected when energy intake is altered. During food restriction, energy expenditure declines, attenuating the loss of body weight that results from the negative energy balance (29). During overfeeding, some increase in energy expenditure occurs to mitigate the increase in body weight that would occur as a result of positive energy balance (30). The changes in energy expenditure are much greater with underfeeding than with overfeeding, a finding suggesting that the body has a strong ability to defend against loss of body weight and a much weaker ability to defend against body weight gain.
Negative Energy Balance Results in Weight Loss
An energy deficit of approximately 3500 kcal is needed to lose 1 lb of body weight. Approximately 75% to 85% of weight lost by dieting is composed of fat, and 15% to 25% is fat-free mass. There is regional heterogeneity in the distribution of fat loss, with loss of subcutaneous adipose tissue generally preceding the loss of muscle mass and visceral fat (31). Most of the loss in fat is caused by a decrease in lipid content of existing adipocytes; however, long-term fat loss may decrease the number of fat cells as well.
Positive Energy Balance Results in Weight Gain
When energy intake exceeds energy expenditure, a state of positive energy balance is reached, and excess calories are stored in the body. The composition of weight gain during positive energy balance is predominantly fat (˜70% to 80%), with some gain in lean body mass (20% to 30%). Not all excess energy is stored in the body during overfeeding. Another way of saying this is that efficiency of storage of excess energy is not 100%. It is generally accepted that efficiency of storage of excess nutrients is somewhere between 60% and 90% (32, 33). Efficiency of storage of excess energy seems to be influenced by characteristics of the subjects (i.e., genetics) and the composition of the diet overconsumed. Bouchard et al (34) found that twins responded with similar amounts of body weight gain when they were overfed, a finding suggesting that genes influence the efficiency of storage during overfeeding.
Horton et al (35) demonstrated differences in efficiency of storage of excess fat versus excess carbohydrate. They overfed 16 men isoenergetic amounts (50% above energy requirements) of fat and carbohydrate for 14 days each. Fat overfeeding had minimal effects on fat oxidation and TEE, thus leading to efficient storage of 90% to 95% of the total excess energy consumed. In contrast, carbohydrate overfeeding produced progressive increases in carbohydrate oxidation and TEE and decreases in fat oxidation. This resulted in storage of only 75% to 85% of excess energy during carbohydrate overfeeding. Thus, carbohydrate overfeeding was associated with a lower storage efficiency than fat overfeeding.
ETIOLOGY OF OBESITY
The body fat mass is determined by the equilibrium established between energy intake and energy expenditure. Therefore, obesity within an individual is a result of a long-term imbalance between energy intake and expenditure such that either energy intake is too high for that person’s level of energy expenditure, or energy expenditure is too low for that person’s level of energy intake (36). These determinants of energy balance (energy intake and expenditure) are themselves influenced by numerous biologic and environmental factors, which makes the etiology of obesity more complex that it may first appear. For example, interindividual variations in body weight and body composition can be explained by some genetic factors that may affect energy balance (37). However, although genes can predispose individuals to weight gain, the onset of the obesity pandemic has occurred relatively recently (over the past four to five decades) and is therefore not primarily a result of genetic factors. To affect the phenotype of a population would require substantial changes to the gene pool over thousands of years, not decades. Environmental factors that increase energy intake and decrease energy expenditure promote an “obesogenic” environmental milieu. As such, the obesity pandemic is a result of underlying biologic susceptibilities to obesity within an obesogenic environment.
Biologic Influences on Obesity
Evidence from family studies shows strong genetic influences on body weight. Rare single gene defects contribute to the development of obesity in a few individuals; however, common obesity is likely a highly polygenic and complex disorder. Congenital or acquired medical disorders can also contribute to the development of obesity.
Genetic Heritability of Body Weight
In family studies, BMI is correlated between first-degree family members (38), and having an overweight parent increases the risk that the children will become overweight (39, 40). In adoption studies, genetic factors account for 20% to 60% of the variation in BMI (41). The BMIs of the biologic, not adoptive, parents is more strongly correlated with the adult weight of the adoptive child (42). In data from numerous twin studies (>25,000 pairs), genetic factors explain 50% to 90% of the variance in BMI, especially in identical twins (41), regardless of whether twins were raised separately or apart (43).
Stay updated, free articles. Join our Telegram channel

Full access? Get Clinical Tree


