Nutrition and Diet in Rheumatic and Arthritic Diseases1
Sarah L. Morgan
Joseph E. Baggott
1Abbreviations: AICA, aminoimidazole carboxamide; BIA, bioelectrical impedance analysis; BMD, bone mineral density; BMI, body mass index; BOKS, Boston Osteoarthritis of the Knee Study; DMARD, disease-modifying antirheumatic drug; DXA, dual-energy x-ray absorptiometry; HAQ, Health Assessment Questionnaire; IL, interleukin; ILI, intensive lifestyle intervention; m-HAQ, modified Stanford Health Assessment Questionnaire; MNA, Mini Nutritional Assessment; MTX, methotrexate; NHANES III, Third National Health and Nutrition Examination Survey; NHIS, National Health Interview Survey; OA, osteoarthritis; RA, rheumatoid arthritis; RDA, recommended dietary allowance; REE, resting energy expenditure; SGA,Subjective Global Assessment; TNF, tumor necrosis factor; WOMAC, Western Ontario and McMaster University Osteoarthritis Index.
OVERVIEW AND DEFINITION OF RHEUMATIC DISEASES AND ARTHRITIS
Definition and Prevalence
“Rheumatic diseases are characterized by inflammation (redness and/or heat, swelling, and pain) and loss of function of one or more connecting or supporting structures of the body. Rheumatic diseases typically affect joints, tendons, ligaments, bones, and muscles, producing symptoms such as pain, swelling, and stiffness, and may involve internal organs”(1). Some examples of rheumatic diseases are infectious arthritis, osteoarthritis (OA), psoriatic arthritis, rheumatoid arthritis (RA), fibromyalgia, systemic lupus erythematosus, gout, polymyositis, bursitis, and tendonitis. Arthritis refers to inflammation of a joint (2). The National Arthritis Foundation lists more than 100 types of arthritis and related diseases (3). The National Arthritis Data Workgroup, using data from the National Health Interview Survey (NHIS), has estimated that approximately 46.4 million Americans have self-reported or physician-diagnosed arthritis(4). This chapter focuses on the nutritional correlates of three types of arthritis: gout, OA, and RA.
Effects of Arthritis on Nutritional Status
Arthritis may affect nutritional status by several mechanisms. Nutrient intake may be impaired because it is difficult to chew food, or food preparation is difficult because of arthritis-related joint pain or swelling. Some general strategies can be applied to help individuals with arthritis in the preparation of food (5). Many different items including extended drinking straws, over-the-sink cutting boards, jar lid openers, rolling trivets, nonskid pads, easy grip utensils, pan holders, and handles for milk cartons are available to make food preparation easier.
Additional mechanisms include increases in energy requirement because of inflammation (see the RA section) and relationships of obesity with gout and OA (see the gout and OA sections).
Additional mechanisms include increases in energy requirement because of inflammation (see the RA section) and relationships of obesity with gout and OA (see the gout and OA sections).
TABLE 91.1 ARTHRITIS DRUG-NUTRIENT INTERACTIONS | ||||||||||||||||||||||
|---|---|---|---|---|---|---|---|---|---|---|---|---|---|---|---|---|---|---|---|---|---|---|
| ||||||||||||||||||||||
Drug-Nutrient Interactions
Drugs used to treat arthritis may interact with and affect the need for a wide variety of nutrients (6, 7). Drugs used for arthritis therapy may cause side effects, such as nausea and vomiting, which may affect nutrient intake (8). In addition, various nutrients may affect drug therapies (see the later discussion of folic acid-methotrexate [MTX] interactions) (9, 10, 11, 12, 13, 14). Polymorphisms in nutrient pathways are also being found to affect response to arthritis therapies such as MTX (15, 16). An example of another common drug-nutrient interaction is iron deficiency caused by gastrointestinal bleeding from aspirin or nonsteroidal anti-inflammatory drug use. Table 91.1 outlines possible drug-nutrient interactions.
MTX therapy is widely viewed as the gold standard and anchor therapy in the treatment of RA (17, 18). Evidence suggests that low-dose MTX blocks purine nucleotide biosynthesis at a folate-dependent step catalyzed by ami-noimidazole carboxamide (AICA) ribotide (AICAR) trans-formylase, and that this produces immunosuppression via adenosine accumulation (19, 20) (Fig. 91.1).
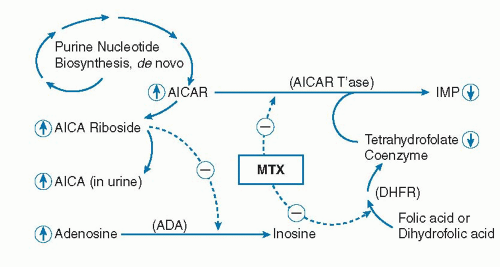 Fig. 91.1. Proposed mechanism of action of low-dose methotrexate (MTX) therapy for rheumatoid arthritis. Dotted lines with negative signs in circles indicate enzyme inhibition; circles with arrows indicate increased or decreased in vivo levels. ADA, adenosine deaminase; AICA, aminoimidazole-carboxamide; AICAR, AICA ribotide; AICAR T’ase, AICAR transformylase; DHFR, dihydrofolate reductase. |
Because MTX is antifolate, the potential for the drug to produce a functional deficiency of folate exists. Indeed, Morgan et al found that functional folate deficiency did exist in MTX-treated patients (11) and that certain MTX toxicities, such as cytopenia, resembled those found in uncomplicated folate deficiency, whereas others, such as liver toxicity, are probably a toxic effect of MTX (21, 22). Because MTX toxicity is a major reason for discontinuing the drug, there are compelling reasons to ameliorate these side effects (8).
Several studies have demonstrated that folic acid supplementation of MTX-treated patients with RA lowers drug toxicity while preserving efficacy (23, 24, 25, 26, 27). The mechanism is not known; however, it is possible that folic acid replenishes folate coenzyme levels in organs susceptible to MTX-induced folate deficiency (e.g., enterocyte, liver) although it has little effect on MTX cytotoxicity in immunologic cells. Folate supplementation may also confer other positive benefits related to MTX metabolism. In one study, relatively high AICA 24-hour urine concentrations were correlated with greater efficacy; and folinic acid, but not folic acid, supplementation normalized urinary AICA (28). It is now routinely recommended that patients receiving MTX also be supplemented with folic acid (29, 30, 31, 32, 33).
GOUT
Definition
Gout is a crystalline-type arthritis that results from deposition of uric acid in joints when uric acid reaches its limit of solubility (34). The uric acid crystals cause inflammation, swelling, and pain in the affected joint, especially the big toe (podagra) (35, 36, 37, 38). The clinical spectrum of gout can range from acute arthritis to accumulation of uric acid crystalline deposits called tophi, or uric acid urolithiasis and, less frequently, renal failure (gouty nephropathy) (39).
Epidemiology
Using data from the NHIS and the Third National Health and Nutrition Examination Survey (NHANES III), it has been estimated that 3.0 million adults aged 18 or older
had gout in the previous year, and that 6.1 million adults in the United States had previously had gout (40). The prevalence of gout is increasing in the United States and around the world (34, 36, 41, 42). Gout is much more frequent in men than in women; however, because of greater longevity, gout will become an increasing problem in women (36, 39, 42, 43).
had gout in the previous year, and that 6.1 million adults in the United States had previously had gout (40). The prevalence of gout is increasing in the United States and around the world (34, 36, 41, 42). Gout is much more frequent in men than in women; however, because of greater longevity, gout will become an increasing problem in women (36, 39, 42, 43).
Mechanisms of Hyperuricemia
Uric acid is the end product of purine catabolism in humans. Xanthine oxidase catalyzes the oxidation of hypoxanthine to xanthine and ultimately to uric acid. Hyperuricemia is defined as a serum uric acid concentration greater than 7.0 mg/dL in men or greater than 6.0 mg/dL in women and is a common feature in all types of gout. Although hyperuricemia is a risk factor for gouty arthritis, the majority of individuals with hyperuricemia will not develop gout (36, 44). Overt manifestations of gout are more likely when the serum urate is greater than 9.0 mg/dL and the urinary uric acid excretion is greater than 800 mg/day (45).
The basic mechanisms of hyperuricemia are overproduction (˜10% of patients) and underexcretion (˜90% of patients) of uric acid. Overproduction could result from myeloproliferative disorders, malignant diseases, or hemolytic anemias. Metabolic inborn errors that cause increased purine and urate production include hypoxanthine-guanine phosphoribosyltransferase deficiency, phosphoribosylpyrophosphate synthetase overactivity, and glucose-6-phosphatase deficiency. Inhibitors of xanthine oxidase are frequently used when individuals overproduce uric acid. Impaired urate clearance may result from renal failure, dehydration, diabetic ketoacidosis, ethanol intake, diuretics, or use of specific medications (see later) (46). Uricosuric agents may be considered for the treatment of impaired urate excretion.
Gout may be classified as primary or secondary (36). Primary gout is related to an inborn error or an acquired metabolic defect. Examples of secondary gout include the use of drugs that increase serum urate concentrations (diuretics, tacrolimus, methoxyflurane, cyclosporine, ethambutol, pyrazinamide, cytotoxic chemotherapies, ethanol, low-dose salicylates, levodopa, ribavirin, interferon, or teriparatide) (36). Other drugs and nutrients are known to lower serum urate concentrations (ascorbic acid, benzbromarone, calcitonin, citrate, estrogen, fenofibrate, losartan, probenecid, high-dose salicylates, and sulfinpyrazone) (47).
Metabolic and Lifestyle Profiles of Individuals with Hyperuricemia and Gout
The classic profile of an individual with gout is an obese, hypertensive, middle-aged man who eats rich foods and drinks alcohol (39).
Metabolic Syndrome and Gout
Strong correlations exist among obesity, insulin resistance, and serum uric acid concentrations and between renal uric acid clearance and degree of insulin resistance (48). Choi et al (49) determined the relationship between metabolic syndrome, defined as ≥3 of the following criteria: abdominal obesity (waist circumference >102 cm in men or >88 cm in women), hypertriglyceridemia (≥150 mg/ dL), low high-density lipoprotein cholesterol (<40 mg/dL in men or <50 mg/dL in women), hypertension (> 130/85 mg Hg), and high fasting glucose (≥110 mg/dL) (50) and gout prevalence. The prevalence of metabolic syndrome was 62.8% (95% confidence interval [CI], 51.8% to 73.6%) in patients with gout and 25.4% (23.5% to 27.3%) in patients without gout. In addition, a history of gout was shown to be an independent risk factor for the development of type 2 diabetes (51).
Dietary Correlates of Hyperuricemia and Gout
Dietary purines can contribute up to one third of the uric acid in the body (52). However, subjects with gout receiving a purine-free diet had little change in plasma uric acid compared with those receiving a regular diet (53). A variety of foods have been reported to increase serum uric acid and to increase gouty attacks, including meats, seafood, yeast, yeast extracts, peas, beans, lentils, asparagus, spinach, mushrooms, and beer and alcoholic drinks (54). Data from the NHANES III survey showed that, after adjusting for age, uric acid concentrations in adults differed between extreme quintiles by 0.48 mg/dL for total meat intake (95% CI, 0.34 to 0.61; p for trend <.001), 0.16 mg/dL for seafood (95% CI, 0.06 to 0.27; p for trend .005), and inversely by 21 mg/dL for total dairy food intake (95% CI, 0.37 to 0.04; p for trend = .02), indicating that higher meat and seafood consumption, but not total protein, may be related to hyperuricemia (42, 55). In the Health Professionals Follow-up Study, men in the highest quintiles of meat and seafood intakes had 41% and 51% increased risk of gout, respectively, although the consumption of purine-rich vegetables was not associated with risk (42, 56). Individuals consuming a serving of milk one or more times per day had lower serum uric acid than those consuming no milk (55). Yogurt consumption at least every other day was also associated with lower serum uric acid compared with individuals not consuming yogurt (55). Data from the NHANES III also showed that the adjusted odds ratio for hyperuricemia in individuals consuming 6 cups or more of coffee per day, compared with no coffee consumption, was 0.57 (95% CI, 0.35 to 0.94; p for trend .001) (57). Tea consumption was not associated with hyperuricemia, and the authors suggested that the inverse association with coffee intake may be mediated by components other than caffeine. Another study using NHANES III data found that consumption of soft drinks containing fructose, but not artificially sweetened soft drinks, was associated with higher serum uric acid concentrations (58). The metabolism of fructose has been shown to generate uric acid more than other sugars (59). Data from the Health Professionals Follow-up Study showed that greater vitamin C intake was associated
with lower uric acid (60). At intake higher than 400 to 500 mg/day of vitamin C, serum uric acid concentrations plateaued (54, 61). The risk of gout was prospectively evaluated over a 23-year period in 47,150 men who had no history of gout at baseline (56). Increased risk of gout was positively associated with higher consumption of meat and inversely associated with higher intake of dairy products. There were no relationships with intakes of total protein or purine-rich vegetables.
with lower uric acid (60). At intake higher than 400 to 500 mg/day of vitamin C, serum uric acid concentrations plateaued (54, 61). The risk of gout was prospectively evaluated over a 23-year period in 47,150 men who had no history of gout at baseline (56). Increased risk of gout was positively associated with higher consumption of meat and inversely associated with higher intake of dairy products. There were no relationships with intakes of total protein or purine-rich vegetables.
Alcohol and Hyperuricemia and Gout
Various mechanisms linking hyperuricemia and gout to alcohol consumption have been postulated. These include (a) production of temporary lactic acidosis; (b) stimulation of purine production by accelerated degradation of adenosine triphosphate to adenosine monophosphate by conversion of acetate to acetyl-coenzyme A during alcohol metabolism; (c) high purine content in beer, particularly guanosine; and (d) consumption of lead-contaminated alcohol causing a reduction in renal urate excretion and subsequent hyperuricemia (54). NHANES III data showed that intake of beer and liquor, after adjustment for other risk factors, predicted elevated uric acid concentrations (62). Data from the Health Professionals Follow-up Study suggested a positive dose-response relation between total alcohol intake and gout (63). The relative risk for hyperuricemia with beer or liquor consumption was greater than for wine intake. Analyses from the Nutrition and Health Survey in Taiwan found that increasing beer intake was independently associated with hyperuricemia (serum uric acid greater than 6.6 mg/dL for women or 7.7 mg/dL for men) in men, but not women (61).
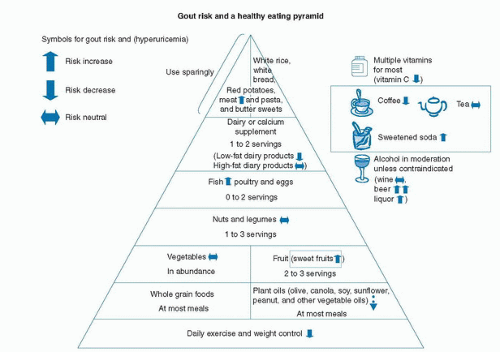 Fig. 91.2. Dietary gout risk and the healthy eating pyramid. (Reprinted with permission from Choi HK. A prescription for lifestyle change in patients with hyperuricemia and gout. Curr Op in Rheumatol 2010;22:165-72.) |
Dietary Therapy
Pharmacologic therapy with allopurinol or febuxostat, which decreases oxidation of purines to uric acid, and uricosuric agents, such as probenecid and sulfinpyrazone, have changed gout therapy. Dietary therapies may have additive benefits to pharmacologic therapy, although they rarely lower serum urate concentrations by more than 1 mg/dL, even with severe purine restriction (39, 53, 64, 65). Dietary management of gout is particularly useful during a gouty flare (66, 67, 68). Figure 91.2 displays the impact of dietary components on gout risk. The American Dietetic Association Nutrition Care Manual (69) recommends that during an acute gouty attack, the patient should do the following: (a) consume 8 to 16 cups
of fluid/day, at least half as water; (b) abstain from alcohol; (c) limit animal foods; (d) eat a moderate amount of protein with recommended sources as low-fat or nonfat dairy, tofu, eggs, and nut butters; and (e) limit meat, fish, and poultry to 4 to 6 ounces/day. During remission from a gout flare, the recommendations are as follows: (a) consume 8 to 16 cups of fluid/day, at least half as water; (b) abstain from alcohol; (c) follow a well-balanced eating plan following the Dietary Guidelines for Americans and, as tolerated, consume animal foods and continue to eat a moderate amount of protein; and (d) maintain a desirable body weight and avoid fasting or high-protein diets for weight loss (69). Choi (67) recommend the following guidelines for patients with gout: (a) exercise daily and reduce weight; (b) limit red meat intake; (c) tailor seafood intake to individual risk for cardiovascular disease and consider omega-3 fatty acid supplements; (d) drink skim milk or consume other low-fat dairy products daily up to 2 servings per day; (e) consume vegetable protein, nuts, legumes, and purine-rich vegetables; (f) reduce alcoholic beverages to less than 1 or 2 drinks per day for men or 1 drink for women; (g) limit sugar-sweetened softdrinks and other beverages containing high-fructose corn syrup; (h) allow coffee drinking if already drinking coffee; and (i) consider taking vitamin C supplements.
of fluid/day, at least half as water; (b) abstain from alcohol; (c) limit animal foods; (d) eat a moderate amount of protein with recommended sources as low-fat or nonfat dairy, tofu, eggs, and nut butters; and (e) limit meat, fish, and poultry to 4 to 6 ounces/day. During remission from a gout flare, the recommendations are as follows: (a) consume 8 to 16 cups of fluid/day, at least half as water; (b) abstain from alcohol; (c) follow a well-balanced eating plan following the Dietary Guidelines for Americans and, as tolerated, consume animal foods and continue to eat a moderate amount of protein; and (d) maintain a desirable body weight and avoid fasting or high-protein diets for weight loss (69). Choi (67) recommend the following guidelines for patients with gout: (a) exercise daily and reduce weight; (b) limit red meat intake; (c) tailor seafood intake to individual risk for cardiovascular disease and consider omega-3 fatty acid supplements; (d) drink skim milk or consume other low-fat dairy products daily up to 2 servings per day; (e) consume vegetable protein, nuts, legumes, and purine-rich vegetables; (f) reduce alcoholic beverages to less than 1 or 2 drinks per day for men or 1 drink for women; (g) limit sugar-sweetened softdrinks and other beverages containing high-fructose corn syrup; (h) allow coffee drinking if already drinking coffee; and (i) consider taking vitamin C supplements.
Summary
Unfortunately the actual dietary practices of individuals with gout appear to be inconsistent with current recommended diet therapy recommendations (70). New goals for gout management include a major emphasis on diet therapy to reduce insulin resistance and produce weight loss in overweight patients.
OSTEOARTHRITIS
Definition
OA, also known as degenerative joint disease, is a progressive disorder of the joints caused by gradual loss of cartilage, resulting in the development of bony spurs and cysts at the margins of the joints (71).
Epidemiology
Estimates from the NHANES III and the NHIS estimate that 27 million adults in the United States have OA (40). The most commonly affected joints are knees, hips, and hands with individuals 50 years or older; and women more often affected than men (40). The prevalence of radiographic knee arthritis in US adults without and with symptoms was estimated as 37.4% and 12.1%, respectively, from NHANES III (72). Demographic characteristics associated with radiographic knee arthritis included body mass index (BMI) of 30 or greater, advancing age, non-Hispanic black race, and men doing manual labor.
Nutrient Intakes of Patients with Osteoarthritis
In a series of 12 patients with OA, more than 50% consumed diets with less than 67% of the recommended dietary allowances (RDAs) for iron, zinc, vitamin E, folate, and vitamin B6 (73). Of 82 older ambulatory patients, 80% had BMI of 27 or greater (74). Seventy-nine percent of 77 patients participating in a multidisci-plinary program for the management of OA were obese, and the degree of obesity was related to the pain of arthritis. Dietary intakes of vitamin D, folate, pyridoxine, and zinc averaged less than 80% of the RDA (75). In another study, patients with OA were, on average, 15 lbs (6.8 kg) overweight, whereas patients with RA averaged 10 lbs (4.5 kg) underweight (76).
Two studies evaluated the relationship of vitamin K status with OA. Radiographs in 672 Framingham Offspring Study participants showed that the mean number of knee joints with osteophytes decreased with greater phyllo-quinone concentration (77). The prevalence ratio of OA, osteophytes, joint space narrowing, and number of joints with all three features in the hand were also inversely associated with phylloquinone. A Japanese study with 719 individuals aged 60 years or older analyzed radiographs of the knee with Kellgren/Lawrence grading (0 = normal to 4 = severe) and found that 70.8% had a score of 2 or higher. Age, BMI, and female gender predicted the presence of OA (78, 79). The only dietary factor inversely associated with radiographic knee arthritis was vitamin K. Vitamin K status could be important in the gamma carboxylation of vitamin K-dependent proteins, such as matrix Gla protein. However, in a clinical trial, vitamin K supplementation was not associated with greater bone mineral density (BMD) or lower bone turnover compared with placebo (80).
Nutritional Correlates
The Chingford Study (81) of 1003 adult women found radiographic evidence of knee OA in 118. Elevated blood glucose and moderately elevated serum cholesterol were significantly related to radiographic unilateral knee OA. Bilateral knee OA was significantly associated with hypertension, and elevated cholesterol. In contrast, the Baltimore Longitudinal Study of Aging (82) found that no metabolic factors (blood pressure, fasting lipids, or 2-hour glucose tolerance test) were related to knee radiograph OA after adjusting for age and obesity in 464 men and 275 women aged greater than 40 years.
Obesity
Numerous studies have shown a positive relationship between obesity, elevated BMI, and knee OA (83, 84, 85, 86, 87, 88, 89, 90, 91, 92, 93, 94, 95, 96). Body fat distribution does not seem to affect the risk of development of knee OA; however, emerging data suggest that elevated fat mass is associated with increased concentrations of inflammatory mediators and adipokines that affect cartilage and joints (96).
In the Framingham cohort, Felson noted that weight loss of 5.1 kg over 10 years decreased the odds of incident knee OA by 50% (86). In 142 obese patients with radiographic evidence of knee OA and reported disability related to the arthritis (97), each kilogram of weight loss was associated with an approximate 4-unit reduction of knee joint forces including compressive force, resultant force, abduction moment, and medial rotation moment. Each pound of weight loss was associated with an approximately fourfold reduction in load on the knee. The 18-month Arthritis, Diet and Activity Promotion Trial of 316 community-dwelling individuals 60 years of age or older (98) showed that a diet plus exercise intervention improved Western Ontario and McMaster Universities Osteoarthritis Index (WOMAC) scores significantly relative to exercise only, diet only, or control groups. Both the diet-only and the diet-plus-exercise groups had significant weight loss, but only the diet-plus-exercise group had significant reduction in self-reported pain (p < .05) with a 30.3% decrease in pain over the 18-month intervention. There was no difference in radiographic progression across intervention groups. The same study found that serum biomarkers (cartilage oligomeric protein, hyaluro-nan, antigenic keratin sulfate, and transforming growth factor-β1) were relatively stable over 18 months; however, higher serum hyaluronan was correlated with worse radiographic classification, lending support for the idea that OA is a metabolically active disease (99).
Stay updated, free articles. Join our Telegram channel

Full access? Get Clinical Tree


