Membrane Transporters and Drug Response
Transporters are membrane proteins that are present in all organisms. These proteins control the influx of essential nutrients and ions and the efflux of cellular waste, environmental toxins, drugs, and other xenobiotics (Figure 5–1), consistent with their critical roles in cellular homeostasis, ~2000 genes in the human genome, ~7% of the total number of genes, code for transporters or transporter-related proteins. The functions of membrane transporters may be facilitated (equilibrative, not requiring energy) or active (requiring energy). In considering the transport of drugs, pharmacologists generally focus on transporters from 2 major superfamilies, ABC (ATP binding cassette) and SLC (solute carrier) transporters.
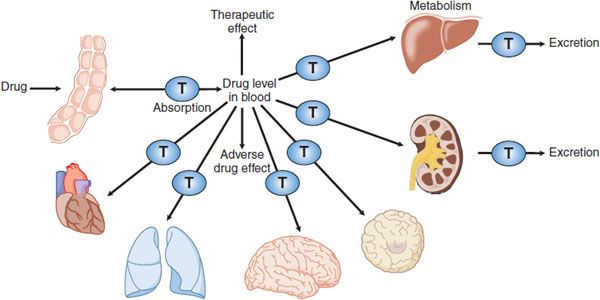
Figure 5–1 Membrane transporters in pharmacokinetic pathways. Membrane transporters (T) play roles in pharmacokinetic pathways (drug absorption, distribution, metabolism, and excretion), thereby setting systemic drug levels. Drug levels often drive therapeutic and adverse drug effects.
Most ABC proteins are primary active transporters, which rely on ATP hydrolysis to actively pump their substrates across membranes. Among the best recognized transporters in the ABC superfamily are P-glycoprotein (Pgp, encoded by ABCB1, also termed MDR1) and the cystic fibrosis transmembrane regulator (CFTR, encoded by ABCC7). The SLC superfamily includes genes that encode facilitated transporters and ion-coupled secondary active transporters. Forty-eight SLC families with ~315 transporters have been identified in the human genome. Many SLC transporters serve as drug targets or in drug absorption and disposition. Widely recognized SLC transporters include the serotonin transporter, SERT, and the dopamine transporter, DAT, both targets for antidepressant medications.
MEMBRANE TRANSPORTERS IN THERAPEUTIC DRUG RESPONSES
PHARMACOKINETICS. Transporters important in pharmacokinetics generally are located in intestinal, renal, and hepatic epithelia, where they function in the selective absorption and elimination of endogenous substances and xenobiotics, including drugs. Transporters work in concert with drug-metabolizing enzymes to eliminate drugs and their metabolites (Figure 5–2). In addition, transporters in various cell types mediate tissue-specific drug distribution (drug targeting). Conversely, transporters also may serve as protective barriers to particular organs and cell types. For example, P-glycoprotein in the blood-brain barrier protects the central nervous system (CNS) from a variety of structurally diverse drugs through its efflux mechanisms.
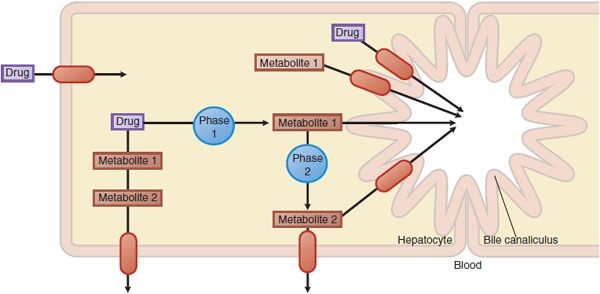
Figure 5–2 Hepatic drug transporters. Membrane transporters (red ovals with arrows) work in concert with phase 1 and phase 2 drug-metabolizing enzymes in the hepatocyte to mediate the uptake and efflux of drugs and their metabolites.
PHARMACODYNAMICS: TRANSPORTERS AS DRUG TARGETS. Membrane transporters are the targets of many clinically used drugs. SERT (SLC6A4) is a target for a major class of antidepressant drugs, the selective serotonin reuptake inhibitors (SSRIs). Other neurotransmitter reuptake transporters serve as drug targets for the tricyclic antidepressants, various amphetamines (including amphetamine-like drugs used in the treatment of attention deficit disorder in children), and anticonvulsants.
These transporters also may be involved in the pathogenesis of neuropsychiatric disorders, including Alzheimer and Parkinson diseases. Transporters that are nonneuronal also may be potential drug targets, e.g., cholesterol transporters in cardiovascular disease, nucleoside transporters in cancers, glucose transporters in metabolic syndromes, and Na+-H+ antiporters in hypertension.
DRUG RESISTANCE. Membrane transporters play critical roles in the development of resistance to anticancer drugs, antiviral agents, and anticonvulsants. Decreased uptake of drugs, such as folate antagonists, nucleoside analogs, and platinum complexes, is mediated by reduced expression of influx transporters required for these drugs to access the tumor. Enhanced efflux of hydrophobic drugs is one mechanism of antitumor resistance in cellular assays of resistance.
For example, P-glycoprotein is overexpressed in tumor cells after exposure to cytotoxic anticancer agents. P-glycoprotein pumps out the anticancer drugs, rendering cells resistant to their cytotoxic effects. The over-expression of multidrug resistance protein 4 (MRP4) is associated with resistance to antiviral nucleoside analogs.
MEMBRANE TRANSPORTERS AND ADVERSE DRUG RESPONSES
As controllers of import and export, transporters ultimately control the exposure of cells to chemical carcinogens, environmental toxins, and drugs. Thus, transporters play crucial roles in the cellular toxicities of these agents. Transporter-mediated adverse drug responses generally can be classified into 3 categories (Figure 5–3).
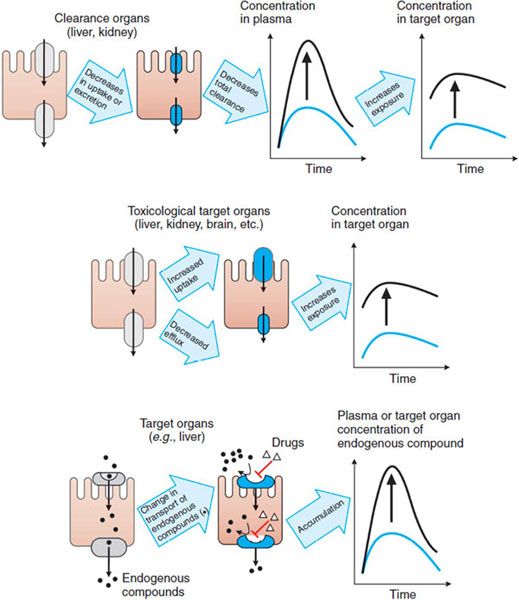
Figure 5–3 Major mechanisms by which transporters mediate adverse drug responses. Three cases are given. The left panel of each case provides a representation of the mechanism; the right panel shows the resulting effect on drug levels. (Top panel) Increase in the plasma concentrations of drug due to a decrease in the uptake and/or secretion in clearance organs (e.g., liver and kidney). (Middle panel) Increase in the concentration of drug in toxicological target organs due to the enhanced uptake or reduced efflux. (Bottom panel) Increase in the plasma concentration of an endogenous compound (e.g., a bile acid) due to a drug’s inhibiting the influx of the endogenous compound in its eliminating or target organ. The diagram also may represent an increase in the concentration of the endogenous compound in the target organ owing to drug-inhibited efflux of the endogenous compound.
Transporters expressed in the liver and kidney, as well as metabolic enzymes, are key determinants of drug exposure in the circulating blood, thereby affecting exposure, and hence toxicity, in all organs (Figure 5–3, top panel). For example, after oral administration of an HMG-CoA reductase inhibitor (e.g., pravastatin), the efficient first-pass hepatic uptake of the drug by the organic anion-transporting polypeptide OATP1B1 maximizes the effects of such drugs on hepatic HMG-CoA reductase. Uptake by OATP1B1 also minimizes the escape of these drugs into the systemic circulation, where they can cause adverse responses such as skeletal muscle myopathy.
Transporters expressed in tissues that may be targets for drug toxicity (e.g., brain) or in barriers to such tissues (e.g., the blood-brain barrier [BBB]) can tightly control local drug concentrations and thus control the exposure of these tissues to the drug (Figure 5–3, middle panel). For example, endothelial cells in the BBB are linked by tight junctions, and some efflux transporters are expressed on the blood-facing (luminal) side, thereby restricting the penetration of compounds into the brain. The interactions of loperamide and quinidine are a good example of transporter control of drug exposure at this site. Loperamide is a peripheral opioid used in the treatment of diarrhea and is a substrate of P-glycoprotein. Inhibition of P-glycoprotein-mediated efflux in the BBB would cause an increase in the concentration of loperamide in the CNS and potentiate adverse effects. Indeed, coadministration of loperamide and the potent P-glycoprotein inhibitor quinidine results in significant respiratory depression, an adverse response to the loperamide.
The case of oseltamivir (the antiviral drug TAMIFLU) provides an example that dysfunction of an active barrier may cause a CNS effect. Oseltamivir and its active form, Ro64-0802, undergo active efflux across the BBB by P-glycoprotein, organic anion transporter 3 (OAT3), and multidrug resistance-associated protein 4 (MRP4). Decreased activities of these transporters at the BBB can enhance the CNS exposure to oseltamivir and Ro64-0802, contributing to an adverse effect on the CNS.
Drug-induced toxicity sometimes is caused by the concentrative tissue distribution mediated by influx transporters. For example, biguanides (e.g., metformin and phenformin), used for the treatment of type 2 diabetes mellitus, can produce lactic acidosis, a lethal side effect. Biguanides are substrates of the organic cation transporter 1 (OCT1), which is highly expressed in the liver. OCT1-mediated hepatic uptake of biguanides plays an important role in lactic acidosis. The organic anion transporter 1 (OAT1) and organic cation transporters (OCT1 and OCT2) provide other examples of transporter-related toxicity. OAT1 is expressed mainly in the kidney and is responsible for the renal tubular secretion of anionic compounds. Substrates of OAT1, such as cephaloridine (a β-lactam antibiotic), and adefovir and cidofovir (antiviral drugs), reportedly cause nephrotoxicity. In vitro experiments suggest that cephaloridine, adefovir, and cidofovir are substrates of OAT1 and that OAT1-expressing cells are more susceptible to the toxicity of these drugs than control cells. Exogenous expression of OCT1 and OCT2 enhances the sensitivities of tumor cells to the cytotoxic effect of oxaliplatin for OCT1, and cisplatin and oxaliplatin for OCT2.
Drugs may modulate transporters for endogenous ligands and thereby exert adverse effects (Figure 5–3, bottom panel). For example, bile acids are taken up mainly by Na+–taurocholate cotransporting polypeptide (NTCP) and excreted into the bile by the bile salt export pump (BSEP, ABCB11). Bilirubin is taken up by OATP1B1 and conjugated with glucuronic acid, and bilirubin glucuronide is excreted by the multidrug-resistance-associated protein (MRP2, ABCC2). Inhibition of these transporters by drugs may cause cholestasis or hyperbilirubinemia.
Uptake and efflux transporters determine the plasma and tissue concentrations of endogenous compounds and xenobiotics, thereby influencing the systemic or site-specific toxicity of drugs.
BASIC MECHANISMS OF MEMBRANE TRANSPORT
TRANSPORTERS VERSUS CHANNELS. Both channels and transporters facilitate the membrane permeation of inorganic ions and organic compounds. In general, channels have 2 primary states, open and closed, that are totally stochastic phenomena. Only in the open state do channels appear to act as pores for the selected ions. After opening, channels return to the closed state as a function of time. In contrast, a transporter forms an intermediate complex with the substrate (solute), and subsequently a conformational change in the transporter induces translocation of the substrates to the other side of the membrane.
The turnover rate constants of typical channels are 106 to 108 s–1; those of transporters are, at most, 101 to 103 s–1. Because a particular transporter forms intermediate complexes with specific compounds (referred to as substrates), transporter-mediated membrane transport is characterized by saturability and inhibition by substrate analogs, as described in “Kinetics of Transport.”
The basic mechanisms involved in solute transport across biological membranes include passive diffusion, facilitated diffusion, and active transport. Active transport can be further subdivided into primary and secondary active transport. These mechanisms are depicted in Figure 5–4.
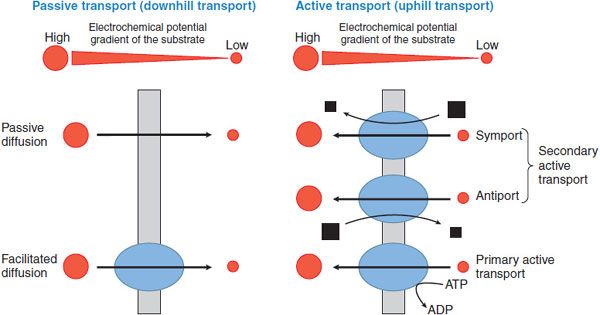
Figure 5–4 Classification of membrane transport mechanisms. Red circles depict the substrate. Size of the circles is proportional to the concentration of the substrate. Arrows show the direction of flux. Black squares represent the ion that supplies the driving force for transport (size is proportional to the concentration of the ion). Blue ovals depict transport proteins.
PASSIVE DIFFUSION. Simple diffusion of a solute across the plasma membrane consists of 3 processes: partition from the aqueous to the lipid phase, diffusion across the lipid bilayer, and repartition into the aqueous phase on the opposite side. Diffusion of any solute (including drugs) occurs down an electrochemical potential gradient of the solute.
FACILITATED DIFFUSION. Diffusion of ions and organic compounds across the plasma membrane may be facilitated by a membrane transporter. Facilitated diffusion is a form of transporter-mediated membrane transport that does not require energy input. Just as in passive diffusion, the transport of ionized and nonionized compounds across the plasma membrane occurs down their electrochemical potential gradient. Therefore, steady state will be achieved when the electrochemical potentials of the compound on both sides of the membrane become equal.
ACTIVE TRANSPORT. Active transport is the form of membrane transport that requires the input of energy. It is the transport of solutes against their electrochemical gradients, leading to the concentration of solutes on 1 side of the plasma membrane and the creation of potential energy in the electrochemical gradient formed. Active transport plays an important role in the uptake and efflux of drugs and other solutes. Depending on the driving force, active transport can be subdivided into primary and secondary active transport (see Figure 5–4).
Primary Active Transport. Membrane transport that directly couples with ATP hydrolysis is called primary active transport. ABC transporters are examples of primary active transporters. In mammalian cells, ABC transporters mediate the unidirectional efflux of solutes across biological membranes.
Secondary Active Transport. In secondary active transport, the transport across a biological membrane of 1 solute S1 against its concentration gradient is energetically driven by the transport of another solute S2 in accordance with its concentration gradient. For example, an inwardly directed Na+ concentration gradient across the plasma membrane is created by Na+, K+-ATPase. Under these conditions, inward movement of Na+ produces the energy to drive the movement of a substrate S1 against its concentration gradient by a secondary active transporter, as in Na+/Ca2+ exchange. Depending on the transport direction of the solute, secondary active transporters are classified as either symporters or antiporters. Symporters, also termed cotransporters, transport S2 and S1 in the same direction, whereas antiporters, also termed exchangers, move their substrates in opposite directions (see Figure 5–4).
KINETICS OF TRANSPORT
The flux of a substrate (rate of transport) across a biological membrane via transporter-mediated processes is characterized by saturability. The relationship between the flux v and substrate concentration C in a transporter-mediated process is given by the Michaelis-Menten equation:
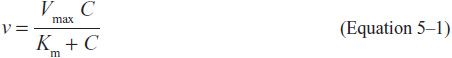
where Vmax is the maximum transport rate and is proportional to the density of transporters on the plasma membrane, and Km is the Michaelis constant, which represents the substrate concentration at which the flux is half the Vmax value. Km is an approximation of the dissociation constant of the substrate from the intermediate complex.
The Km and Vmax values can be determined by examining the flux at different substrate concentrations. The Eadie-Hofstee plot provides a graphical method for determining the Vmax and Km values (Figure 5–5).
Figure 5–5 Eadie-Hofstee plot of transport data. The black lines show the hyperbolic concentration-dependence curve (ν vs C, left panel) and the Eadie-Hofstee transformation of the transport data (ν/C vs ν, right panel) for a simple transport system. The blue lines depict transport in the presence of a competitive inhibitor (surmountable inhibition; achieves same Vmax). The red lines depict the system in the presence of a noncompetitive inhibitor that reduces the number of transporting sites by half but leaves the Km of the functional sites unchanged. Involvement of multiple transporters with different Km values gives an Eadie-Hofstee plot that is curved. Algebraically, the Eadie-Hofstee plot of kinetic data is equivalent to the Scatchard plot of equilibrium binding data.
Transporter-mediated membrane transport of a substrate is also characterized by inhibition by other compounds. The manner of inhibition can be categorized as 1 of 3 types: competitive, noncompetitive, and uncompetitive. Competitive
Stay updated, free articles. Join our Telegram channel

Full access? Get Clinical Tree


