concentrations were reversed by infusion of intravenous emulsions containing C18:2n-6. Holman et al (1) in 1982 reported the first example of deficiency symptoms attributed to C18:3n-3 deficiency in a 6- year-old girl maintained parenterally for 5 months on a safflower oil-based emulsion rich in C18:2n-6. Neuringer et al (2) in 1984 demonstrated C18:3n-3 deficiency in the offspring of Rhesus monkeys who showed a loss in visual activity. C18:3n-3 deficiency was also described in patients who had received 0.02% to 0.09% of calories as n-3 FAs via gastric tube feeding over a period of 2.5 to 12 years (3). The scaly dermatitis and depressed concentrations of n-3 FAs in plasma and erythrocytes of the patients were alleviated with supplementation of C18:3n-3.
TABLE 4.1 NAMES AND CODES OF FATTY ACIDS | ||||||||||||||||||||||||||||||||||||||||||||||||||||||||||||||||||||||||||||||||||||
|---|---|---|---|---|---|---|---|---|---|---|---|---|---|---|---|---|---|---|---|---|---|---|---|---|---|---|---|---|---|---|---|---|---|---|---|---|---|---|---|---|---|---|---|---|---|---|---|---|---|---|---|---|---|---|---|---|---|---|---|---|---|---|---|---|---|---|---|---|---|---|---|---|---|---|---|---|---|---|---|---|---|---|---|---|
|
As dietary TGs vary widely in FA composition, so does FA consumption (Table 4.2). Large differences exist in the FA composition of oils from both plant and animal sources, largely because of genetic and environmental factors. In the case of animal fats, the composition of the feed also influences the final FA composition. As noted later, these factors influence the FA composition of tissues.
TABLE 4.2 AVERAGE TRIGLYCERIDE FATTY ACID COMPOSITION OF IMPORTANT EDIBLE FATSa | ||||||||||||||||||||||||||||||||||||||||||||||||||||||||||||||||||||||||||||||||||||||||||||||||||||||||||||||||||||||||||||||||||||||||||||||||||||||||||||||||||||||||||||||||||||||||||||||||||||||||||||||||||||||||||||||||||||||||||||||||||||||||||||||||||||||||||||||||||||||||||||||||||
|---|---|---|---|---|---|---|---|---|---|---|---|---|---|---|---|---|---|---|---|---|---|---|---|---|---|---|---|---|---|---|---|---|---|---|---|---|---|---|---|---|---|---|---|---|---|---|---|---|---|---|---|---|---|---|---|---|---|---|---|---|---|---|---|---|---|---|---|---|---|---|---|---|---|---|---|---|---|---|---|---|---|---|---|---|---|---|---|---|---|---|---|---|---|---|---|---|---|---|---|---|---|---|---|---|---|---|---|---|---|---|---|---|---|---|---|---|---|---|---|---|---|---|---|---|---|---|---|---|---|---|---|---|---|---|---|---|---|---|---|---|---|---|---|---|---|---|---|---|---|---|---|---|---|---|---|---|---|---|---|---|---|---|---|---|---|---|---|---|---|---|---|---|---|---|---|---|---|---|---|---|---|---|---|---|---|---|---|---|---|---|---|---|---|---|---|---|---|---|---|---|---|---|---|---|---|---|---|---|---|---|---|---|---|---|---|---|---|---|---|---|---|---|---|---|---|---|---|---|---|---|---|---|---|---|---|---|---|---|---|---|---|---|---|---|---|---|---|---|---|---|---|---|---|---|---|---|---|---|---|---|---|---|---|---|---|---|---|---|---|---|---|---|---|---|---|---|---|---|---|---|---|---|---|---|---|---|---|---|---|---|
| ||||||||||||||||||||||||||||||||||||||||||||||||||||||||||||||||||||||||||||||||||||||||||||||||||||||||||||||||||||||||||||||||||||||||||||||||||||||||||||||||||||||||||||||||||||||||||||||||||||||||||||||||||||||||||||||||||||||||||||||||||||||||||||||||||||||||||||||||||||||||||||||||||
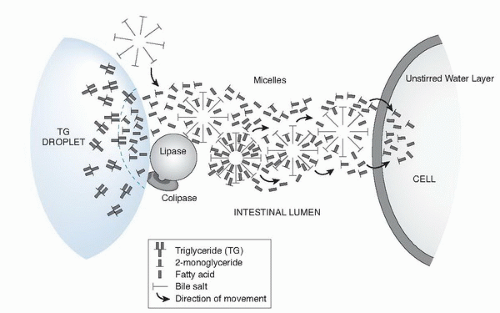
 Fig. 4.2. Transport hypothesis of fatty acids and 2-monoglycerides through lipase-mediated hydrolysis, micellar transfer, and cellular uptake stages. |
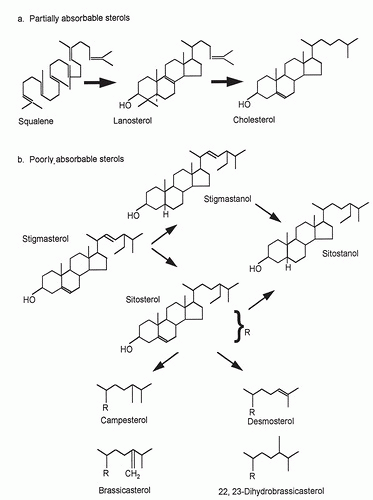
changes in CH absorption and biosynthesis serve to protect circulatory CH levels from shifting greatly in response to changes in dietary intake (29). In contrast to CH, plant sterol absorption is very limited and differs across dietary phytosterols. For the major plant sterol β-sitosterol, typical absorption efficiency is 4% to 5%, approximately one tenth that of CH. Absorption efficiency is higher for campesterol; approximately 10%, and almost nonexistent for sitostanol (30, 31). This structure-specific discrimination depends on both the number of carbon atoms at the C24 side-chain position and the degree of hydrogenation of the sterol nucleus. Differences in absorption across phytosterols are reflected in their circulating concentrations. Plasma campesterol levels are usually higher than those of sitosterol, whereas highly saturated sitostanol is almost undetectable (14).
TABLE 4.3 PHYSICAL-CHEMICAL CHARACTERISTICS OF THE MAJOR LIPOPROTEIN CLASSES | ||||||||||||||||||||||||||||||||||||||||||||||||||||||||||||||||||
|---|---|---|---|---|---|---|---|---|---|---|---|---|---|---|---|---|---|---|---|---|---|---|---|---|---|---|---|---|---|---|---|---|---|---|---|---|---|---|---|---|---|---|---|---|---|---|---|---|---|---|---|---|---|---|---|---|---|---|---|---|---|---|---|---|---|---|
| ||||||||||||||||||||||||||||||||||||||||||||||||||||||||||||||||||
Stay updated, free articles. Join our Telegram channel

Full access? Get Clinical Tree


