CHAPTER 19 Integrated Control of the Cardiovascular System
REGULATION OF CARDIAC OUTPUT AND BLOOD PRESSURE
Four factors control cardiac output: heart rate, myocardial contractility, preload, and afterload (Fig. 19-1). Heart rate and myocardial contractility are strictly cardiac factors, although they are controlled by various neural and humoral mechanisms. Preload and afterload are factors that are mutually dependent on function of the heart and the vasculature and are important determinants of cardiac output. Preload and afterload are themselves determined by cardiac output and by certain vascular characteristics. Preload and afterload will be called coupling factors because they constitute a functional coupling between the heart and blood vessels. To understand regulation of cardiac output, the nature of the coupling between the heart and the vascular system must be appreciated.
In this chapter, two kinds of graphs are used to analyze interactions between the cardiac and vascular components of the circulatory system. The first curve is called the cardiac function curve. It is an expression of the well-known Frank-Starling relationship and it illustrates the dependence of cardiac output on preload (i.e., central venous, or right atrial, pressure). The cardiac function curve is a characteristic of the heart itself and is usually studied in hearts completely isolated from the rest of the circulation. This curve has already been discussed in detail in Chapters 16 and 17. We use this curve later in this chapter in association with the other characteristic curve to analyze interactions between the heart and the vasculature.
VASCULAR FUNCTION CURVE
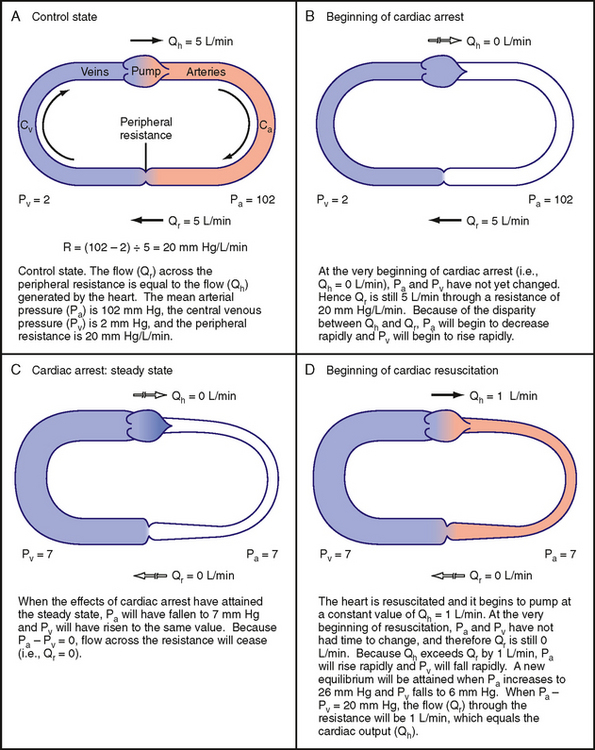
The simplified model of the circulation shown in Figure 19-2 helps explain how cardiac output determines the level of central venous pressure. In this model, all essential components of the cardiovascular system have been lumped into four basic elements. The right and left sides of the heart, as well as the pulmonary vascular bed, constitute a pumpoxygenator, much like an artificial heart-lung machine used to perfuse the body during open-heart surgery. The high-resistance microcirculation is designated the peripheral resistance. Finally, the compliance of the system is subdivided into arterial compliance (Ca) and venous compliance (Cv). As defined in Chapter 17, the compliance (C) of a blood vessel is the change in volume (ΔV) that is accommodated in that vessel per unit change in transmural pressure (ΔP); that is,
Venous compliance is about 20 times greater than arterial compliance. In our example, the ratio of Cv to Ca is set at 19 : 1 to simplify calculations.*
To show how a change in cardiac output causes an inverse change in central venous pressure, our hypothetical model will have certain characteristics that mimic those of an average adult person (Fig. 19-2, A). The flow (Qh) generated by the heart (i.e., cardiac output) will be 5 L/min; mean arterial pressure, Pa, will be 102 mm Hg; and central venous pressure, Pv, will be 2 mm Hg. Peripheral resistance, R, is the ratio of the arteriovenous pressure difference (Pa − Pv) to flow (Qr) through the resistance vessels; this ratio will equal 20 mm Hg/L/min.
An arteriovenous pressure difference of 100 mm Hg is sufficient to force a flow (Qr) of 5 L/min through a peripheral resistance of 20 mm Hg/L/min (Fig. 19-2, A). Under equilibrium conditions, this flow (Qr) is precisely equal to the flow (Qh) pumped by the heart. From heartbeat to heartbeat, the volume (Va) of blood in the arteries and the volume (Vv) of blood in the veins remain constant because the volume of blood transferred from the veins to the arteries by the heart equals the volume of blood that flows from the arteries through the resistance vessels and into the veins.
Effects of Cardiac Arrest on Arterial and Venous Pressure
Figure 19-2, B, shows the circulation at the very beginning of an episode of cardiac arrest; that is, Qh = 0. In the instant immediately after arrest of the heart, the volume of blood in the arteries (Va) and veins (Vv) has not had time to change appreciably. Because arterial pressure and venous pressure depend on Va and Vv, respectively, these pressures are identical to the respective pressures in Figure 19-2, A (i.e., Pa = 102 and Pv = 2). This arteriovenous pressure gradient of 100 mm Hg forces a flow (Qr) of 5 L/min through the peripheral resistance of 20 mm Hg/L/min. Thus, although cardiac output (Qh) now equals 0 L/min, flow through the microcirculation equals 5 L/min because the potential energy stored in the arteries by the preceding pumping action of the heart causes blood to be transferred from arteries to veins. This transfer occurs initially at the control rate, even though the heart can no longer transfer blood from the veins to the arteries.
As the heart continues in arrest, blood flow through the resistance vessels causes the blood volume in the arteries to decrease progressively and the blood volume in the veins to increase progressively at the same absolute rate. Because the arteries and veins are elastic structures, arterial pressure falls gradually and the venous pressure rises gradually. This process continues until arterial and venous pressures become equal (Fig. 19-2, C). Once this condition is reached, flow (Qr) from the arteries to the veins through the resistance vessels is zero, as is Qh.
When the effects of cardiac arrest reach this equilibrium state (Fig. 19-2, C), the pressure attained in the arteries and veins depends on the relative compliance of these vessels. If arterial compliance (Ca) and venous compliance (Cv) are equal, the decline in Pa would equal the rise in Pv because the decrease in arterial volume would equal the increase in venous volume (principle of conservation of mass). Both Pa and Pv would attain the average of their combined values in Figure 19-2, A; that is, Pa = Pv = (102 + 2)/2 = 52 mm Hg. However, Ca and Cv in a living subject are not equal. Veins are much more compliant than arteries; the compliance ratio (Cv/Ca) is approximately 19, the ratio that we have assumed for the model. When the effects of cardiac arrest reach equilibrium in an intact subject, the pressure in the arteries and veins is much less than the average value of 52 mm Hg that occurs when Ca and Cv are equal. Hence, transfer of blood from arteries to veins at equilibrium induces a fall in arterial pressure 19 times greater than the concomitant rise in venous pressure. As Figure 19-2, C, shows, Pv would increase by 5 mm Hg (to 7 mm Hg), whereas Pa would fall by 19 × 5 = 95 mm Hg (to 7 mm Hg). This equilibrium pressure, which prevails in the absence of flow, is referred to as either mean circulatory pressure or static pressure. The pressure in the static system reflects the total blood volume in the system and the overall compliance of the system.
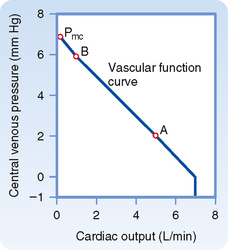
The example of cardiac arrest aids our understanding of the vascular function curve. One can now begin to assemble a vascular function curve (Fig. 19-3). The independent variable (plotted along the x axis) is cardiac output, and the dependent variable (plotted along the y axis) is central venous pressure. Two important points on this curve can be derived from the example in Figure 19-2. One point (A in Fig. 19-3) represents the control state; that is, when cardiac output is 5 L/min, Pv is 2 mm Hg (as depicted in Fig. 19-2, A). Then, when the heart is arrested (cardiac output = 0), Pv becomes 7 mm Hg at equilibrium (Fig. 19-2, C); this pressure is the mean circulatory pressure (Pmc in Fig. 19-3).
Now let us suddenly increase cardiac output. This example will illustrate how a third point (B in Fig. 19-3) on the vascular function curve is derived. Consider that the arrested heart is suddenly restarted and immediately begins pumping blood from the veins into the arteries at a rate of 1 L/min (Fig. 19-2, D). When the heart first begins to beat, the arteriovenous pressure gradient is zero, and no blood is transferred from the arteries through the capillaries and into the veins. Thus, when beating resumes, blood is depleted from the veins at the rate of 1 L/min, and arterial blood volume is repleted from venous blood volume at that same absolute rate. Hence, Pv begins to fall and Pa begins to rise. Because of the difference in arterial and venous compliance, Pa will rise at a rate 19 times faster than the rate at which Pv will fall.
The resultant arteriovenous pressure gradient causes blood to flow through the peripheral resistance. If the heart maintains a constant output of 1 L/min, Pa will continue to rise and Pv will continue to fall until the pressure gradient becomes 20 mm Hg. This gradient will force a flow of 1 L/min through a resistance of 20 mm Hg/L/min. This gradient will be achieved by a 19–mm Hg rise (to 26 mm Hg) in Pa and a 1–mm Hg fall (to 6 mm Hg) in Pv. This equilibrium value of Pv = 6 mm Hg for a cardiac output of 1 L/min also appears on the vascular function curve of Figure 19-3 (point B). The 1–mm Hg reduction in Pv reflects a net transfer of blood from the venous to the arterial side of the circuit.
The reduction in Pv that can be evoked by a sudden increase in cardiac output is limited. At some critical maximal value of cardiac output, sufficient fluid will be transferred from the venous to the arterial side of the circuit for Pv to fall below ambient pressure. In a system of very distensible vessels, such as the venous system, the vessels will be collapsed by the greater external pressure (see Chapter 17). This venous collapse impedes venous return to the heart. Hence, it limits the maximal value of cardiac output to 7 L/min in this example (Fig. 19-3), regardless of the capabilities of the pump.
Factors That Influence the Vascular Function Curve
Blood Volume
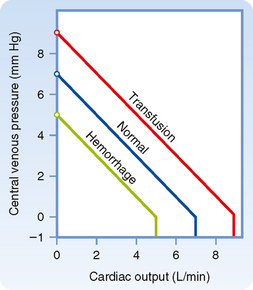
The vascular function curve is affected by variations in total blood volume. During circulatory standstill (zero cardiac output), mean circulatory pressure depends only on total vascular compliance and blood volume. For a given vascular compliance, mean circulatory pressure is increased when blood volume is expanded (hypervolemia) and is decreased when blood volume is diminished (hypovolemia). This relationship is illustrated by the y axis intercepts in Figure 19-4, where mean circulatory pressure is 5 mm Hg after hemorrhage and 9 mm Hg after transfusion, as compared with a value of 7 mm Hg at normal blood volume (normovolemia or euvolemia).
From Figure 19-4 it is also apparent that the cardiac output at which Pv = 0 varies directly with blood volume. Therefore, the maximal value of cardiac output becomes progressively more limited as the total blood volume is reduced. However, the central venous pressure at which the veins collapse (illustrated by the sharp change in slope of the vascular function curve) is not significantly altered by changes in blood volume. This pressure depends only on the ambient pressure surrounding the central veins. Ambient pressure is the pleural pressure in the thorax (see Chapter 21).
Venomotor Tone
The effects of changes in venomotor tone on the vascular function curve closely resemble those for changes in blood volume. In Figure 19-4, for example, the transfusion curve could also represent increased venomotor tone, whereas the hemorrhage curve could represent decreased tone. During circulatory standstill, for a given blood volume the pressure within the vascular system will rise as smooth muscle tension exerted within the vascular walls increases (these contractile changes in arteriolar and venous smooth muscle are under nervous and humoral control). The fraction of the blood volume located within the arterioles is very small, whereas the blood volume in the veins is large (see Table 15-1). Thus, changes in peripheral resistance (arteriolar tone) have no significant effect on mean circulatory pressure, but changes in venous tone can alter mean circulatory pressure appreciably. Hence, mean circulatory pressure rises with increased venomotor tone and falls with diminished venomotor tone.
Peripheral Resistance
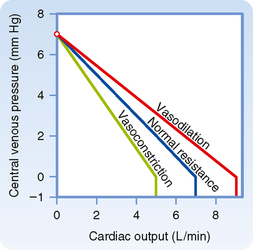
The changes in the vascular function curve induced by alterations in arteriolar tone are shown in Figure 19-5. The amount of blood in the arterioles is small—they contain only about 3% of total blood volume (see Chapter 15). Changes in the contractile state of arterioles do not significantly alter mean circulatory pressure. Thus, vascular function curves that represent different peripheral resistances converge at a common point on the abscissa.
Pv varies inversely with total peripheral resistance (TPR) when all other factors remain constant. Physiologically, the relationship between Pv and TPR can be explained as follows: if cardiac output is held constant, a sudden increase in TPR causes a progressively greater volume of blood to be retained in the arterial system. Blood volume in the arterial system continues to increase until Pa rises sufficiently to force a flow of blood equal to cardiac output through the resistance vessels. If total blood volume does not change, this increase in arterial blood volume is accompanied by an equivalent decrease in venous blood volume. Hence, an increase in TPR diminishes Pv proportionately. This relationship between TPR and Pv, together with the inability of peripheral resistance to affect mean circulatory pressure, accounts for the clockwise rotation of the vascular function curves in response to increased arteriolar constriction (see Fig. 19-5). Similarly, arteriolar dilation produces a counterclockwise rotation from the same vertical axis intercept. A higher maximal level of cardiac output is attainable when the arterioles are dilated than when they are constricted (Fig. 19-5).
RELATING THE CARDIAC FUNCTION CURVE TO THE VASCULAR FUNCTION CURVE
Coupling between the Heart and the Vasculature
A typical cardiac function curve is plotted on the same coordinates as a normal vascular function curve in Figure 19-6. The cardiac function curve is plotted according to the usual convention; that is, the independent variable (Pv) is plotted along the abscissa, and the dependent variable (cardiac output) is plotted along the ordinate. From the Frank-Starling mechanism, the cardiac function curve reveals that a rise in Pv increases cardiac output.
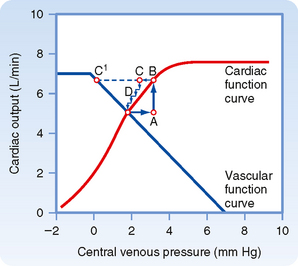
Figure 19-6 Typical vascular and cardiac function curves plotted on the same coordinate axes. Note that to plot both curves on the same graph, the x and y axes for the vascular function curves had to be reversed; compare the assignment of axes with that in Figures 19-3, 19-4, and 19-5. The coordinates of the equilibrium point, at the intersection of the cardiac and vascular function curves, represent the stable values of cardiac output and central venous pressure at which the system tends to operate. Any perturbation (e.g., a sudden increase in venous pressure to point A) institutes a sequence of changes in cardiac output and venous pressure that restore these variables to their equilibrium values.
To plot the cardiac and vascular function curves on the same set of axes requires a modification of the plotting convention for one of these curves. We arbitrarily violate the convention for the vascular function curve. Note that the vascular function curve in Figure 19-6 is intended to reflect how Pv (scaled along the x axis) varies in response to a change in cardiac output (scaled along the y axis).
The tendency to operate about this equilibrium point may best be illustrated by examining the response to a sudden change. Consider the changes caused by a sudden rise in Pv from the equilibrium point to point A in Figure 19-6. This change in Pv might be caused by the rapid injection, during ventricular diastole, of a given volume of blood on the venous side of the circuit and simultaneous withdrawal of an equal volume from the arterial side of the circuit. Thus, although Pv rises, total blood volume remains constant.
As defined by the cardiac function curve, this elevated Pv would increase cardiac output (from A to B) during the next ventricular systole. The increased cardiac output would then transfer a net quantity of blood from the venous to the arterial side of the circuit, with a consequent reduction in Pv. In one heartbeat the reduction in Pv would be small (from B to C) because the heart would transfer only a fraction of the total venous blood volume to the arterial side. As a result of this reduction in Pv, cardiac output during the very next beat diminishes (from C to D) by an amount dictated by the cardiac function curve. Because D is still above the intersection point, the heart will pump blood from the veins to the arteries at a rate greater than that at which blood will flow across the peripheral resistance from arteries to veins. Hence, Pv will continue to fall. This process will continue in diminishing steps until the point of intersection is reached. Only one specific combination of cardiac output and venous pressure—the equilibrium point, denoted by the coordinates of the point at which the curves intersect—will simultaneously satisfy the requirements of the cardiac and vascular function curves. Stable operation of the system at the equilibrium point (A, in Fig. 19-6) indicates that cardiac output equals venous return.
Myocardial Contractility
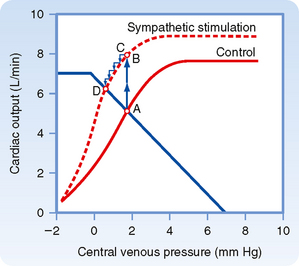
Combinations of cardiac and vascular function curves also help explain the effects of alterations in ventricular contractility on cardiac output and Pv. In Figure 19-7, the lower cardiac function curve represents the control state, whereas the upper curve reflects the influence of increased myocardial contractility. This pair of curves is analogous to the “family” of ventricular function curves shown in Figure 18-12. The enhanced ventricular contractility represented by the upper curve in Figure 19-7 can be produced by electrical stimulation of the cardiac sympathetic nerves. When the effects of such neural stimulation are restricted to the heart, the vascular function curve is unaffected. Therefore, only one vascular function curve is needed for this hypothetical intervention (Fig. 19-7).
During the control state of the model, the equilibrium values for cardiac output and Pv are designated by point A in Figure 19-7. Cardiac sympathetic nerve stimulation abruptly raises cardiac output to point B because of the enhanced myocardial contractility. However, this high cardiac output increases the net transfer of blood from the venous to the arterial side of the circuit, and consequently, Pv subsequently begins to fall (to point C). The reduction in Pv then leads to a small decrease in cardiac output. However, cardiac output is still sufficiently high to effect the net transfer of blood from the venous to the arterial side of the circuit. Thus, Pv and cardiac output both continue to fall gradually until a new equilibrium point (D) is reached. This equilibrium point is located at the intersection of the vascular function curve and the new cardiac function curve. Point D lies above and to the left of the control equilibrium point (A) and indicates that sympathetic stimulation can evoke greater cardiac output despite the lower level of Pv.
The biological response to enhancement of myocardial contractility is mimicked by the hypothetical change predicted by our model. As depicted in Figure 19-8, sympathetic nerves innervating the heart are stimulated during the time denoted by the two arrows. During neural stimulation, cardiac output (aortic flow) rose quickly to a peak value and then fell gradually to a steady-state value significantly greater than the control level. The increased aortic flow was accompanied by reductions in right and left atrial pressure (PRA and PLA).
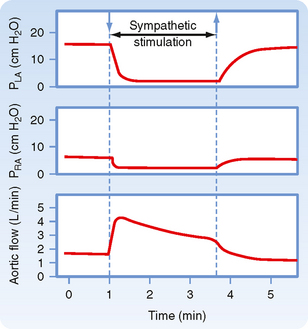
Figure 19-8 During electrical stimulation of the cardiac sympathetic nerve fibers, aortic blood flow (cardiac output) increased while pressure in the left atrium (PLA) and right atrium (PRA) diminished. These data conform to the conclusions derived from Figure 19-7, in which the equilibrium values of cardiac output and venous pressure are observed to shift from point A to point D (i.e., cardiac output increased, but central venous pressure decreased) during cardiac sympathetic nerve stimulation.
(Redrawn from Sarnoff SJ et al: Circ Res 8:1108, 1960.)
Blood Volume
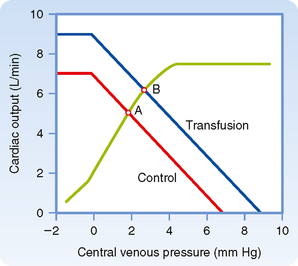
Changes in blood volume do not directly affect myocardial contractility, but they do influence the vascular function curve in the manner shown in Figure 19-4. Thus, to understand how changes in blood volume affect cardiac output and Pv, the appropriate cardiac function curve is plotted along with the vascular function curves that represent the control and experimental states (Fig. 19-9).
When blood volume is increased by a blood transfusion, the equilibrium point (B), which denotes the values of cardiac output and Pv after transfusion, lies above and to the right of the control equilibrium point (A). Thus, transfusion increases both cardiac output and Pv. Hemorrhage causes the opposite effect. Mechanistically, the change in ventricular filling pressure (central venous pressure) evoked by a given change in blood volume alters cardiac output by changing the sensitivity of the contractile proteins to the prevailing concentration of intracellular Ca++ (see Chapters 17 and 18). For reasons explained earlier, pure increases or decreases in venomotor tone elicit responses that are like those evoked by increases or decreases, respectively, in total blood volume.
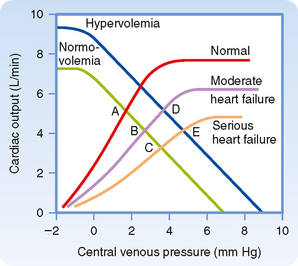
Heart failure is a general term that applies to conditions in which the pumping capability of the heart is impaired to the extent that the tissues of the body are not adequately perfused. In heart failure, myocardial contractility is impaired. Heart failure may be acute or chronic. Consequently, in a graph of cardiac and vascular function curves, the cardiac function curve is shifted downward and to the right, as depicted in Figure 19-10.
Acute heart failure may be caused by toxic concentrations of drugs or by certain pathological conditions such as coronary artery occlusion. In acute heart failure, blood volume does not change immediately. In Figure 19-10, therefore, the equilibrium point shifts from the intersection (A) of the normal curves to the intersection (B or C) of the normal vascular function curve with one of the curves that depict depressed cardiac function.
Chronic heart failure may occur in conditions such as essential hypertension or ischemic heart disease. In chronic heart failure, both the cardiac function and vascular function curves shift. The vascular function curve shifts because of an increase in blood volume caused in part by fluid retention by the kidneys. The fluid retention is related to the concomitant reduction in glomerular filtration rate and the decreased renal excretion of NaCl and water (see also Chapter 34). The resultant hypervolemia is reflected by a rightward shift of the vascular function curve, as shown in Figure 19-10. Hence, with moderate degrees of heart failure, Pv is elevated, but cardiac output may be normal (D). With more severe degrees of heart failure, Pv is still greater, but cardiac output is subnormal (E).
Peripheral Resistance
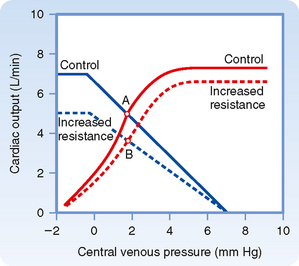
Analysis of the effects of changes in peripheral resistance on cardiac output and Pv is complex because both the cardiac and vascular function curves shift. When peripheral resistance increases (Fig. 19-11), the vascular function curve is rotated counterclockwise, but it converges on the same Pv axis intercept as the control curve does. Note that vasoconstriction causes a counterclockwise rotation of the vascular function curve in Figure 19-11 but a clockwise rotation in Figure 19-5. The direction of rotation differs because the axes for the vascular function curves were reversed in these two figures, as explained earlier. The cardiac function curve in Figure 19-11 is also shifted downward because at any given Pv, the heart is able to pump less blood against the greater cardiac afterload imposed by the increased peripheral resistance. Because both curves in Figure 19-11 are displaced downward, the new equilibrium point, B, falls below the control point, A; that is, an increase in peripheral resistance diminishes cardiac output.
Stay updated, free articles. Join our Telegram channel

Full access? Get Clinical Tree


