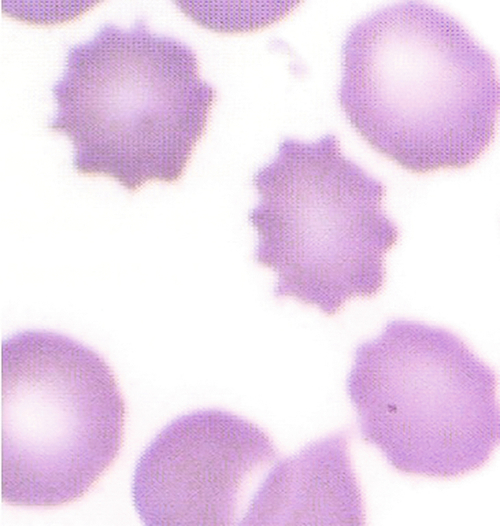
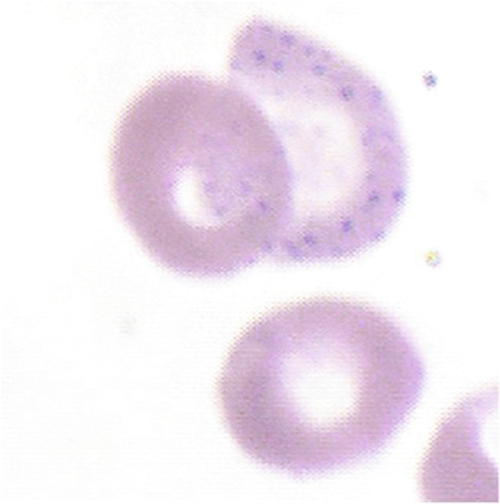
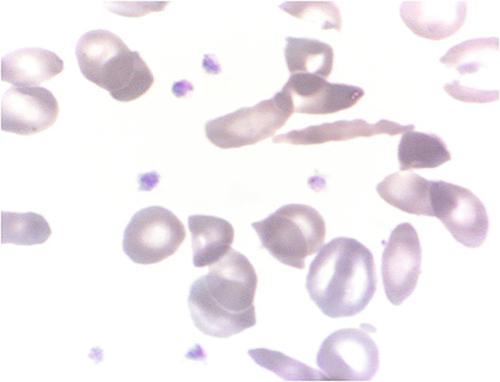
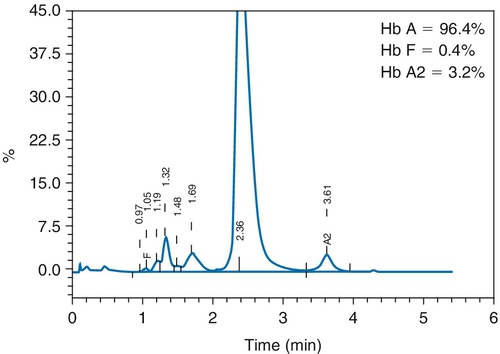
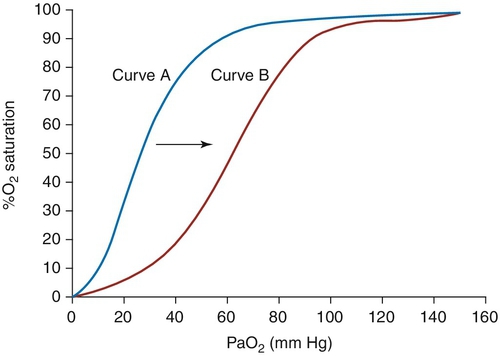
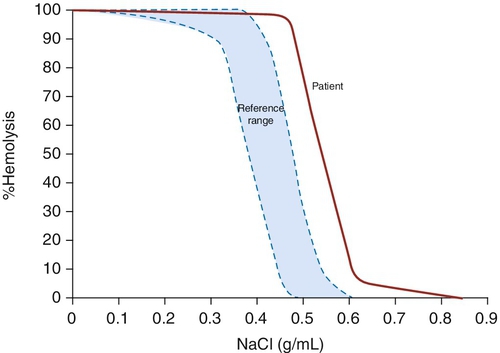
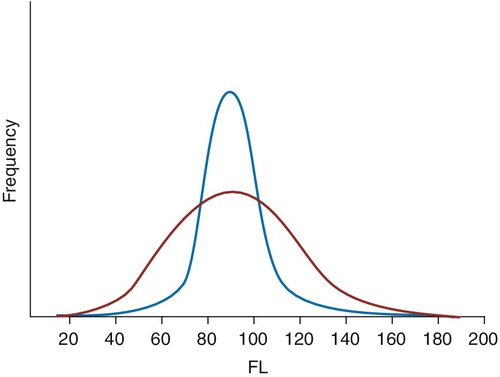
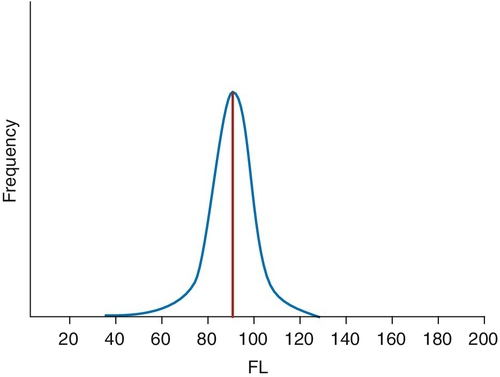
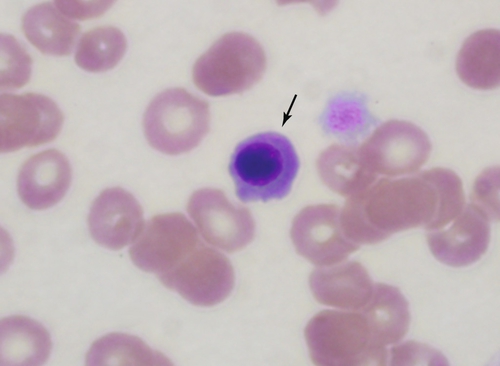
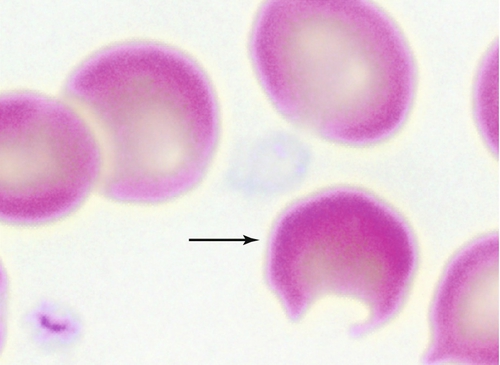
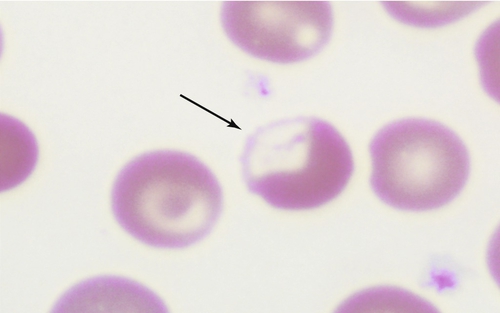
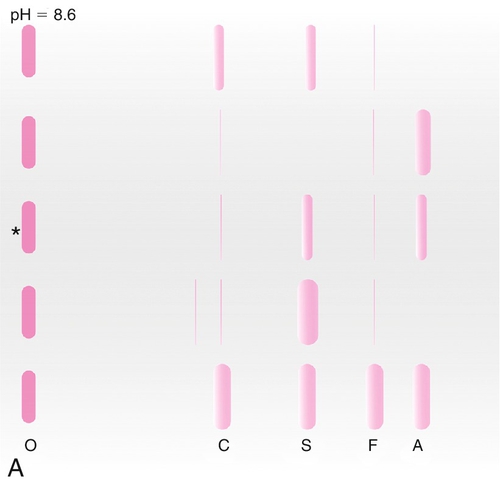
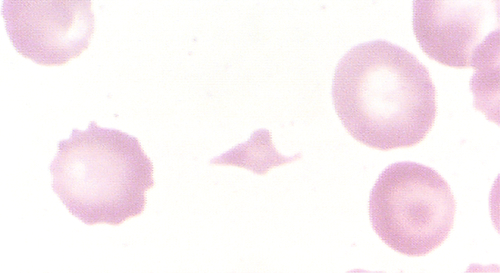
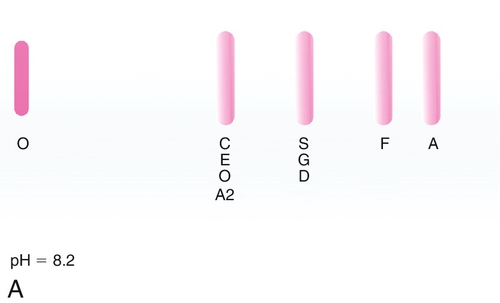
Chapter 10 Jeffrey S. Jhang; Alexander Kratz; Patrice F. Spitalnik Questions 1. An example of the findings on a blood smear is shown in Figure 10-1. Which one of the following is the most likely explanation? B. Delay between blood draw and preparation of the blood smear. C. Hemoglobin C disease. D. Status postsplenectomy. E. Iron deficiency. 2. As part of an anemia workup, you review the hemoglobinopathy evaluation of a 4-year-old boy. Electrophoresis indicates no evidence of a structural hemoglobinopathy, and the levels of hemoglobin A2 and F are within normal limits. The mean corpuscular volume (MCV) is normal. A representative example of the findings on the blood smear is shown in Figure 10-2. Which one of the following is the best interpretation of these findings? B. Anemia secondary to chronic renal failure. C. Hemoglobinopathy not detected by electrophoresis. D. Lead intoxication. E. Liver disease. 3. A 25-year-old African-American woman is admitted to the hospital because of respiratory failure. She complains of pain in her back, thighs, and knees. Figure 10-3 shows a representative view of her blood smear. Which one of the following is the most likely diagnosis? B. Homozygous hemoglobin S. C. Lead poisoning. D. Thrombotic thrombocytopenic purpura. E. Hereditary elliptocytosis. 4. A 29-year-old man presents to his physician for partner screening. The complete blood cell count (CBC) and ferritin level are shown in Table 10-1. Figure 10-4 shows the hemoglobin fractions identified on high-performance liquid chromatography (HPLC). Which one of the following is the most likely diagnosis? B. β-Thalassemia trait. C. δβ-Thalassemia trait. D. Hemoglobin E trait. E. Hemoglobin Lepore. 5. A 23-year-old pregnant woman at 12 weeks’ gestation presents to her obstetrician for prenatal screening. A CBC and a ferritin level are shown in Table 10-2. Figure 10-5 shows hemoglobin fractionation by HPLC. Which one of the following is the most likely diagnosis? B. β-Thalassemia trait. C. δβ-Thalassemia trait. D. Hemoglobin E trait. E. Hemoglobin Constant Spring. 6. A 23-year-old woman who is 12 weeks pregnant presents to her obstetrician for prenatal screening. A CBC and a ferritin level are shown in Table 10-3. Figure 10-6 shows hemoglobin fractionation by HPLC. Which one of the following is the most likely diagnosis? B. β-Thalassemia trait. C. δβ-Thalassemia trait. D. Hemoglobin E trait. E. Hemoglobin Constant Spring. 7. Which one of the following is the preferred anticoagulant for a CBC specimen? B. Hirudin. C. K2EDTA (dipotassium ethylenediaminetetra-acetic acid). D. K3EDTA (tripotassium ethylenediaminetetraacetic acid). E. Sodium heparin. 8. A 27-year-old Thai man with no significant medical history presents to a genetic counselor for partner testing. Which one of the following diagnoses is most consistent with the complete cell blood count in Table 10-4 and HPLC chromatogram (Figure 10-7)? B. Hemoglobin C trait. C. Hemoglobin D–Los Angeles. D. Hemoglobin E trait. E. Hemoglobin S trait. A 69-year-old Vietnamese man with a past medical history of fatigue presented to his primary care physician with a painful, swollen joint and was found after a routine CBC to have anemia. Hemoglobin electrophoresis is shown in Figure 10-8, and the CBC is shown in Table 10-5. Use this scenario to answer the following three questions. 9a. Which one of the following is the most likely diagnosis? B. Hemoglobin H disease. C. Hemoglobin Barts. D. Hemoglobin N–Baltimore trait. E. Hemoglobin J trait. 9b. Which one of the following hemoglobins represents the hemoglobin at the arrowhead shown in Figure 10-8? B. β4. C. γ4. D. ζ2ɛ2. E. α2ɛ2. 9c. Which one of the following clinical syndromes is associated with deletion of four α-globin genes? B. α-Thalassemia retardation syndrome. C. α-Thalassemia myelodysplasia syndrome. D. Cooley’s anemia. E. Hemolytic disease of the fetus and newborn (HDFN). 10. Which one of the following conditions shifts the hemoglobin oxygenation curve to the right in Figure 10-9? B. Acidosis. C. Decreased 2,3-diphosphoglycerate (DPG). D. CO2 release by hemoglobin. E. High-affinity hemoglobin. 11. Which one of the following disorders is associated with the osmotic fragility test shown in Figure 10-10? B. Hereditary pyropoikylocytosis. C. β-Thalassemia trait. D. α-Thalassemia trait. E. Sickle cell anemia. 12. Which one of the following peripheral blood smear findings would correspond to the abnormality seen on the patient’s red cell histogram depicted by the solid red line in Figure 10-11? B. Hypochromia. C. Macrocytosis. D. Microcytosis, iron deficiency. E. Microcytosis, β-thalassemia trait. 13. Which one of the following is represented by the value corresponding to the red line in Figure 10-12? A. Red blood cell count (RBC). B. Hematocrit (HCT). C. Mean corpuscular volume (MCV). D. Mean corpuscular hemoglobin (MCH). E. Red cell distribution width (RDW). 14. Which one of the following is represented by the value of the area under the curve in Figure 10-13? B. HCT. C. MCV. D. MCH. E. RDW. 15. Which one of the following is represented by the value corresponding to the distance between the arrowheads in Figure 10-14? B. HCT. C. MCV. D. MCH. E. RDW. 16. Which one of the following can be falsely decreased on an automated hematology analyzer by the finding shown in Figure 10-15? B. MCV. C. MCH. D. RBC. E. RDW. 17. Which one of the following disorders is most compatible with a normal zinc protoporphyrin (ZPP) level? B. Anemia of chronic disease. C. Iron deficiency anemia. D. Lead poisoning. E. Sideroblastic anemia. 18a. Which one of the following spectrophotometer wavelengths does the cyanmethemoglobin colorimetric method use for measuring hemoglobin concentration? B. 340 nm. C. 450 nm. D. 540 nm. E. 1100 nm. 18b. Which one of the following is an advantage of the cyanmethemoglobin colorimetric method for determination of hemoglobin concentration? A. Measures all forms of hemoglobin. B. Reagents are very stable. C. Reagents are nontoxic. D. Method is not affected by lipemia. E. Completion of the reaction in 1 minute. 19. Which one of the following disorders is associated with the osmotic fragility test shown in Figure 10-16? A. Hereditary spherocytosis (HS). B. Hereditary pyropoikilocytosis. C. Hereditary elliptocytosis. D. α-Thalassemia trait. E. Warm autoimmune hemolytic anemia. 20. Which one of the following most likely explains the findings shown by the red curve on the red cell histogram in Figure 10-17? B. End-stage liver disease. C. Pseudothrombocytopenia. D. Treated B12 deficiency. E. Treated iron deficiency anemia. A 21-year-old woman with no past medical history sees her physician with complaints of fatigue and palpitations. Physical examination reveals conjunctival pallor. A CBC shows hemoglobin = 9 g/dL (12.0 to 15.8 g/dL), MCV = 73 fL (79.0 to 93.3 fL), and reticulocyte count = 1.3% (0.8% to 2.0%). Use this scenario to answer the following four questions. 21a. Which one of the following best characterizes this anemia? A. Normocytic, hyperproliferative anemia. B. Microcytic, hypoproliferative anemia. C. Macrocytic, hypoproliferative anemia. D. Microcytic, hyperproliferative anemia. 21b. The mean corpuscular hemoglobin concentration (MCHC) is 33.3 g/dL (32.2 to 35.9 g/dL), and the RDW is 17% (< 14.5%). Which one of the following is the most informative diagnostic test the clinician could order? B. B12 and folate levels. C. Serum iron and ferritin. D. Bone marrow biopsy. 21c. The woman is treated appropriately, and her anemia resolves. On her follow-up visit a year later, she has a normal CBC. At that visit, it is discovered she is pregnant, and she gives birth 8 months later. Her labor was complicated by a massive obstetric hemorrhage requiring pressors and a brief stay in the intensive care unit. She survived and on a follow-up outpatient visit was found to have the following CBC parameters: hemoglobin = 9 g/dL (12.0 to 15.8 g/dL) and MCV = 103 fL (79.0 to 93.3 fL) consistent with a macrocytic anemia. A smear shows normal white cell morphology and macroovalocytes. Which one of the following tests would be the best test to order next? B. B12 and folate. C. Bone marrow biopsy. D. Thyroid-stimulating hormone (TSH) and free thyroxine (fT4). 21d. In a patient with pituitary failure after obstetric hemorrhage, which one of the following patterns would the thyroid function tests typically show? B. High TSH, low fT4. C. High TSH, high fT4. D. Low TSH, high fT4. 22. A 23-year-old African-American woman is seen by her obstetrician for a routine prenatal visit. A CBC was performed and is shown in Table 10-6. Results of hemoglobin electrophoresis are shown in Figure 10-18. The sickle solubility test result was negative. Which one of the following is the best diagnosis based on these results? A. No hemoglobin variant or thalassemia. B. α-Chain variant. C. β-Chain variant. D. Unstable hemoglobin variant. E. Sickling hemoglobin variant. 23. A previously healthy 50-year-old man is seen at the dermatology office for removal of a mole on his left forearm. The dermatologist applied benzocaine topical anesthetic and then performed the procedure without complications. Before leaving the office, the patient complained of a headache and became progressively more confused and short of breath. The physician observed cyanotic lips and bluish tongue. The patient was transferred to the emergency department where the cyanosis did not respond to treatment with oxygen 15 L/min by nonrebreather mask. Co-oximetry showed a methemoglobin of 26% (reference range, < 1%), and he was diagnosed with acquired methemoglobinemia. Which one of the following would be the best initial treatment for this patient? B. Crystal violet. C. Gastric lavage. D. Methylene blue. E. Red cell exchange. 24. A microhematocrit was run in duplicate on a K2EDTA anticoagulated whole blood sample as shown in Figure 10-19. The packed cell volume, when run in duplicate, was 30% in both capillary tubes. Which one of the following factors can lead to a falsely low packed cell volume (PCV) determined by the microhematocrit method? A. Decreased time for centrifugation. B. β-Thalassemia trait. C. Sickle cell disease. D. Increased erythrocyte sedimentation rate. E. Decreased centrifugal force. 25. A 55-year-old woman with long-standing untreated rheumatoid arthritis is complaining of fatigue and found to have a normochromic, normocytic anemia. Figure 10-20 represents a Prussian blue iron stain of her spleen, suggesting accumulation of iron in red pulp macrophages. Which one of the following pairs best relates the expected serum hepcidin level with the patient’s most likely type of anemia? A. Iron deficiency anemia; low serum hepcidin levels. B. Iron deficiency anemia; high serum hepcidin levels. C. Megaloblastic anemia; high serum hepcidin levels. D. Anemia of chronic disease; low serum hepcidin levels. E. Anemia of chronic disease; high serum hepcidin levels. 26. A 54-year-old man with ulcerative colitis was recently being tapered off steroids. While traveling to New Haven, Conn., to drop his son off at college, he developed worsening of his abdominal pain and diarrhea. When he returned home, his physician increased his dose of prednisone to 40 mg per day. Five days later, the patient developed severe fatigue, dizziness, and shortness of breath. A CBC sample was sent to the laboratory. The peripheral blood film is shown in Figure 10-21. Which one of the following is the most likely cause of his symptoms? B. Borrelia burgdorferi. C. Leishmania donovani. D. Toxoplasma gondii. E. Trypanosoma cruzi. 27. An asymptomatic 48-year-old patient was screened for HFE gene mutations after a sibling was discovered to have a homozygous mutation in this gene (C282Y/C282Y). The patient’s ferritin level is currently 2200 ng/mL (12 to 300 ng/mL), and there is no evidence of inflammation (e.g., C-reactive protein levels within normal range). If serum hepcidin levels were measured, which one of the following choices is most correct for the expected hepcidin level? A. Low hepcidin level as seen in nutritional iron deficiency. B. High hepcidin level as seen in transfusion-induced iron overload. C. Normal hepcidin level as seen in an iron-replete male. D. Low hepcidin level as seen in transfusion-induced iron overload. E. High hepcidin level as seen in nutritional iron deficiency. 28. A 9-year-old boy comes into the emergency department complaining of headache, abdominal pain, and joint pain. His mother states that he has sickle cell disease. He has never had a transfusion in the past. The CBC is shown in Table 10-7, and the peripheral blood smear is shown in Figure 10-22. Based on these tests, which one of the following is the most likely disorder? B. Sickle cell disease. C. Hemoglobin SC disease. D. β-Thalassemia trait. E. α-Thalassemia trait. 29. You are asked to review a peripheral blood smear showing 60% acanthocytes. Which one of the following conditions is associated with more than 10% acanthocytosis? A. Autoimmune hemolytic anemia. B. McLeod blood group phenotype. C. Microangiopathic hemolytic anemia. D. Sickle cell disease. E. Uremia. 30. Which one of the following porphyrias is not associated with photosensitivity? A. Acute intermittent porphyria. B. Hereditary coproporphyria. C. Erythropoietic protoporphyria. D. Congenital erythropoietic porphyria. E. Porphyria cutanea tarda. 31. Which one of the following statements about automated counting of reticulocytes is true? A. Automated methods to count reticulocytes often involve digital image analysis. B. Automated methods to count reticulocytes require specialized equipment dedicated to this assay only. C. Automated reticulocyte counts frequently require confirmation by manual slide review. D. Automated reticulocyte counts are more accurate and precise than manual counts. E. Automated reticulocyte counts are based on measurements of the size of reticulocytes compared with the size of mature red cells. 32a. The red cell in Figure 10-23 is most consistent with which one of the following? B. Babesiosis. C. Sideroblastic granules (Pappenheimer bodies). D. Basophilic stippling. E. Howell-Jolly bodies. 32b. Basophilic stippling is most frequently observed in which one of the following? B. Malaria. C. Babesiosis. D. Thalassemias. E. Iron deficiency. 33a. The red cells in Figure 10-24 are most consistent with which one of the following? B. Teardrop cells. C. Schistocytes. D. Acanthocytes. E. Burr cells (echinocytes). 33b. In which one of the following pathologic states are Burr cells most frequently seen? B. Abnormalities of lipid metabolism. C. Infections. D. Hereditary abnormalities of red cell metabolism. E. Myelodysplastic syndrome. 33c. A medical student calls the laboratory and asks for the preparation of a slide from a CBC sample obtained 36 hours ago. Review of the blood smear shows a large number of Burr cells (echinocytes). A basic metabolic profile from a sample obtained at the same time as the CBC sample and analyzed within 4 hours of phlebotomy showed normal results. Which one of the following is the best explanation for these results? B. The basic metabolic panel results are most likely wrong because Burr cells indicate the presence of uremia. C. The Burr cells may be caused by an abnormality in the patient’s lipid metabolism. D. The Burr cells may be caused by a malignant process. E. The Burr cells may be caused by an infection. 34a. A K2EDTA anticoagulated whole blood sample is sent to the laboratory for a CBC. A manual differential is performed because of an instrument flag. Which one of the following cells is indicated by the arrow in Figure 10-25? B. Atypical lymphocyte. C. Giant platelet. D. Nucleated red cell. E. Plasma cell. 34b. The patient’s white blood cell count (WBC) is 4.5 × 10⁹/L (reference range 3.04-9.06), and the laboratory technologist reports 10 of the cells indicated by the arrow in Figure 10-25 for every 100 WBCs. Which one of the following is the correct WBC after correction for the cells indicated by the arrow? B. 4.1 C. 4.5 D. 4.6 E. 5.0 35. A 17-year-old boy with erythropoietic protoporphyria (EPP) has photosensitivity and acute abdominal pain. He has fulminant liver failure and is awaiting liver transplantation. Which one of the following enzymes is deficient in this patient? A. Aminolevulinic acid (ALA) synthetase. B. Coproporphyrinogen oxidase. C. Ferrochelatase. D. Uroporphyrinogen III cosynthetase. E. Uroporphyrinogen decarboxylase. 36. Which one of the following disorders is associated with the cell indicated by the arrow in Figure 10-26? A. Glucose-6-phosphate dehydrogenase deficiency. B. Hereditary pyropoikilocytosis. C. Hereditary spherocytosis. D. Splenectomy. 37. Which one of the following mechanisms produces the cell indicated by the arrow in Figure 10-27? B. Heavy metal poisoning. C. Oxidative damage. D. Spectrin gene mutation. E. Splenectomy. 38. Which one of the following is associated with an elevated hemoglobin A2 level? B. Antiretroviral therapy. C. (δβ)0-Thalassemia trait. D. Hypothyroidism. E. Sideroblastic anemia. 39. Hemoglobin Barts is a result of the formation of which one of the following hemoglobin tetramers? B. β4. C. γ4. D. δ4. E. ζ4. 40. Which one of the following promoters controls the transcription of the hemoglobin Lepore gene? B. γ-Globin. C. δ-Globin. D. β-Globin. E. ɛ-Globin. 41. An 18-year-old male student athlete undergoes hemoglobinopathy screening before playing football in his first year of college. He is found to have sickle cell trait. In which one of the following settings can this patient experience sickle cell formation leading to vascular occlusion? B. Renal medullary carcinoma. C. Severe hypothermia. D. Travel to New York City in autumn. E. Vigorous exercise. 42. A 34-year-old pregnant African American woman is seen in her obstetrician’s office and undergoes hemoglobinopathy screening. The alkaline and acid hemoglobin electrophoreses are shown in Figure 10-28, A and B, respectively. The sickle solubility test is positive. Which one of the following would be most characteristic of the CBC? B. Low hemoglobin (HGB) concentration. C. Low RBC. D. High MCH. E. Normal RDW. 43. You are asked to review a peripheral blood smear from a 19-year-old woman with sickle cell disease (homozygous hemoglobin S). An RBC inclusion is identified and is shown in Figure 10-29. The inclusion is composed of which one of the following constituents? B. Denatured hemoglobin H. C. DNA. D. Iron. E. RNA. 44. The inclusion in the red cell in Figure 10-30 is most consistent with which one of the following? B. Cabot’s ring. C. Howell-Jolly body. D. Basophilic stippling. E. Pappenheimer body. 45. Which one of the following individuals would be expected to have the lowest MCV? B. 32-year-old pregnant woman with sickle cell trait. C. 18-year-old man with sickle cell disease on hydroxyurea therapy. D. 6-month-old, healthy boy. E. 2-year-old boy with Fanconi’s anemia. 46. Which one of the following statements about manual counting of reticulocytes is true? B. Manual counting of reticulocytes is performed by counting 100 red cells. C. Manual counting of reticulocytes is highly reproducible. D. Manual counting is the only method available to quantify reticulocytes; no alternative methods are available. E. In most laboratories, manual counting of reticulocytes has been replaced by automated cell counters. 47. Which one of the following is the best method for the diagnosis of paroxysmal nocturnal hemoglobinuria (PNH)? A. A careful review of the blood smear. B. The sucrose lysis test. C. The acidified serum test (Ham’s test). D. Flow cytometry. E. Genetic testing. 48. The acidified serum test (Ham’s test) can be characterized as which one of the following? A. Gold standard for the definitive diagnosis of PNH. B. Requires highly specialized equipment. C. Requires mixing of treated patient and control blood to prove that the patient’s hemolysis is caused by an increased susceptibility of his red cells to activated complement. D. Absence of lysis of the patient’s red cells by his acidified serum excludes the diagnosis of PNH. E. Requires the mixing of patient blood and sucrose to prove that the patient’s hemolysis is caused by an increased susceptibility of his red cells to activated complement. 49. Which one of the following statements about the sucrose lysis test is true? A. Allows a definite diagnosis of PNH. B. Must be carried out with a sample of whole blood anticoagulated with EDTA. C. Is a screening test for PNH. D. Requires expensive laboratory instrumentation. E. Is based on the lysis of white cells by complement in patients with PNH. 50. The rapid determination of a patient’s hemoglobin level is important in surgical and intensive care settings. Which one of the following is the most commonly used method in handheld devices for point-of-care (POC) hemoglobin measurement? B. Flow cytometry–based method. C. Conductivity-based method. D. Centrifugation. E. Light-absorption–based method. 51. Which one of the following is a cause of polycythemia? A. Decreased 2,3-diphosphoglycerate (2,3-DPG or 2,3-BPG). B. Cobalamin poisoning. C. Familial decrease in erythropoietin synthesis. D. Low-affinity hemoglobin. E. After renal transplantation. 52. Which one of the following is the most common inherited enzyme deficiency of the glycolytic pathway? B. Glucose-6-phophate isomerase. C. Hexokinase. D. Phosphofructokinase. E. Pyruvate kinase. 53. A qualitative, colorimetric glucose-6-phosphate dehydrogenase (G6PD) activity assay is performed on two samples. The sample on the right side of Figure 10-31 is from a G6PD-deficient patient after 40 minutes of incubation, which suggests G6PD deficiency. The sample on the left is from another patient after 40 minutes of incubation. According to the qualitative test, the patient does not have G6PD deficiency. However, the patient undergoes further testing using a quantitative assay and is found to be G6PD deficient. Which one of the following circumstances can account for this false-negative result? B. Heterozygous woman. C. Hypergammaglobulinemia. D. Reticulocytopenia. E. Sickle cell trait. 54. Which one of the following disorders is most consistent with the red cell cytogram shown in Figure 10-32, B? B. Congenital dyserythropoietic anemia. C. Iron deficiency anemia. D. Megaloblastic anemia. E. Sickle cell disease. 55. A 92-year-old man with a history of diabetes, hypertension, and atrial fibrillation (not anticoagulated) and a recent diagnosis of chronic lymphocytic leukemia presents to the emergency department with complaints of one week of fatigue, shortness of breath, and dizziness. His laboratory evaluation shows that he has a warm autoimmune hemolytic anemia. The CBC is shown in Table 10-8. Which one of the following is the reticulocyte index (RI)? B. 0.38 C. 0.75 D. 2.70 E. 5.30 56. Which one of the following staining methods is recommended as the comparability method (i.e., gold standard) for enumerating reticulocytes? B. Ethidium bromide. C. Monoclonal antibodies (anti-CD71). D. New methylene blue (NMB). E. Thiazole orange. 57a. The red cell in the center of Figure 10-33 is most consistent with which one of the following? B. Acanthocyte. C. Stomatocyte. D. Teardrop cell. E. Schistocyte. 57b. Schistocytes are found in which one of the following? A. Abnormalities of lipid metabolism. B. On blood smears prepared over 36 hours after phlebotomy. C. In blood smears from uremic patients. D. In blood smears from patients with lead poisoning. E. In blood smears from patients with microangiopathic hemolytic anemias. 58. Cellulose acetate electrophoresis (Figure 10-34) performed at pH 8.2 is a method used to separate which one of the following pairs of hemoglobins? A. Hemoglobins S and G-Philadelphia. B. Hemoglobins S and D-Punjab. C. Hemoglobins C and E. D. Hemoglobins C and A2. E. Hemoglobins O-Arab and D-Punjab. 59. Which one of the following disorders is associated with the cell indicated by the arrow in Figure 10-35? A. Hemoglobin C disease (homozygous hemoglobin C). B. Hemoglobin SD disease (double heterozygous hemoglobin S and hemoglobin D). C. Hereditary elliptocytosis. D. Plasmodium falciparum. E. Microangiopathic hemolytic anemia.
Hematology
Red Blood Cells

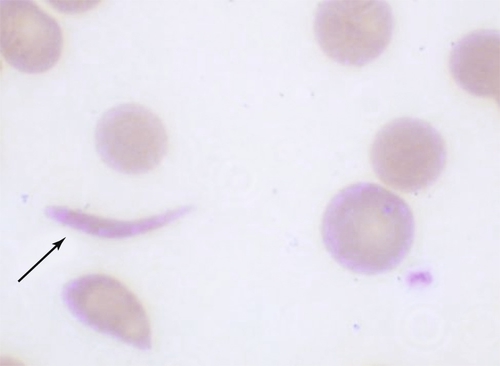
![]()
Stay updated, free articles. Join our Telegram channel

Full access? Get Clinical Tree


Hematology: Red Blood Cells
Figure 10-1 Blood smear showing Burr cells.
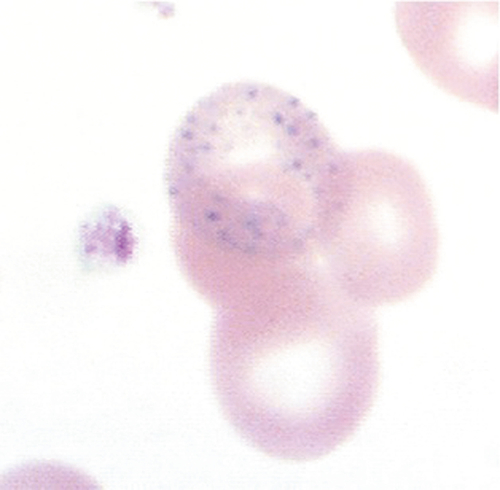
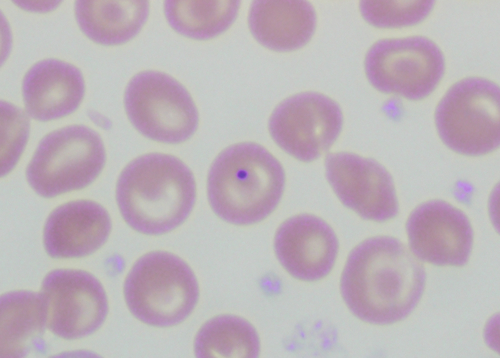
Figure 10-2 A red cell with basophilic stippling.
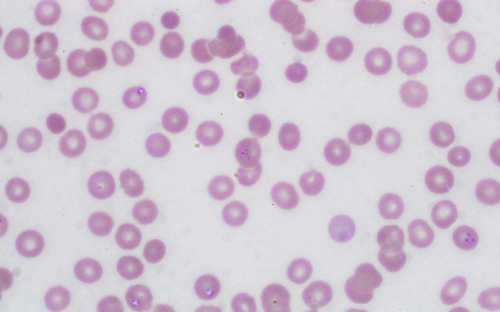
Figure 10-3 Blood smear from a patient.
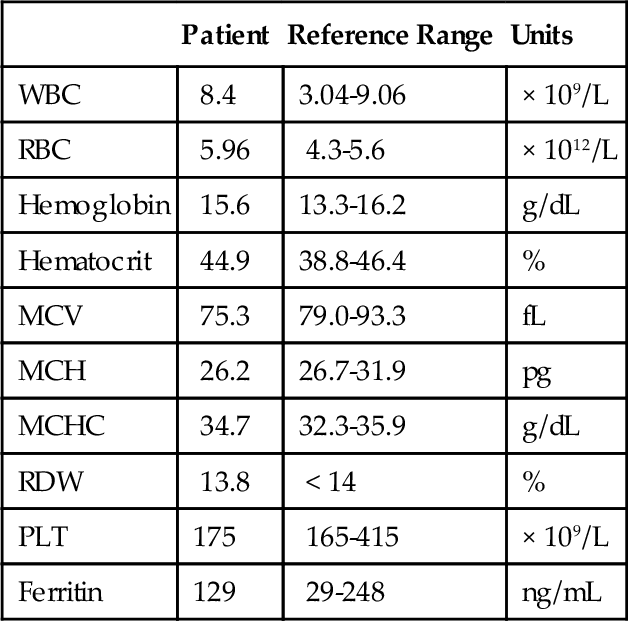
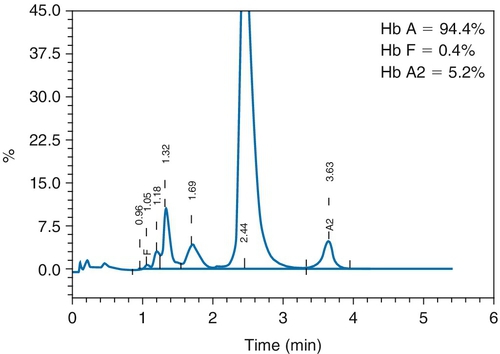
Figure 10-4 Hemoglobin fractionation by HPLC (fraction percentages shown at upper right).
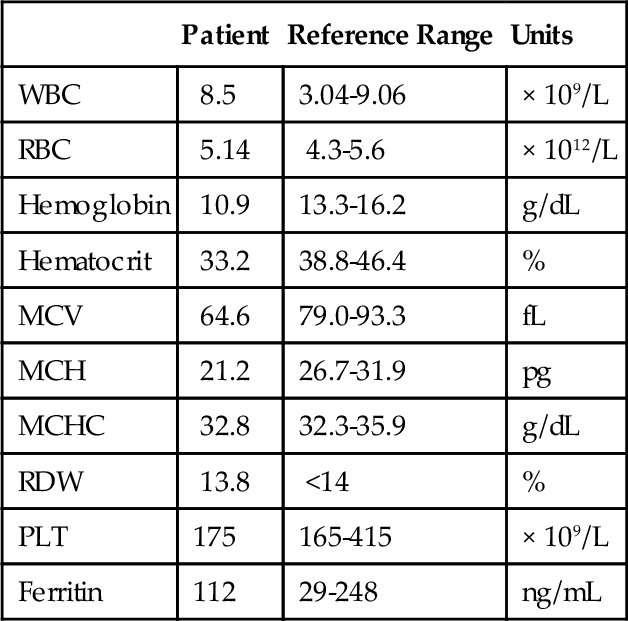
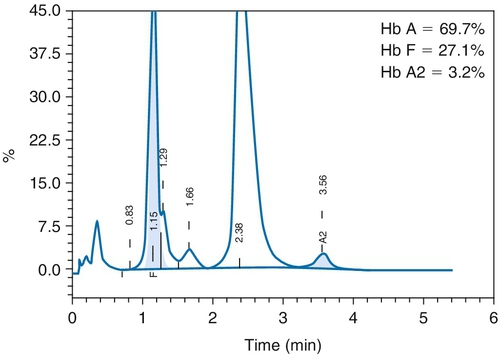
Figure 10-5 Hemoglobin fractionation by HPLC (hemoglobin percentages shown at upper right).
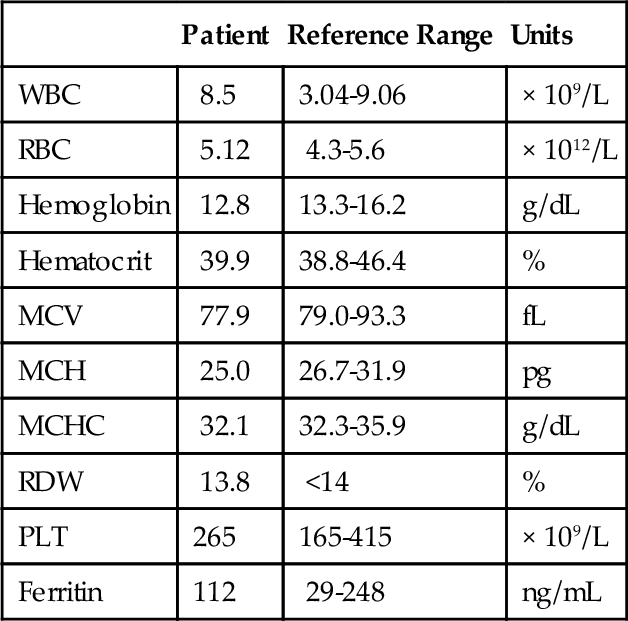
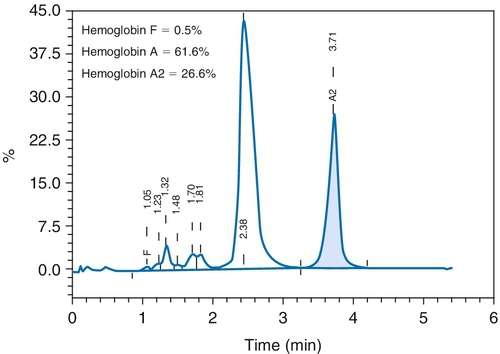
Figure 10-6 Hemoglobin fractionation by HPLC (relative hemoglobin percentages shown at upper right).
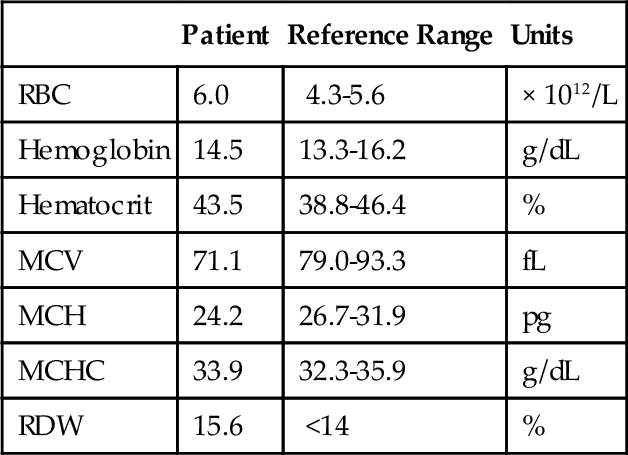
Figure 10-7 HPLC for hemoglobin fractionation (hemoglobin percentages on y-axis and retention time on x-axis).
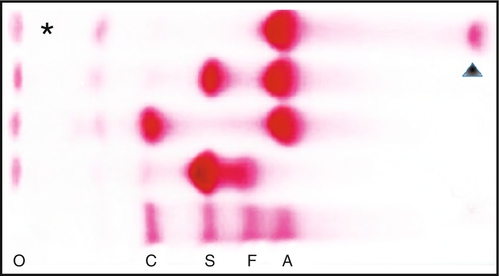
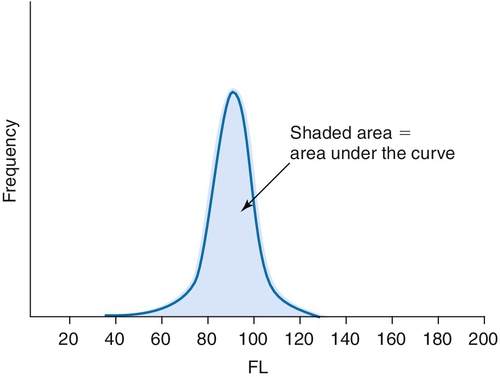
Figure 10-8 Hemoglobin electrophoresis at pH = 8.2. The origin (O) and hemoglobin controls (hemoglobins A, F, S, and C) are shown. The asterisk marks the lane for this patient.
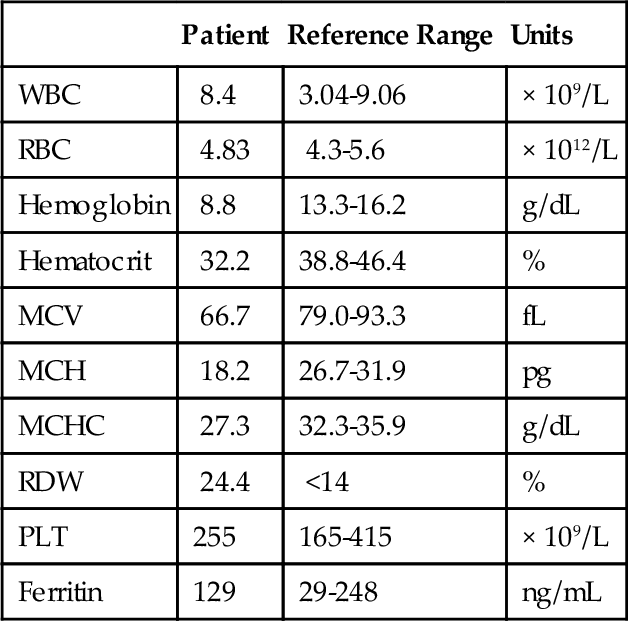
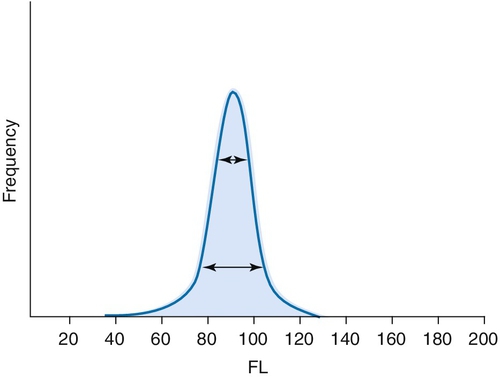
Figure 10-9 Oxygen dissociation curve (ODC). Partial pressure of oxygen is plotted on the x-axis, and the percent hemoglobin saturation is plotted on the y-axis. Curve A represents the ODC under normal physiologic conditions. Curve B represents the curve under conditions that shift it to the right.
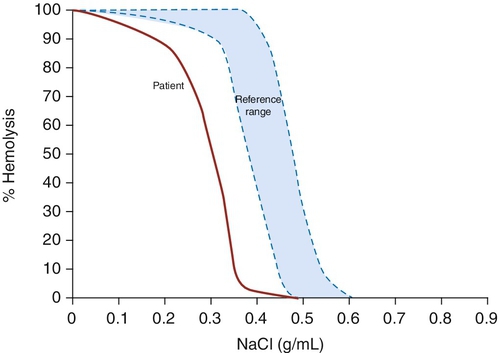
Figure 10-10 Immediate osmotic fragility test. The y-axis shows percent hemolysis with changes in concentration of sodium chloride on the x-axis (0 to 0.85% normal saline).
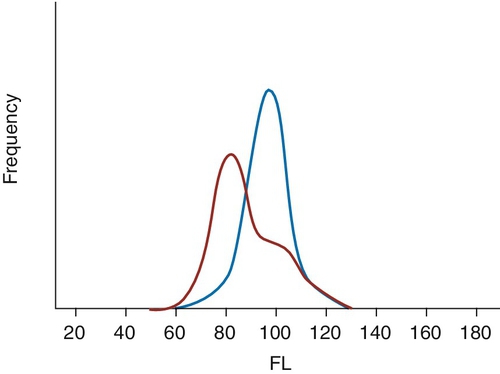
Figure 10-11 A normal red cell histogram (frequency distribution curve) is depicted by the blue curve with the number of cells counted on the y-axis and the size of the red cells in femtoliters (FL) on the x-axis. The red curve depicts the histogram.
Figure 10-12 A red cell histogram generated by an automated hematology analyzer shows the number of red cells on the y-axis and the size of the red cells on the x-axis in femtoliters (FL).
Figure 10-13 A red cell histogram generated by an automated hematology analyser shows the number of red cells on the y-axis and the size of the red cells on the x-axis in femtoliters (FL).
Figure 10-14 A red cell histogram generated by an automated hematology analyzer shows the number of red cells on the y-axis and the size of the red cells on the x-axis in femtoliters (FL).
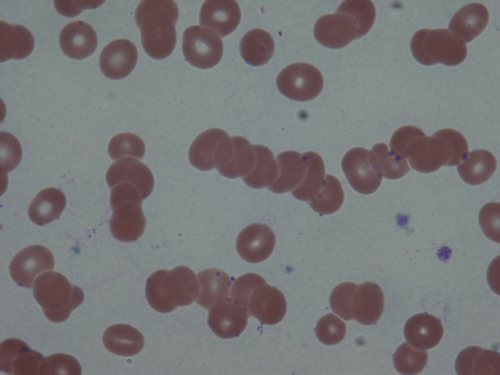
Figure 10-15 Wright-Giemsa–stained peripheral blood smear (× 100).
Figure 10-16 Immediate osmotic fragility test. The y-axis shows percent hemolysis with increasing concentration of sodium chloride (0 to 0.85% normal saline).
Figure 10-17 The size distribution of red cells is depicted in the figure by the red cell histogram. The number of cells is plotted on the y-axis and the size of the cells on the x-axis. The blue curve is a reference for a normal histogram. The red curve represents the curve referenced in Question 20.
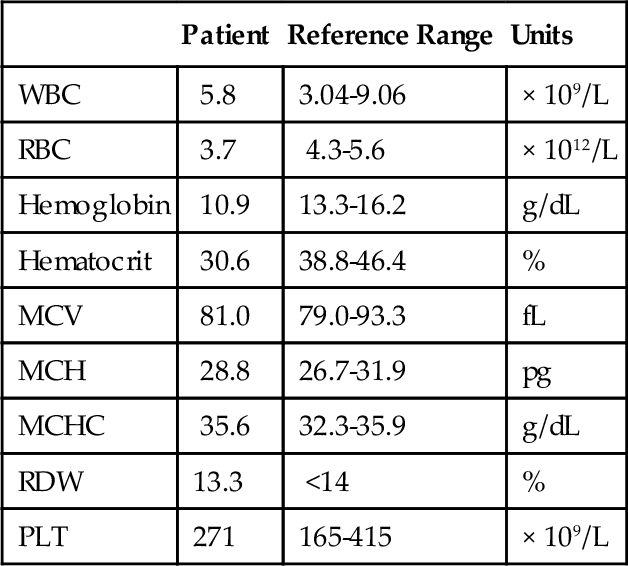
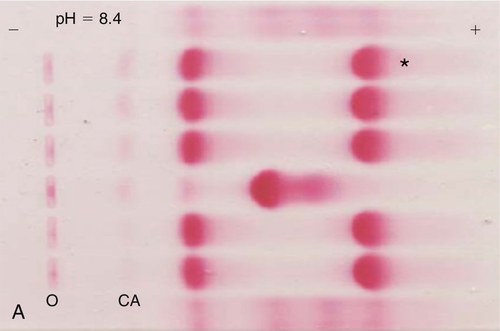
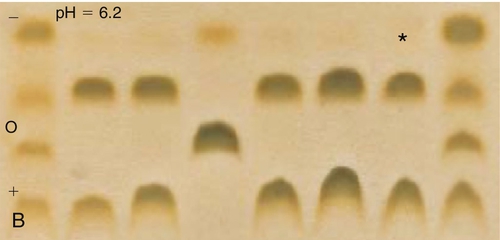
Figure 10-18 A, Alkaline hemoglobin electrophoresis. B, Acid hemoglobin electrophoresis. The asterisk indicates the lane with the patient sample. O, origin; CA, carbonic anhydrase.
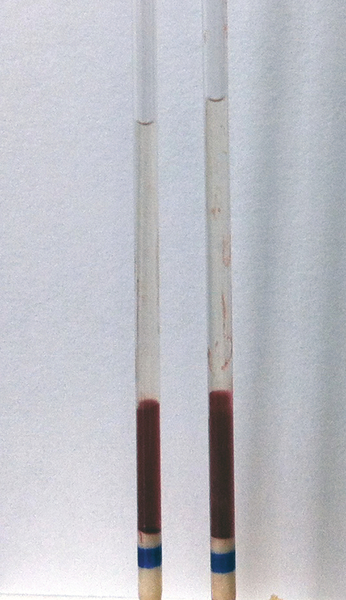
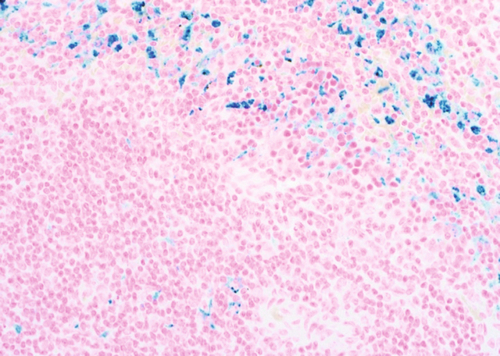
Figure 10-19 Microhematocrit capillary tubes from a whole blood sample run in duplicate (hematocrit, 30%).
Figure 10-20 Prussian blue stain of paraffin-embedded spleen cells.
Figure 10-21 Wright-Giemsa–stained peripheral blood smear (× 100).
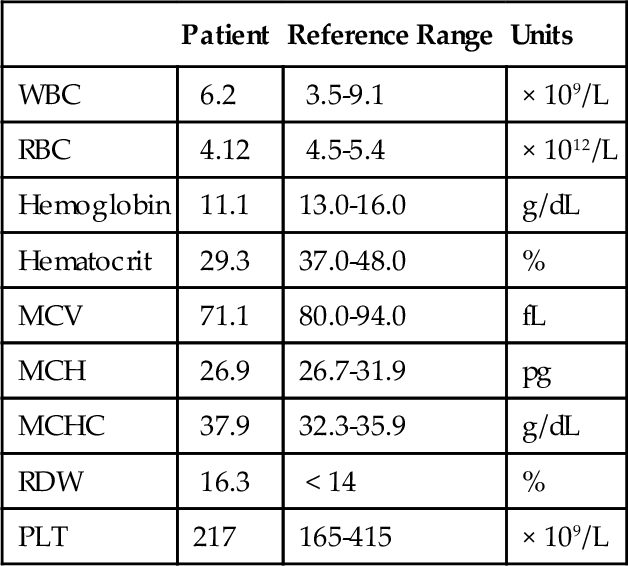
Figure 10-22 Wright-Giemsa–stained peripheral blood smear (× 100).
Figure 10-23 Wright-Giemsa–stained peripheral blood smear (× 100).
Figure 10-24 Wright-Giemsa–stained peripheral blood smear (× 100).
Figure 10-25 Wright-Giemsa–stained peripheral blood smear (× 100).
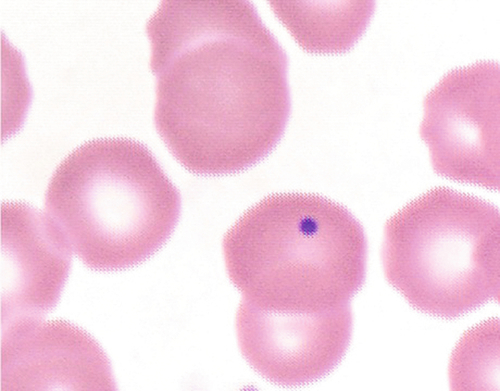
Figure 10-26 Wright-Giemsa–stained peripheral blood smear (× 100).
Figure 10-27 Wright-Giemsa–stained peripheral blood smear (× 100).
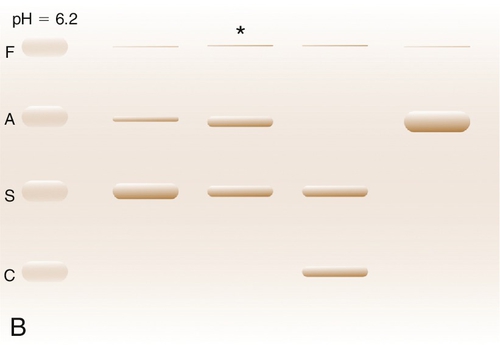
Figure 10-28 A, Cellulose acetate electrophoresis (pH = 8.6). B, Citrate agar electrophoresis (pH = 6.2). The origin (O) and hemoglobin controls (hemoglobins A, F, S, and C) are shown. The asterisk marks the lane for this patient.
Figure 10-29 Wright-Giemsa–stained peripheral blood smear (× 100).
Figure 10-30 Wright-Giemsa–stained peripheral blood smear (× 100).
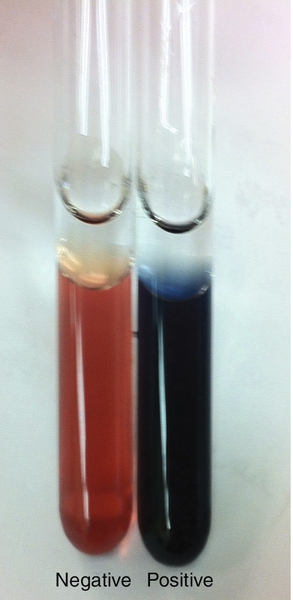
Figure 10-31 The tests tubes show a qualitative, colorimetric glucose-6-phosphate dehydrogenase (G6PD) activity assay. A false-negative test is shown on the left, and a G6PD-deficient patient sample is shown on the right.
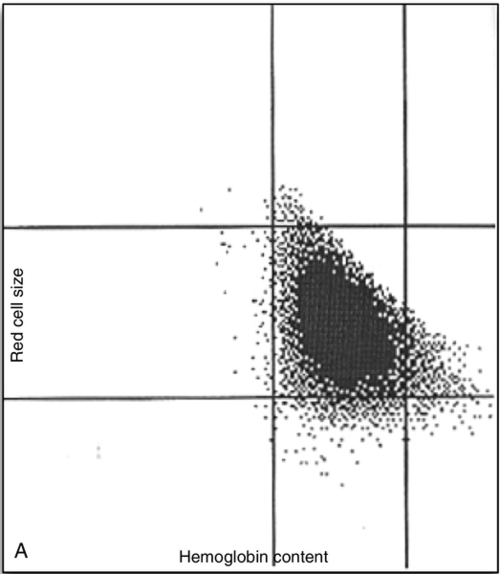
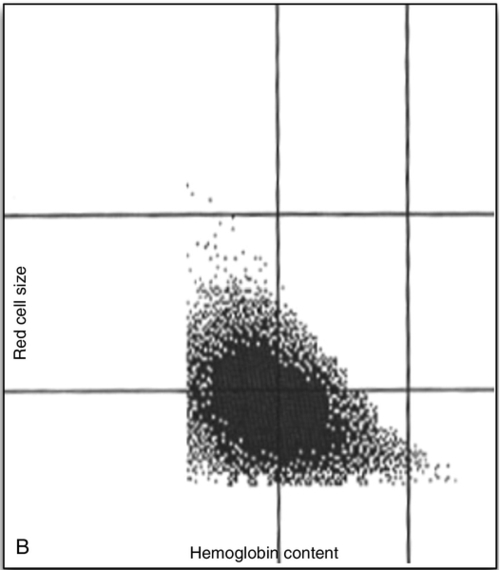
Figure 10-32 Red cell cytogram from an automated hematology analyser. Individual red cell volume (y-axis) is plotted against individual red cell hemoglobin content (x-axis). A, Red cell cytogram for a normal donor (normocytic, normochromic). B, Red cell cytogram for the patient.
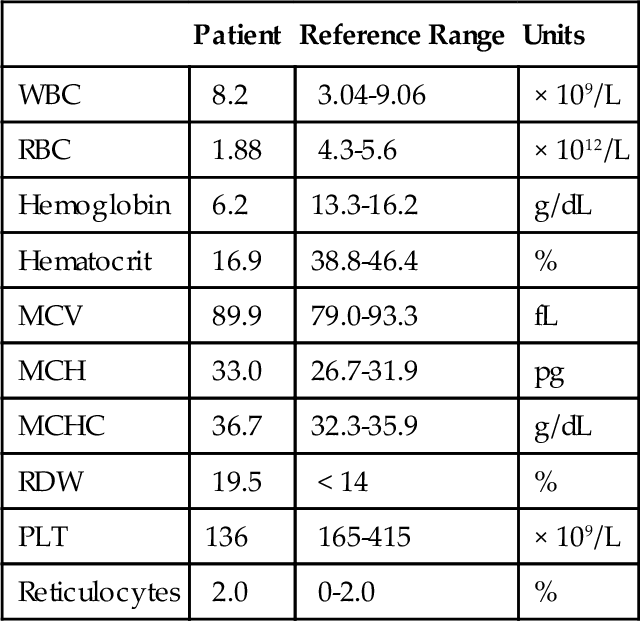
Figure 10-33 Wright-Giemsa–stained peripheral blood smear (×100).
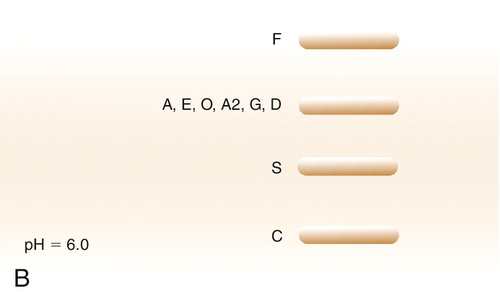
Figure 10-34 A, Alkaline hemoglobin electrophoresis. B, Acid hemoglobin electrophoresis. The bands represent the approximate position of the migrating hemoglobins. O, origin with hemoglobin fractions migrating from left to right (i.e., A runs faster than C).
Figure 10-35 Wright-Giemsa–stained peripheral blood smear (× 100).
