Chapter 5
Genes, Environment-Lifestyle, and Common Diseases

Chapter 4 focuses on diseases that are caused by single genes or by abnormalities of single chromosomes. Much progress has been made in identifying specific mutations that cause these diseases, leading to better risk estimates and, in some cases, more effective treatment of the disease. However, these conditions form only a small portion of the total burden of human genetic disease. Most congenital malformations are not caused by single genes or chromosome defects. Many common adult diseases, such as cancer, heart disease, and diabetes, have genetic components, but again they are usually not caused by single genes or by chromosomal abnormalities.1 These diseases, whose treatment collectively occupies the attention of most healthcare practitioners, are the result of a complex interplay of multiple genetic and environmental∗ factors.
Factors Influencing Incidence of Disease in Populations
Concepts of Incidence and Prevalence
How common is a given disease, such as diabetes, in a population? Well-established measures are used to answer this question.2 The incidence rate is the number of new cases of a disease reported during a specific period (typically 1 year) divided by the number of individuals in the population. The denominator is often expressed as person-years. The incidence rate can be contrasted with the prevalence rate, which is the proportion of the population affected by a disease at a specific point in time. Prevalence is thus determined by both the incidence rate and the length of the survival period in affected individuals. For example, the prevalence rate of acquired immunodeficiency syndrome (AIDS) is larger than the yearly incidence rate because most people with AIDS survive for at least several years after diagnosis.
Principles of Multifactorial Inheritance
Basic Model
Traits in which variation is thought to be caused by the combined effects of multiple genes are polygenic (“many genes”). When environmental factors are also believed to cause variation in the trait, which is usually the case, the term multifactorial trait is used.3 Many quantitative traits (those, such as blood pressure, that are measured on a continuous numeric scale) are multifactorial. Because they are caused by the additive effects of many genetic and environmental factors, these traits tend to follow a normal, or bell-shaped, distribution in populations.
An example illustrates this concept. To begin with the simplest case, suppose (unrealistically) that height is determined by a single gene with two alleles, A and a. Allele A tends to make people tall, whereas allele a tends to make them short. If there is no dominance at this locus, then the three possible genotypes (AA, Aa, aa) will produce three phenotypes: tall, intermediate, and short, respectively. Assume that the gene frequencies of A and a are each 0.50. If we look at a population of individuals, we will observe the height distribution depicted in Figure 5-1, A.
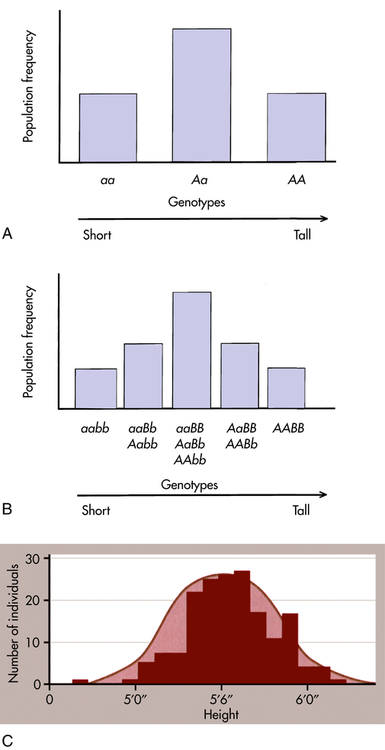
A, Distribution of height in a population, assuming that height is controlled by a single locus with genotypes AA, Aa, and aa. B, Distribution of height, assuming that height is controlled by two loci. Five distinct genotypes are shown instead of three, and the distribution begins to look more like the normal distribution. C, Height is portrayed, realistically, as a trait with a continuous statistical distribution. Because many genes contribute to height and tend to segregate independently of one another, the cumulative contribution of different combinations of alleles to height forms a continuous distribution of possible heights, in which the extremes are much rarer than the intermediate values. Variation also can be due to environmental factors such as nutrition. (A and B adapted from Jorde LB et al: Medical genetics, ed 4, St Louis, 2010, Mosby; C from Raven PH et al: Biology, ed 8, New York, 2008, McGraw-Hill.)
Now suppose, a bit more realistically, that height is determined by two loci instead of one. The second locus also has two alleles, B (tall) and b (short), and they affect height in exactly the same way as alleles A and a. There are now nine possible genotypes in our population: aabb, aaBb, aaBB, Aabb, AaBb, AaBB, AAbb, AABb, and AABB. An individual may have zero, one, two, three, or four “tall” alleles, so now five distinct phenotypes are possible (see Figure 5-1, B). Although the height distribution in our fictional population is still not normal compared with an actual population, it approaches a normal distribution more closely than in the single-gene case just described.
From extension of this example, many genes and environmental factors influence height, each having a small effect. Then many phenotypes are possible, each differing slightly from the others, and the height distribution of the population approaches the bell-shaped curve shown in Figure 5-1, C.
Threshold Model
A number of diseases do not follow the bell-shaped distribution. Instead, they appear to be either present or absent in individuals, yet they do not follow the inheritance patterns expected of single-gene diseases. A commonly used explanation for such diseases is that there is an underlying liability distribution for the disease in a population (Figure 5-2). Those individuals who are on the “low” end of the distribution have little chance of developing the disease in question (i.e., they have few of the alleles or environmental factors that would cause the disease). Individuals who are closer to the “high” end of the distribution have more of the disease-causing genes and environmental factors and are more likely to develop the disease. For diseases that are either present or absent, it is thought that a threshold of liability must be crossed before the disease is expressed. Below the threshold, an individual appears normal; above it, he or she is affected by the disease.
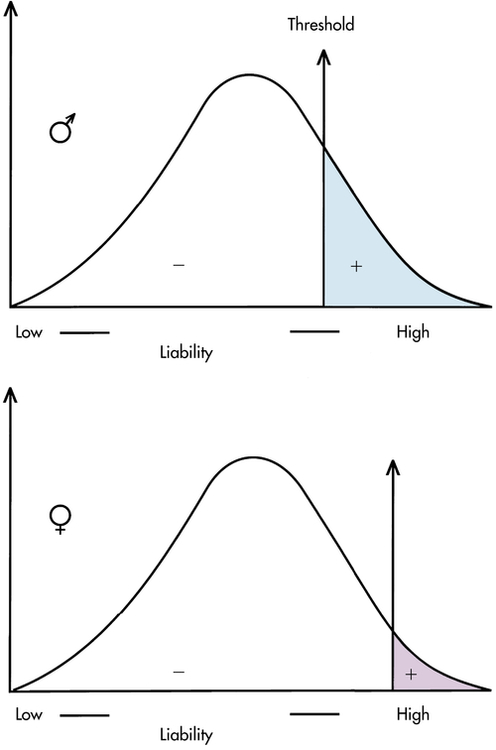
To be affected with the disease, an individual must exceed the threshold on the liability distribution. This figure shows two thresholds, a lower one for males and a higher one for females (as in pyloric stenosis; see text). (From Jorde LB et al: Medical genetics, ed 4, St Louis, 2010, Mosby.)
A disease that is thought to correspond to this threshold model is pyloric stenosis, a disorder that presents shortly after birth and is caused by a narrowing or obstruction of the pylorus, the area between the stomach and intestine. Chronic vomiting, constipation, weight loss, and imbalance of electrolyte levels result from the condition, but it sometimes resolves spontaneously or can be corrected by surgery. The prevalence of pyloric stenosis is about 3 per 1000 live births in whites. It is much more common in males than females, affecting 1 of 200 males and 1 of 1000 females. It is thought that this difference in prevalence reflects two thresholds in the liability distribution—a lower one in males and a higher one in females (see Figure 5-2). A lower male threshold implies that fewer disease-causing factors are required to generate the disorder in males.
The liability threshold concept may explain the pattern of recurrence risks for pyloric stenosis seen in Table 5-1. Note that males, having a lower threshold, always have a higher risk than females. However, the sibling risk also depends on the gender of the proband (i.e., the individual from which the pedigree begins). It is higher when the proband is female than when the proband is male. This reflects the concept that females, having a higher liability threshold, must be exposed to more disease-causing factors than males to develop the disease. Thus a family with an affected female must have more genetic and environmental risk factors, producing a higher recurrence risk for pyloric stenosis in future offspring. It would be expected that the highest risk category would be male relatives of female probands; Table 5-1 shows that this is the case.
TABLE 5-1
RECURRENCE RISKS (%) FOR PYLORIC STENOSIS, SUBDIVIDED BY GENDERS OF AFFECTED PROBANDS AND RELATIVES
| RELATIVES | MALE PROBANDS | FEMALE PROBANDS | ||
| LONDON | BELFAST | LONDON | BELFAST | |
| Brothers | 3.8 | 9.6 | 9.2 | 12.5 |
| Sisters | 2.7 | 3.0 | 3.8 | 3.8 |
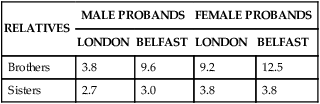
Note that the risks differ somewhat between the two populations.
Data from Carter CO: Br Med Bull 32(1):21–26, 1976.
Recurrence Risks and Transmission Patterns
Whereas recurrence risks can be given with confidence for single-gene diseases (e.g., 50% for typical autosomal dominant diseases, 25% for autosomal recessive diseases), the situation is more complicated for multifactorial diseases. This is because the number of genes contributing to the disease is usually not known, the precise allelic constitution of the parents is not known, and the extent of environmental effects can vary substantially. For most multifactorial diseases, empirical risks (i.e., risks based on direct observation of data) have been derived. To estimate empirical risks, a large series of families is examined in which one child has developed the disease (the proband). Then the siblings of each proband are surveyed to calculate the percentage of siblings who also have developed the disease. For example, in the United States about 3% of siblings of individuals with neural tube defects also have neural tube defects (Box 5-1). Thus the recurrence risk for parents who have had one child with a neural tube defect is 3% in the United States. For conditions such as CL/P that are not lethal or severely debilitating, recurrence risks also can be estimated for the offspring of affected parents. Empirical recurrence risks are, of course, specific for each multifactorial disease.
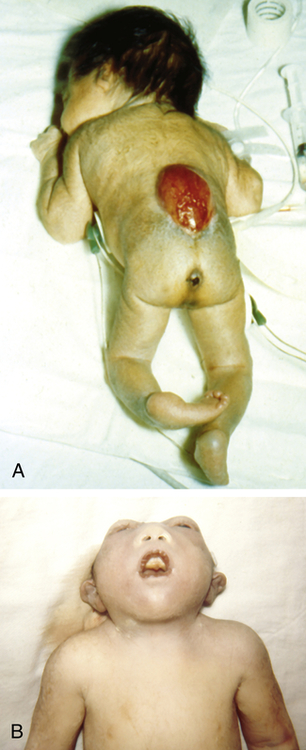
A, Spina bifida in a newborn. B, Anencephaly, showing the absence of the cranial vault. (From Jones KL: Smith’s recognizable patterns of human malformation, ed 6, Philadelphia, Saunders, 2006, p. 705.)
In contrast to most single-gene diseases, recurrence risks for multifactorial diseases can change substantially from one population to another because gene frequencies as well as environmental factors can differ among populations (note the differences between the London and Belfast populations in Table 5-1).
First, the recurrence risk becomes higher if more than one family member is affected. For example, the sibling recurrence risk for a ventricular septal defect (VSD, a type of congenital heart defect) is 3% if one sibling has been affected by a VSD but increases to approximately 10% if two siblings have been diagnosed with VSDs.6 In contrast, the recurrence risk for single-gene diseases remains the same regardless of the number of affected siblings. It should be emphasized that this increase does not mean that the family’s risk has actually changed. Rather, it means that there is more information about the family’s true risk; because they have had two affected children, they are probably located higher on the liability distribution than a family with only one affected child. In other words, they have more risk factors (genetic or environmental) and are more likely to produce an affected child.
Second, if the expression of the disease in the proband is more severe, the recurrence risk is higher. This is again consistent with the liability model because a more severe expression indicates that the affected individual is at the extreme tail end of the liability distribution (see Figure 5-2). His or her relatives are thus at a higher risk for inheriting disease genes. For example, the occurrence of a bilateral (both sides) CL/P confers a higher recurrence risk on family members than does the occurrence of a unilateral (one side) cleft.
Fourth, the recurrence risk for the disease usually decreases rapidly in more remotely related relatives (Table 5-2). Whereas the recurrence risk for single-gene diseases decreases by 50% with each degree of relationship (e.g., an autosomal dominant disease has a 50% recurrence risk for siblings, 25% for uncle-nephew relationships, 12.5% for first cousins), it decreases much more quickly for multifactorial diseases. This reflects the fact that many genes and environmental factors must combine to produce a trait. All the necessary risk factors are unlikely to be present in less closely related family members.
TABLE 5-2
RECURRENCE RISKS (%) FOR FIRST-, SECOND-, AND THIRD-DEGREE RELATIVES
| DEGREE | RISK | |||
| FIRST DEGREE | SECOND DEGREE | THIRD DEGREE | GENERAL POPULATION | |
| Cleft lip/palate | 4 | 0.7 | 0.3 | 0.1 |
| Clubfoot | 2.5 | 0.5 | 0.2 | 0.1 |
| Congenital hip dislocation | 5 | 0.6 | 0.4 | 0.2 |
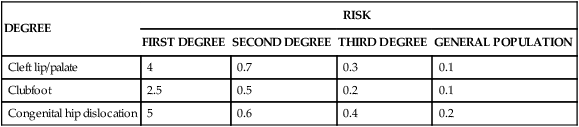
Finally, if the prevalence of the disease in a population is f, the risk for offspring and siblings of probands is approximately  . This does not hold true for single-gene traits because their recurrence risks are independent of population prevalence. It is not an absolute rule for multifactorial traits either, but many such diseases tend to conform to this prediction. Examination of the risks given in Table 5-2 shows that the first three diseases follow the prediction fairly well. However, the observed sibling risk for the fourth disease, infantile autism, is substantially higher than that predicted by
  .
.
Nature and Nurture: Disentangling the Effects of Genes and Environment
Family members share genes and a common environment. Family resemblance in traits such as blood pressure reflects both genes (nature) and environment (nurture). For centuries people have debated the relative importance of these two types of factors. It is a mistake, of course, to view them as mutually exclusive. Few traits are influenced only by genes or only by environmental factors. Most are influenced by both. It is useful to try to determine the relative influence of genetic and environmental factors (Figure 5-4). This can lead to a better understanding of disease etiology. It can also help in planning public health strategies. A disease in which the genetic influence is relatively small, such as lung cancer, may be prevented most effectively through emphasis on lifestyle changes (avoidance of tobacco). When a disease has a relatively larger genetic component, as in breast cancer, examination of family history should be emphasized in addition to lifestyle modification.
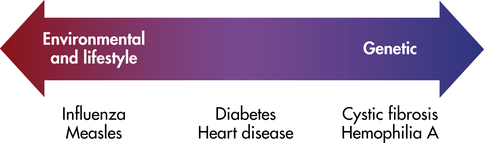
Some diseases (e.g., cystic fibrosis) are strongly determined by genes, whereas others (e.g., infectious diseases) are strongly determined by environmental factors. (Adapted from Jorde LB et al: Medical genetics, ed 4, St Louis, 2010, Mosby.)
Twin Studies
Because MZ twins are genetically identical, any differences between them should be caused only by environmental effects.7 MZ twins should thus resemble one another very closely for traits that are strongly influenced by genes. DZ twins provide a convenient comparison because their environmental differences should be similar to those of MZ twins, but their genetic differences are as great as those between siblings. Twin studies thus usually consist of comparisons between MZ and DZ twins.8 If both members of a twin pair share a trait (e.g., a cleft lip), it is said to be a concordant trait. If they do not share the trait, it is a discordant trait. For a trait determined totally by genes, MZ twins should always be concordant, whereas DZ twins should be concordant less often, because they, like siblings, share only 50% of their genes. Concordance rates may differ between opposite-sex DZ twin pairs and same-sex DZ pairs for some traits, such as those that have different frequencies in males and females. For such traits, only same-sex DZ twin pairs should be used when comparing MZ and DZ concordance rates, because MZ twins are necessarily of the same sex.
Table 5-3 gives concordance rates for a number of traits. Note that the concordance rates for contagious diseases such as measles are quite similar in MZ and DZ twins. This is expected because a contagious disease is unlikely to be influenced markedly by genes. On the other hand, the concordance rates are quite dissimilar for schizophrenia and bipolar affective disorder, suggesting a sizable genetic component for these diseases. The MZ correlations for dermatoglyphics (fingerprints), which are determined almost entirely by genes, are close to 1.0.
TABLE 5-3
CONCORDANCE RATES IN MZ AND DZ TWINS FOR SELECTED TRAITS AND DISEASES∗
| TRAIT OR DISEASE | CONCORDANCE RATE | ||
| MZ TWINS | DZ TWINS | HERITABILITY | |
| Affective disorder (bipolar) | 0.79 | 0.24 | >1∗ |
| Affective disorder (unipolar) | 0.54 | 0.19 | 0.7 |
| Alcoholism | >0.6 | <0.3 | 0.6 |
| Autism | 0.92 | 0 | >1 |
| Blood pressure (diastolic)† | 0.58 | 0.27 | 0.62 |
| Blood pressure (systolic)† | 0.55 | 0.25 | 0.6 |
| Body fat percentage† | 0.73 | 0.22 | >1 |
| Body mass index† | 0.95 | 0.53 | 0.84 |
| Cleft lip/palate | 0.38 | 0.08 | 0.6 |
| Clubfoot | 0.32 | 0.03 | 0.58 |
| Dermatoglyphics (finger ridge count)† | 0.95 | 0.49 | 0.92 |
| Diabetes mellitus | 0.45-0.96 | 0.03-0.37 | >1 |
| Diabetes mellitus (type 1) | 0.55 | — | — |
| Diabetes mellitus (type 2) | 0.9 | — | — |
| Epilepsy (idiopathic) | 0.69 | 0.14 | >1 |
| Height† | 0.94 | 0.44 | 1 |
| Intelligence quotient (IQ)† | 0.76 | 0.51 | 0.5 |
| Measles | 0.95 | 0.87 | 0.16 |
| Multiple sclerosis | 0.28 | 0.03 | 0.5 |
| Myocardial infarction (males) | 0.39 | 0.26 | 0.26 |
| Myocardial infarction (females) | 0.44 | 0.14 | 0.6 |
| Schizophrenia | 0.47 | 0.12 | 0.7 |
| Spina bifida | 0.72 | 0.33 | 0.78 |
Stay updated, free articles. Join our Telegram channel

Full access? Get Clinical Tree


