34
General Principles of Antimicrobial Therapy
This chapter will be most useful after having a basic understanding of the material in Chapter 48, General Principles of Antimicrobial Therapy in Goodman & Gilman’s The Pharmacological Basis of Therapeutics, 12th Edition. Neither Mechanisms of Action nor Clinical Summary Tables are included in this chapter because this information is provided in subsequent chapters.
In addition to the material presented here, Chapter 48 of the 12th Edition contains:
• A detailed discussion of the pharmacokinetic basis for antimicrobial therapy
• A thorough discussion of the types and goals of antimicrobial therapy
LEARNING OBJECTIVES
 Describe the pharmacokinetic basis of antimicrobial therapy.
 Identify the importance of susceptibility testing of antimicrobial agents.
 Identify the factors that form the basis for selection of an antimicrobial dose and dosing schedule.
 Describe the types and goals of antimicrobial therapy.
 Identify the mechanisms of resistance to antimicrobial agents.
CLASSIFICATION OF ANTIMICROBIAL AGENTS
• The first broad classification of antimicrobial agents is according to the microorganisms they are active against: antibacterial, antiviral, antifungal, antiparasitic.
• Further classification of an antibiotic is based on:
▶ The class and spectrum of the microorganisms it kills
▶ The biochemical pathway it interferes with
▶ The chemical structure of its pharmacophore (the chemical moiety of the drug that binds to a microbial receptor)
DRUGS INCLUDED IN THIS CHAPTER
The pharmacology of specific drugs is not included in this chapter. The drugs presented in the cases are used as examples to illustrate various aspects of antimicrobial therapy; the specific pharmacology of these drugs is presented in the subsequent chapters of this section.
FACTORS THAT AFFECT THE PENETRATION OF A DRUG INTO AN ANATOMICAL COMPARTMENT
• Physical barriers (eg, blood–brain barrier)
• Chemical properties of the drug (eg, octanol-water partition coefficient)
• Membrane transporters (eg, p-glycoprotein)
A 34-year-old woman has a diagnosis of pneumococcal meningitis. The pathogen is determined to be sensitive to penicillin and she is being treated with high-dose penicillin.
a. How does the chemical nature of a drug affect its penetration into various anatomic compartments such as the brain?
An important factor is the drug’s lipid solubility or its octanol:water partition coefficient. The higher the octanol:water partition coefficient, the more likely it is to penetrate physical barriers erected by layers of cells. The more charged a drug molecule, and the larger it is, the poorer its penetration across physical barriers.
b. What is unique about the brain in terms of drug penetration?
The central nervous system (CNS) is guarded by the blood–brain barrier. The movement of antibiotics across the blood–brain barrier is restricted by tight junctions that connect endothelial cells of cerebral microvessels to one another in the brain parenchyma, as well as by protein transporters. Antimicrobial agents that are polar at physiological pH, such as penicillin G, generally penetrate poorly. Some drugs, such as penicillin G, are actively transported out of the cerebrospinal fluid. However, the integrity of the blood–brain barrier is diminished during active bacterial infection, such as pneumococcal meningitis, leading to an opening of the tight junctions and the penetration of even polar drugs.
c. What other anatomical compartments require special attention for antimicrobial therapy?
The ocular cavity, pulmonary epithelial linings, endocardial vegetations, and prosthetic devices such as artificial heart valves, long-dwelling catheters, artificial hips, and devices for internal fixation of bone fractures are compartments in which antibiotic penetration is poor.
d. How should the drug and its antimicrobial target be viewed?
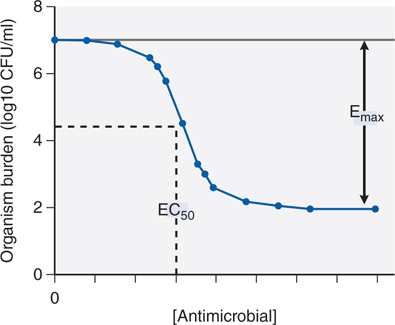
Antimicrobial molecules should be viewed as ligands whose receptors are microbial proteins and the relationship between drug concentration and effect on a population of organisms is modeled using the standard Hill-type curve for receptor and agonist (see Figure 34-1). The inhibitory concentration 50 or IC50 (also termed EC50 or effective concentration 50) is a measure of the antimicrobial agent’s potency; the Emax is the antimicrobial agent’s maximum effect.
FIGURE 34-1 Inhibitory sigmoid Emax curve. CFU, colony forming units.
A 62-year-old man with chronic obstructive pulmonary disease develops a pumonary infection that rapidly becomes a systemic bacteremia requiring antibiotic therapy. The microorganism has been isolated and susceptibility testing has been completed. The minimum inhibitor concentration (MIC) is 0.5 mg/L and the serum t½ of the antibiotic is 3 hours.
a. In choosing a drug and dose regimen that will be most effecitve in this patient what must be considered?
The microbiology laboratory plays a central role in the decision to choose a particular antimicrobial agent over others. Their first function is the identification and isolation of the pathogenic organism. Once this is accomplished, the rational choice of the class of antibiotics to administer to the patient can be made. Then the laboratory performs susceptibility testing to narrow down the list of possible antimicrobials that could be used. Susceptibility testing for bacteria employs antibiotics in serially diluted concentrations of solid agar or in broth medium that contains a culture of the test microorganism. The lowest concentration of the agent that prevents visible growth after 18 to 24 hours of incubation is known as the MIC.
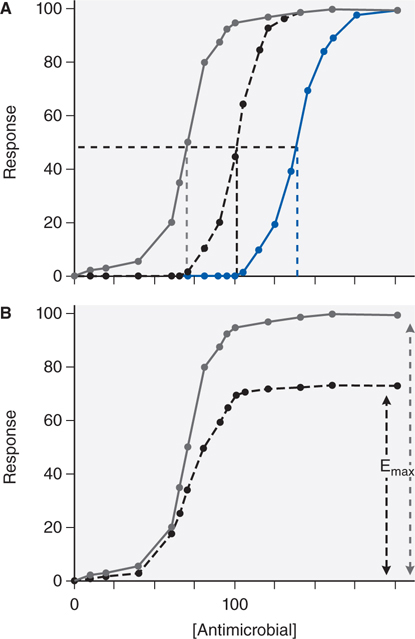
In choosing a dose regimen, the first consideration is to index drug exposure to the MIC. Second, dose itself is a poor measure of drug exposure, given between-patient and within-patient pharmacokinetic variability. The optimal dose of the antibiotic for a patient is the dose that achieves inhibitory concentration (IC) of IC80 to IC90 exposures at the site of infection. A third consideration is that optimal microbial kill by the antibiotic may be best achieved by optimizing certain shapes of the concentration-time curve (see answer to Case 34-2b below). Last, changes in susceptibility to drug (ie, drug-resistance) can occur during therapy. The change in drug susceptibility of an organism is depicted in Figure 34-2. A shift to the right of the antimicrobial concentration versus response curve, that is, an increase in the IC50 (see Figure 34-2A), means that much higher concentrations are now needed to show a specific response to the drug and reflects increasing resistance to a particular antibiotic. A second possible change in the curve is a decrease in Emax (see Figure 34-2B), such that increasing the dose of the antibiotic beyond a certain point will achieve no further effect. This occurs because the available microbial target proteins have been reduced or the microbe has developed an alternative pathway to overcome the biochemical inhibition.
FIGURE 34-2 Changes in sigmoid Emax model with increases in drug resistance. Increase in resistance may show changes in IC50 (panel A: the IC50 increases from 70 [gray line] to 100 [black line], to 140 [blue line]) or decrease in Emax (panel B: efficacy decreases from full response [gray line] to 70% [black line]).
b. How does the dose administration schedule (once daily or 3 divided doses) affect the drug concentration-time profile?
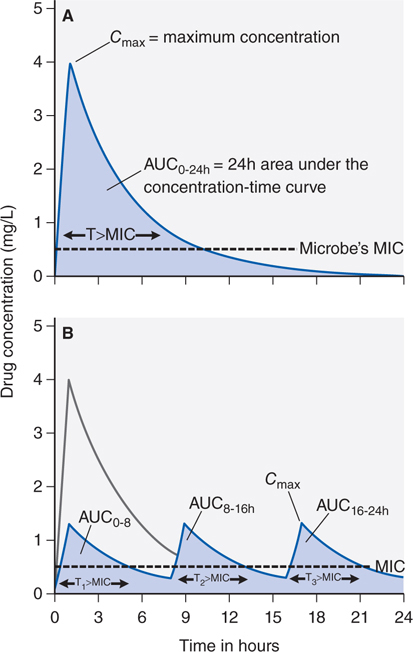
Figure 34-3A depicts the concentration-time curve of an antibiotic in which the peak concentration (CPmax), area under the curve (AUC), and the fraction of the dosing interval (T) for which the drug concentration remains above the MIC (T > MIC) are shown. Figure 34-3B shows concentration-time curves when the same dose of the antibiotic is given as 3 equal doses administered at 0, 8, and 16 hours. The AUC0-24 will be similar whether the dose was given once a day or 3 times a day. Thus, for the same pathogen, the change in dose schedule does not change the AUC0-24/MIC. However, the CPmax will decrease by a third when the total dose is split into 3 doses and administered more frequently (see Figure 34-3B). In addition, the time that the drug concentration persists above MIC (T > MIC) is slightly increased with the more frequent dosing schedule.
FIGURE 34-3 Effect of different dose schedules on shape of concentration-time curve. The total AUC for the fractionated dose in curve B is determined by adding AUC0-8h, AUC8-16h, and AUC16-24h, which adds up to the same AUC0-24h in curve A. The time concentration exceeds MIC is also determined by adding up T1>MIC, T2>MIC, and T3>MIC, which results in a fraction greater than that for curve A.
c. Which indices, AUC/MIC, or CPmax/MIC or T > MIC is the most important to determine the microbial kill?
This depends on the antimicrobial. Some antibiotics (β-lactam antibiotics, eg, penicillin) kill best when drug concentration persists above MIC for longer durations of the dosing interval. A drug optimized by T > MIC should be dosed more frequently. Indeed the effectiveness of penicillin is enhanced when it is given as a continuous infusion.
The peak concentration is what matters for some antimicrobial agents. Aminoglycosides are a good example of this class as they previously were given three times a day but experience has shown that aminoglycosides are highly effective when given once a day (see Chapter 40).
There is a third group of antimicrobial agents for which the dosing schedule has no effect on efficacy, but it is the cummulative effect that matters. Daptomycin is an example of this group of drugs. These drugs also have a long postantibiotic effect (PAE). Their effect continues long after antibiotic concentrations decline below the MIC.
d. How does the dosing schedule relate to resistance suppression?
In many instances, the drug exposure required for resistance suppression is much higher than for optimal kill. Unfortunately, this higher exposure is also associated with drug toxicity when doses are increased. Although the relationship between microbial kill and exposure is based on the inhibitory sigmoid Emax model, this model does not apply to resistance suppression.
PATIENTS AT RISK FOR INFECTIVE ENDOCARDITIS FOR WHICH PROPHYLACTIC THERAPY IS RECOMMENDED
Stay updated, free articles. Join our Telegram channel

Full access? Get Clinical Tree


