Decades of research have conclusively shown that child malnutrition has a negative impact on the physical and intellectual development of children (
1,
2). The consequences of household food insecurity (FI) on child development have just begun to be understood, however. This discrepancy is explained in part by the fact that global consensus on the definition of household FI was reached only at the end of the twentieth century. This chapter examines the influence of household FI on the development, health, and well-being of children and youth and discusses potential mediators, specifically maternal depression.
FOOD INSECURITY MEASUREMENT
The five commonly used methods for assessing FI directly or indirectly are as follows: (a) the Food and Agricultural Organization (FAO) method for estimating average calories available per capita, (b) household income and expenditure surveys, (c) dietary intake surveys, (d) maternal-child anthropometry, and (e) experience-based FI scales (
4). Experience-based scales were originally developed in the United States, and their use has spread globally (
4,
5). These scales are strongly grounded on qualitative research conceptualizing FI as a “managed” household process that moves through a series of stages. This process starts with a state of worry or anxiety related to the uncertainty about future access to food and is followed by sacrificing dietary quality and eventually reducing the amount of food consumed, first among adults and then among children (
4).
FI scales include questions that examine each stage or one specific stage of FI. Questions are usually answered by an adult who knows about the food situation in the household, and for each household a total summative score is estimated based on the number of affirmative responses. These scores can then be converted into FI categories (i.e., food security, mild FI, moderate FI, severe FI) based on cutoff points that discriminate among the different stages of FI experienced by households. The US Household Food Security Survey Module (HFSSM) was found to have adequate psychometric behavior and validity for use in both large-scale surveys and smaller studies in the United States, and this tool has been adapted and validated in other developed and several developing countries (
5,
6,
7).
Experience-based FI scales directly measure the phenomenon of interest, are easy to apply, and have been well accepted by both target communities and policy makers (
4,
6). These scales do not capture all the dimensions of the FI construct, however. For example, they do not assess the safety of the food supply accessed by the household or measure issues related to water security.
In addition, the measure captures FI at the household level but cannot identify individuals within the same household experiencing different degrees of FI (
6).
This chapter reviews evidence focused on experiencebased FI scales because of the following: (a) these FI scales are constructed around the consensus definition of household food security adopted by the international community; (b) they represent a direct measurement of the phenomena of interest; and (c) a substantial body of evidence evaluating the impact of FI on child nutrition and health outcomes, based on these scales, is available.
GLOBAL FOOD INSECURITY TRENDS
The US Census Bureau reports annual household FI rates since 1995 estimated from the 18-item HFSSM applied through the December Current Population Survey Food Security Supplement. The reference time period of the HFSSM is the 12 months preceding the survey, and households are classified as having food security, low food security, or very low food security, based on the number of affirmative answers to the HFSSM items (
6). In 2008, 14.6% of US households were food insecure (i.e., with either low or very low food security). This rate, which translates into 17.1 million households, is the highest ever recorded since 1995. US households are more likely to be food insecure if they are poor, are headed by a single woman, have a head of household who reports being Hispanic or African-American, and they have children. Indeed, according to the US Department of Agriculture (USDA) (
8), households with children had almost twice the rate of FI as those without children (21% versus 11.3%, respectively). Thus, normal development of a substantial number of low-income children in the United States may be at risk, to the extent that development is influenced by FI.
Household FI estimates based on experience-based scales are difficult to compare across countries because different scales, time frames, and classification algorithms have been used. One exception is the work by Nord and Hopwood (
9), who demonstrated that national adult and child FI rates, estimated with the HFSSM, are significantly lower in Canada than in the United States even after investigators controlled for key socioeconomic and demographic confounders (
Table 72.1). Differences in social policies in both countries may partly explain these findings.
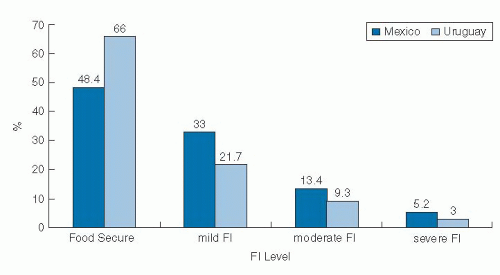
Perez-Escamilla et al (
10) documented that household FI was substantially worse in Mexico than in Uruguay when these investigators applied the Latin American and Caribbean Household Food Security Scale (ELCSA) (
7) and used similar tool application and nationally representative sampling procedures (
Fig. 72.1).
Regional and global estimates derived from a standardized FI experience-based scale are still not available. Therefore, one must rely on other FI indicators to estimate the magnitude of the problem. The FAO estimates that approximately 1 billion individuals worldwide experience caloric undernutrition (
11). The problem is more severe in sub-Saharan Africa and in South and Southeast Asia (
Table 72.2). This figure largely underestimates the magnitude of the FI problem because hundreds of
millions of individuals who may have access to sufficient or even excessive amounts of calories may not have access to diets of adequate nutritional quality (
4).
CONCEPTUAL FRAMEWORK
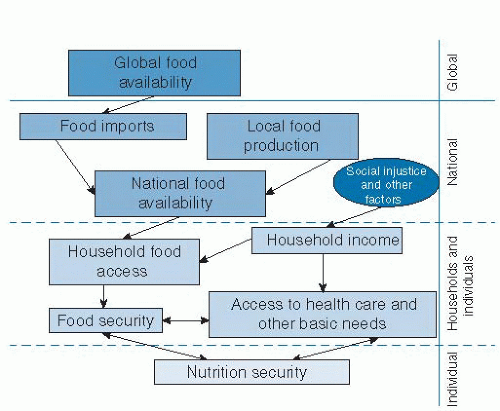
Nutrition security, a condition that occurs when the body tissues are exposed to optimal amounts of nutrients and other essential substances, is the result of household food security, health care access security, and access to other basic human needs, including adequate sanitation. Food security and the other determinants of nutrition security interact with each other (
12). For example, a household with limited resources for purchasing food may decide to not bring a child to the doctor and not to purchase needed medications. For food security to exist, households need to have access to healthy and nutritious foods. Access to these foods, in turn, depends on having an adequate income and for foods to be available in enough quantities in the country, region, and communities where the households are located. National food availability for human consumption represents the balance between foods locally grown and foods imported, minus foods exported, spoiled, or fed to animals (
Fig. 72.2).
Thus, ultimately, maintenance of an adequate food supply at the global level is paramount for achieving household food security and nutrition security worldwide. Global food supplies are strongly influenced by climate change, agricultural commodity price policies, and armed conflicts (
13).
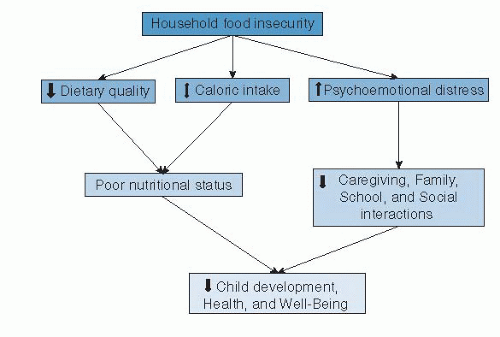
Household FI can affect a child’s physical, mental, social, and psychoemotional development through different pathways (
Fig. 72.3). One biologic pathway involves the direct link among FI, poorer dietary intakes, nutritional status, and overall well-being. A second psychoemotional pathway involves the worry or anxiety, feeling of
deprivation and alienation, distress, and adverse family and social interactions that result when households are exposed to FI. Thus, it is plausible that FI may lead to suboptimal physical and mental development of children (
6).
FOOD INSECURITY AND DIETARY QUALITY
Studies have consistently shown that FI is associated with lower dietary quality and suboptimal nutrient intakes among children. FI was associated with lower fruit and vegetable intake at home among 5- to 12-year-old Hispanic children living in San Antonio, Texas (
14). A binational study found that 5-year-old Mexican children living in the United States who experienced FI consumed more fat, saturated fat, sweets, and fried snacks than children not experiencing FI. In contrast, in Mexico, FI was associated with lower intake of total carbohydrates, dairy products, and vitamin B6 (
15). A study conducted in low-income urban neighborhoods in Korea found the largest consumption of energy-dense foods among 4- to 12-year-old children living in food-insecure households, followed by children living in food-secure households, households with food insecure adults, and households with child hunger. These results were consistent with the finding that children living in food-insecure households were heavier than those living in food-secure households (
16). A study in rural Tanzania found lower consumption of animal source protein foods in food-insecure households where 1- to 5-year-old children lived (
17). Studies in numerous countries in Latin America and Caribbean, sub-Saharan Africa, and Asia documented lower dietary quality in food-insecure households with children; and these associations followed a dose-response pattern as a function of FI severity (
18,
19,
20).