Chapter Thirteen. Fetal growth and development
The fetal period
Care must be taken to avoid confusion when calculating fetal age. Traditionally this has been calculated from the first day of the last menstrual period (LMP). Following the use of ultrasound scanning, it is more common to calculate fetal age by using the estimated day of fertilisation. The date of birth is about 266 days or 38 weeks after fertilisation and 280 days or about 40 weeks from the first day of the LMP. It is usual to use post-fertilisation age when describing organ development and this method will be used throughout this chapter.
Fetal growth
Moore & Persaud (2008) state that ‘during the fetal period (9th week until birth) differentiation of tissues and organs formed during the embryonic period occurs’. Wolpert et al (2007) define growth as ‘an increase in size, which occurs by cell multiplication, increase in cell size and deposition of extracellular material’. Apoptosis (cell death) is also important in determining overall growth rate.
Tissues may grow by:
• Cell proliferation or hypertrophy: increased cell numbers.
• Cell enlargement or hyperplasia: increased cell size.
• Accretion of extracellular material such as bone matrix.
From fertilisation, during cleavage and blastula formation, there is little growth and cells become smaller with each cleavage division. From weeks 9 to 24 there is remarkable growth and then growth slows but remains constant from 30 to 36 weeks when it slows again (Johnson 2007). In early pregnancy growth is mainly by hyperplasia. This is followed by a period of simultaneous hyperplasia and hypertrophy (Bogin 2001). After 34 weeks growth is mainly by hypertrophy (Blackburn 2007). Growth and maturation of the systems are directly linked to the ability of the fetus to survive after birth, a concept known as viability.
Control of cell growth and proliferation
Growth factors (insulin-like growth factors 1 and 2—IGFs or somatomedins) and other signalling proteins play a key role in controlling cell growth and proliferation. Without these signals cells commit apoptosis (cell suicide), brought about by activation of an internal cell death programme (Wolpert et al 2007). However, the mechanisms of embryonic cell division are poorly understood. Placental, fetal and maternal factors determine fetal growth (Box 13.1).
 BOX 13.1
 CONTROL OF FETAL SIZE
Growth of the fetus is multifactorial, involving both genetic and environmental factors. Fetal growth involves the accumulation of protein early in development which reaches a maximum of 300 g by week 35. Fat deposition exceeds the amount of protein by week 38, most of which is subcutaneous. The human baby has the most subcutaneous fat of any animal and this may be related to ensuring brain growth does not suffer. The relative amount of water in fetal tissues decreases. If the fetus grows too large there may be difficulty in delivery but if it remains too small health patterns in both childhood and later life may be compromised. Intrauterine growth retardation is discussed in Chapter 14.
The mother adapts to fetal needs by increasing calorie intake and modifying metabolic activity. These changes seem to occur in response to signals from the fetoplacental unit. However, the mother also seems to be able to limit fetal growth. Her height is linked to her uterine capacity and small women appear to have small babies but the mechanism is not clear. It may be that the placenta limits the amount of nutrients transferred to the fetus in late pregnancy.
Additional maternal influences include parity with primiparous women having smaller babies by about 200 g than multiparous women and adolescent mothers have smaller babies than fully mature mothers. Gluckman & Hanson (2005) believe this is due to the effect of a first pregnancy on the uterine vascular bed. They give the analogy of elastic bands being easier to stretch after some use. The uterine blood vessels which are small and tortuous before pregnancy respond to placental oestrogens and progesterone by becoming relaxed and more dilated. This improves fetal nutrition and the baby grows larger. They suggest this is also seen in multiple pregnancies when each baby obtains less nutrition than a singleton baby and is therefore smaller.
Haig (1993) first suggested that how big a baby grows is determined by conflict between maternal and paternal genes (see also Abu-Amero et al 2006, Wolpert 2007). The insulin-like growth factors IGF1 and IGF2 closely resemble the simple insulin molecule and appear to have a key role in embryonic and fetal growth. In humans IGF2 is inherited on chromosome 11. The IGF2 gene inherited from the father makes a growth factor which helps the fetus to grow whilst the maternal gene is programmed to be non-functional. This phenomenon is called genomic imprinting, i.e. expressed in a parent-specific manner regardless of Mendelian inheritance (Wolpert 2007).
However, evidence for maternal constraint of fetal growth is found in the size of foals from horse crosses between a large shire horse and a smaller Shetland pony. If the mother is a shire horse, the newborn foal is similar in size to a normal shire foal, but if the mother is a Shetland pony the newborn is much smaller than a normal shire foal would be. After birth both foals achieved a similar size, midway between shires and Shetlands (Gluckman & Hanson 2005, Wolpert et al 2007). The size of the fetus may be constrained by the size of the intrauterine environment (Gluckman & Hanson 2005).
The fetus also contributes to growth control by its genetic inheritance and by its sex; male fetuses grow larger than females on average. Synthesis of the IGFs increases throughout pregnancy. IGF1 is a major direct endocrine stimulus whilst IGF2 may have a more indirect effect by stimulating placental growth and transport mechanisms (see Ch. 12).
Key events in the fetal stage of development
The details of developmental stages are adapted from Moore & Persaud (2008) and are given in Table 13.1. Note that there is no line of week or measure when a fetus can be said to be viable. Dimensional variations increase with age, making the judgement of gestational age less accurate (Figure 13.1 and Figure 13.2). It is still unlikely that a fetus of less than 22 weeks or weighing less than 500 g could survive.
| Weeks | Developmental feature |
|---|---|
| 9 | The fetal head measures half the crown–rump length |
| 10 | Intestinal cells have all re-entered the body cavity |
| 12 | Fetal length has more than doubled The upper limbs have attained their relative length in comparison to the trunk but the lower limbs remain short The mature forms of the external genitalia appear There is a decrease in red cell formation in the liver and onset in the spleen The formation and excretion of urine begins The beginning of fetal muscle movement occurs The eyelids fuse |
| 13–16 | This is a period of very rapid growth |
| 16 | The head is now smaller in comparison to the trunk and the lower limbs have reached their correct proportions The skeleton can be seen clearly on X-ray films The face is more human, the eyes pointing anteriorly rather than laterally The external ears have moved to their positions on the sides of the head |
| 17–20 | Growth slows down Fetal movements are felt by the mother The skin is covered by vernix caseosa, to protect it from amniotic fluid Lanugo has developed all over the body Head and eyebrow hair become visible Highly metabolic brown fat is formed |
| 21–25 | Surfactant production in the lungs begins Towards the end of this period survival becomes possible The skin lacks subcutaneous fat and is wrinkled The skin appears red because of blood capillaries just under the surface The fetus now has periods of sleep and activity and responds to sound |
| 26–29 | The lungs are capable of breathing and allowing gas exchange The nervous system controls rhythmic breathing movements and body temperature Intrauterine respiratory movements occur The eyes re-open Head and lanugo hair are well developed White, subcutaneous fat is laid down under the skin At 28 weeks erythropoiesis ends in the spleen and begins in the bone marrow |
| 30–34 | The papillary light reflex is present Body fat expands to 8% of total body weight The skin is opaque and smooth From 32 weeks most fetuses will survive Lanugo disappears from the face The fetus begins to store iron |
| 35–38 | The grasp is firm Most fetuses are plump At 36 weeks head and abdominal circumferences are equal. Later the abdominal circumference becomes greater. Growth slows towards term By 38 weeks body fat is 16% of body weight Breast tissue is present in both sexes The testes are in the scrotum in males The nails reach the tips of the fingers Lanugo disappears from the body |
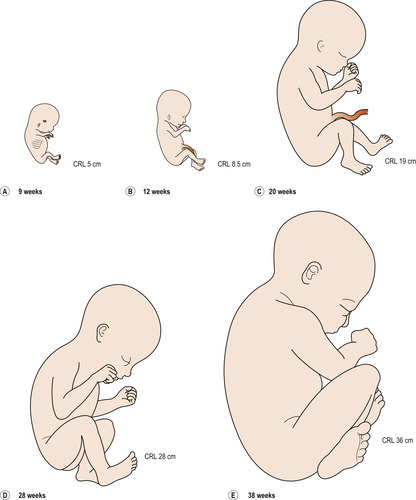 |
| Figure 13.1 Drawings of fetuses at various stages of development. CRL, crown–rump length. (Reproduced with permission from Moore 1989.) |
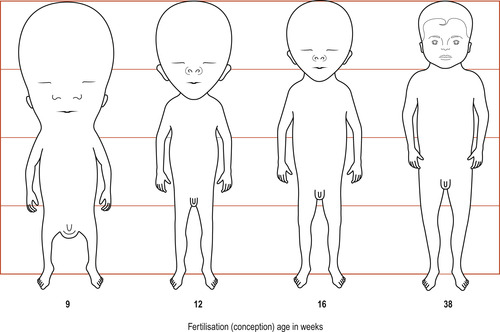 |
| Figure 13.2 The changing proportions of the body during the fetal period. At 9 weeks the head is about half the crown–rump length of the fetus. By 38 weeks the circumferences of the head and the abdomen are approximately equal. After this the circumference of the abdomen may be greater. All stages are drawn to the same total height. (Reproduced with permission from Moore 1989.) |
Fetal size
Before birth it is usual to measure the fetus as sitting height or crown–rump length. Table 13.2 is based on post-fertilisation age and is derived from Moore & Persaud (2008).
| Age in weeks | Crown–rump length in mm | Weight in grams |
|---|---|---|
| 10 | 61 | 14 |
| 12 | 87 | 45 |
| 14 | 120 | 110 |
| 16 | 140 | 250 |
| 18 | 160 | 320 |
| 20 | 190 | 460 |
| 22 | 210 | 630 |
| 24 | 230 | 820 |
| 26 | 250 | 1000 |
| 28 | 270 | 1300 |
| 30 | 280 | 1700 |
| 32 | 300 | 2100 |
| 36 | 340 | 2900 |
| 38 | 360 | 3400 |
Estimation of fetal age and assessment of fetal growth
Growth curves
If a series of measurements is taken, these can be plotted on a graph and used to calculate growth. Growth can be viewed as a motion through time (Bogin 2001) and, if measurements are taken and plotted at regular intervals, a curve called a distance curve (Fig. 13.3) results. It is more usual to plot a distance curve when monitoring fetal growth. To show how the rate of growth alters over time, the speed or velocity of growth is plotted, generating a velocity curve showing how the rate of growth alters (Fig. 13.4).
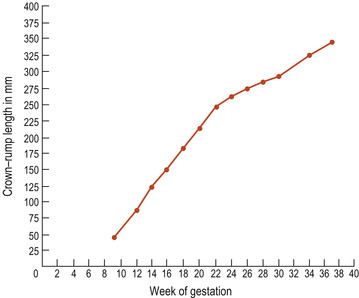 |
| Figure 13.3 An example of a distance curve using data from fetal crown–rump measurements. |
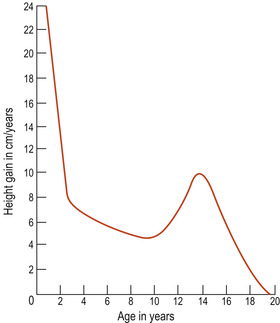 |
| Figure 13.4 An example of a velocity curve demonstrating the growth of the body from birth to age 18 years. |
Maternal weight and fetal growth
Maternal weight gain has traditionally been used to assess fetal well-being in pregnancy, and continued weight gain is thought to be a favourable sign. However, weight gain varies widely from weight loss to a gain of 23 kg or more. Many factors affect maternal weight gain, including the presence of oedema, maternal metabolic rate, dietary intake, gastrointestinal problems, smoking and the size of the fetus.
Attempts to control maternal weight gain in order to reduce the size of the fetus and make delivery easier have been unsuccessful and had little effect on fetal size. The only components of maternal weight gain available for manipulation are maternal fat and extracellular fluid and it may be that neither obesity nor oedema can be influenced by regular weighing. An average weight gain appears to be about 12 kg and should be 2 kg in the first 20 weeks and 0.5 kg/week until term. Components of normal weight gain are shown in Table 13.3.
| Component of fetal weight | Gain in grams |
|---|---|
| The fetus | 3400 |
| The placenta | 600 |
| The amniotic fluid | 600 |
| The uterus | 900 |
| The breasts | 500 |
| Fat stores | 3500 |
| Blood volume | 1500 |
| Extracellular fluid | 1000 |
| Total | 12000 |
Poor weight gain has been associated with intrauterine growth retardation (IUGR) but is not a sensitive indicator and babies with IUGR are delivered when weight gain has been normal. Daily fluctuations in a woman’s weight can be up to 1% of total body weight and there are better ways of assessing the fetus.
Uterine fundal height is the most common way to assess fetal growth. The measurements are made in centimetres from the upper border of the symphysis pubis to the top of the fundus of the uterus. Errors may occur if the woman is too thin or obese or has too much or too little abdominal muscle tone. Breech presentation or transverse lie can also result in error. Fundal height can be plotted against a standard curve.
Ultrasound
The gestational age is calculated from the mother’s LMP or taken from an early first or second trimester scan. Plotting of later measurements must be accurate to avoid wrong diagnosis. The success rate of ultrasound in detecting IUGR can be as high as 95%. Ultrasound measurements can also be plotted against a normal curve. Linear and non-linear measurements can be used.
Linear measurements
Crown–rump length is used to estimate gestational age in the first trimester. The measurement between the two biparietal eminences is called the biparietal diameter (BPD) (Fig. 13.5). The correct position of the fetal head must be located (Fig. 13.6). This is a useful estimate of gestational age in the second trimester but is less accurate later in pregnancy. Femur length can also be used to assess gestational age.
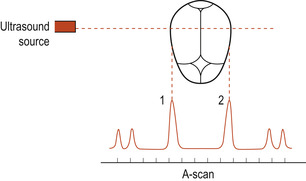 |
| Figure 13.5 Measuring the biparietal diameter by ultrasound; 1 and 2 indicate the parietal eminences. (From Henderson C, Macdonald S 2004, with kind permission of Elsevier.) |
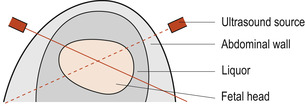 |
| Figure 13.6 A diagram showing the abdominal wall and the fetal head. (From Henderson C, Macdonald S 2004, with kind permission of Elsevier.) |
Stay updated, free articles. Join our Telegram channel

Full access? Get Clinical Tree


