100
CHAPTER OUTLINE
Epidemiology has historically been defined as “the study of the distribution of a disease or a physiologic condition in human populations and of the factors that influence this distribution” (1). Within this framework, epidemiology of adolescent substance use documents the incidence of substance use and correlates of use. Because adolescent substance use may be viewed as a continuum from experimentation to alcohol or drug dependence, it is more helpful to describe use patterns (behaviors that may influence health, rather than incidence of disease, i.e., addiction).
There are several excellent sources of information about prevalence and trends of adolescent substance use including the Monitoring the Future survey, Youth Risk Behavior Surveillance System survey, and National Survey on Drug Use and Health (2–4). The source of information for this chapter is Monitoring the Future, a national survey of drug use that has been administered annually since 1975 and offers a comprehensive view of the factors that influence drug use. In addition to surveying young people about drug use, this survey addresses important factors such as beliefs about the dangers of drugs and perceived availability.
The 2012 Monitoring the Future surveyed 45,400 students from 395 public and private schools, chosen to offer a nationally representative sample. Between 1975 and 1991, the survey included 12th graders only. Starting in 1991, the survey included 8th and 10th graders. Because this survey is administered within the school setting, groups at high risk of substance use such as truants, dropouts, and runaways are not included, and thus the data are adjusted statistically to account for this.
This chapter will review trends of individual substance use including alcohol, tobacco, marijuana, amphetamines, narcotics, cocaine, inhalants, and prescription drugs and newer drugs such as “bath salts” and synthetic marijuana. Adolescents commonly use more than one substance, so available information about multiple drug use will be presented. In addition, information about subgroups, examining gender, race/ethnicity, and educational aspirations will be presented. Unless otherwise indicated, all trend and prevalence data are derived from the Monitoring the Future survey.
PREVALENCE AND TRENDS
When Monitoring the Future began in 1975, 55.2% of young people reported having used an illicit drug by the time they left high school. By 1980, this had increased to 65.4% before gradually declining to 40.7% in 1992. The proportion again increased to 54.7% in 1999, declining gradually to 47% in 2007 to 2009, rising again to 49.1% in 2012 (Fig. 100-1). Since the inclusion of 8th and 10th graders in the 1991 survey, their trends have paralleled those of 12th graders, though at lower levels (5). In 2012, 13.4% of 8th graders, 30.1% of 10th graders, and 39.7% of 12th graders reported use of an illicit drug in the past year (6). In 2011, of college students and young adults not attending college, 36% and 35%, respectively, reported use of an illicit drug in the past year (7).
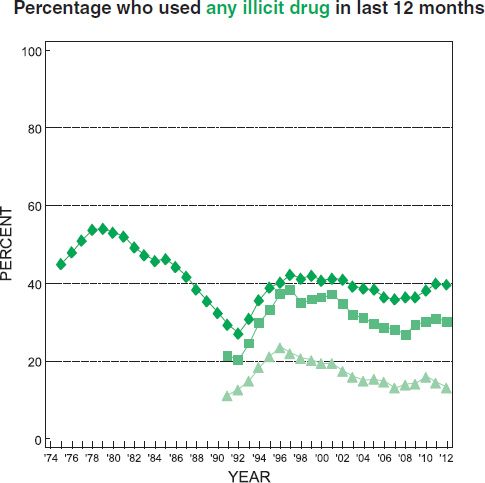
FIGURE 100-1 Illicit drugs. Percentage who have used an illicit drug in the past year. (From the Monitoring the Future study. University of Michigan, http://www.monitoringthefuture.org//pubs/monographs/mtf-overview2012.pdf.)
Alcohol
Though it is illegal for all secondary school students and for most college students, a substantial percentage report experience with alcohol. In 2012, 29.5% of 8th graders, 54.0% of 10th graders, and 69.4% of 12th graders reported having tried alcohol (6). Of greater public health concerns is prevalence of episodic heavy drinking, or “binge drinking” (defined as 5 or more drinks in a row at least once during the past 2 weeks). Heavy drinking was reported in 2012 by 5.1% of 8th graders, 15.6% of 10th graders, and 23.7% of 12th graders (6) and, in 2011, by 36% of college students (7).
Trends of alcohol use have overall followed the trends of illicit drug use, rising and falling in concert. During the 1980s, as illicit drug use declined among 12th graders, monthly alcohol use among 12th graders also declined gradually but, substantially, from 72.0% in 1980 to 51.3% in 1992 (Fig. 100-2). The prevalence of binge drinking during the previous 2 weeks fell from 40.8% in 1983 to 27.5% in 1993—nearly a one-third decline (5). Alcohol use (particularly binge drinking) rose in the 1990s. By the late 1990s, as illicit drug use leveled in secondary schools and began a gradual decline, alcohol use followed a similar trend. Alcohol use has continued its long-term decline, reaching historic lows in the life of the study (5) (Fig. 100-3).
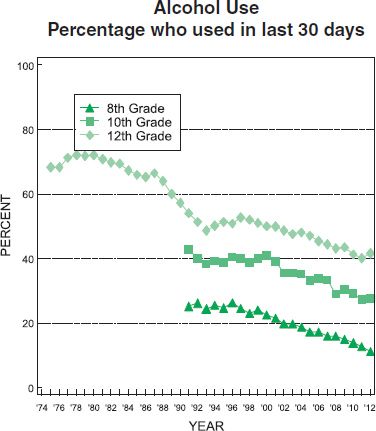
FIGURE 100-2 Alcohol. Percentage who have used in the past 30 days. (From Monitoring the Future study, University of Michigan http://www.monitoringthefuture.org/data/12data/fig12_4.pdf.)
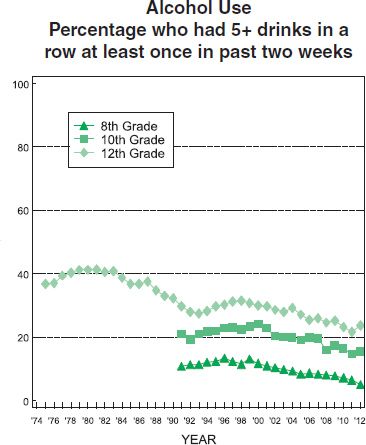
FIGURE 100-3 Alcohol. Percentage who report having 5 or more drinks in a row during past 2 weeks. (From Monitoring the Future study, University of Michigan. http://www.monitoringthefuture.org//pubs/monographs/mtf-overview2012.pdf.)
College students show different trends in alcohol use than those for 12th grade students or respondents of the same age not attending college. Between 1980 and 1993, college students showed less of a decrease in both monthly prevalence of alcohol use than 12th grade students and less of a decrease in binge drinking than 12th grade students or noncollege 19- to 22-year-olds (7) (Fig. 100-4). Heavy drinking has changed little among college students with 36.1% reporting binge drinking in 2011, modestly lower than 38.6% in 1995. Daily drinking rates of college students have generally been lower than same-age peers not attending college, suggesting a pattern of drinking primarily on weekends, when they tend to drink a lot (5). For both high school and college students, males report higher rates of binge drinking than females, though the gender differences have narrowed gradually over the duration of the survey (7).
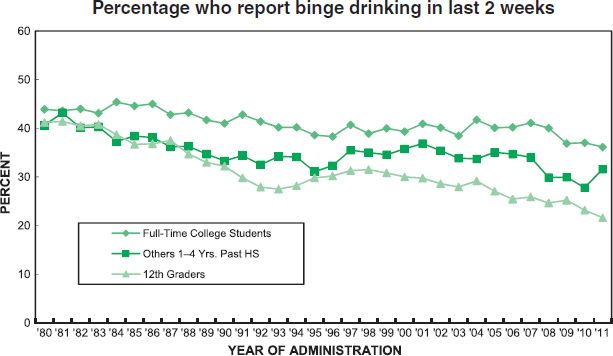
FIGURE 100-4 Alcohol. Percentage who report having 5 or more drinks in a row in the past 2 weeks: college students, others 1 to 4 years beyond high school, and 12th graders. (From Monitoring the Future. National survey results on drug use, 1975–2011: Volume II, College Students and adults ages 19–45. http://www.monitoringthefuture.org/pubs/monographs/mtf-vol2_2011.pdf.)
Tobacco
Since the survey began in 1975, cigarettes have consistently been the substance most frequently used on a daily basis by high school students. During the 1980s, smoking among adolescents did not decline, even though smoking rates were steadily decreasing among adults. Among 8th and 10th grade students, rates of those who report current smoking (defined as having smoked in the past 30 days) increased from 1991 to 1996, reaching a peak of 21.0% and 30.4%, respectively, and for 12th grade students peaking at 36.5% in 1997. Since 1996, among 8th and 10th graders and, since 1997, among 12th graders, there have been significant declines in smoking (Fig. 100-5). In 2012, 4.9% of 8th graders, 10.8% of 10th graders, and 17.1% of 12th graders reported current (within the past month) smoking. Reporting daily cigarette use were 1.9% of 8th graders, 5.0% of 10th graders, and 9.3% of 12th graders. Between 1975 and 1990, 12th grade boys and girls followed parallel trends of smoking, with a higher percentage of boys reporting daily cigarette use. From 1991 to 2006, rates of daily smoking were similar for boys and girls at all grade levels. Since 2007, rates of daily smoking have remained stable for boys, while rates for girls have decreased (5).
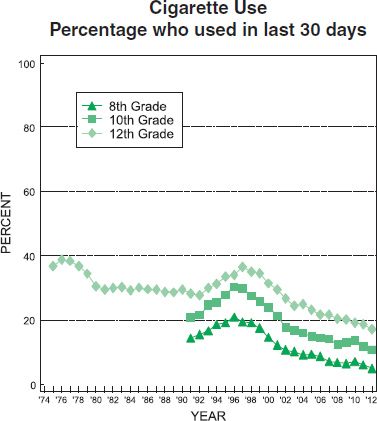
FIGURE 100-5 Cigarettes. Percentage who have used in the past 30 days. (From Monitoring the Future study, University of Michigan. http://www.monitoringthefuture.org//pubs/monographs/mtf-overview2012.pdf.)
Among college students, the current smoking rate peaked at 31% in 1991, thereafter declining steadily to 15% in 2011. Daily smoking has decreased over the same period from 19% to 7%. Age-matched adults not attending college have shown a less dramatic decrease in smoking, and their smoking rate is much higher than that of college students or 12th grade students (7). From 1980 until 1993, college females generally smoked at higher rates than males, but from 1993 through 2011, males and females have smoked at about the same rates (7).
In 2011, questions were added to Monitoring the Future about newer forms of tobacco—snus (a moist form of snuff placed under the upper lip) and dissolvable tobacco (pellets, strips, or sticks that dissolve in the mouth). In 2012, 7.9% of 12th graders reported using snus in the past year with 1.6% reporting use of dissolvable tobacco over the same period (8). Questions about smoking of tobacco by hookah water pipes were added to the survey in 2010. There has been concern that as prevalence of conventional cigarette smoking decreases, teens may turn to alternative forms of tobacco use. In 2012, 18.3% of 12th graders reported smoking with a hookah during the preceding year, but only 11% reported smoking with a hookah more than two times during the year, suggesting a considerable amount of light or experimental use. In 2012, smoking of small cigars has a similar prevalence to hookah smoking, with 20% of 12th graders reporting use in the preceding year (8).
Marijuana
Of the illicit drugs, marijuana use remains the most prevalent. Before the initiation of the Monitoring the Future study, marijuana use rose sharply during the late 1960s and early 1970s from negligible levels (9) with 1979 annual prevalence rate of 51% for 12th graders. Use gradually decreased throughout the 1980s bottoming at 22% in 1992, when use again rose sharply (5). Use again peaked in 1996 (for 8th graders) and in 1997 for 10th and 12th graders. Since 2001, all three grades have shown significant declines in annual prevalence rates. After these peak years, use declined among all three grades through 2006, 2007, or 2008, since then there has been an increase in use in for 10th and 12th graders, indicating another possible resurgence in use (Fig. 100-6). In 2012, those reporting daily marijuana use were 1.3%, 3.5%, and 6.5% of students in grades 8, 10, and 12, respectively. Twelfth graders reported the highest rate of daily use in 2011 and 2012 since 1981, when it was 7.0% (6).
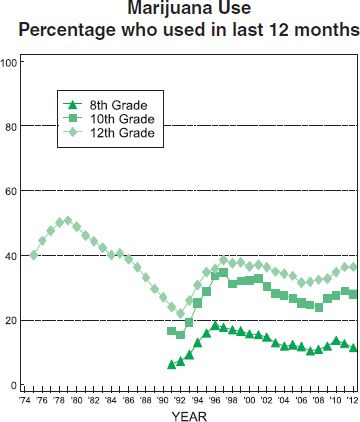
FIGURE 100-6 Marijuana. Percentage who used in past 12 months. (From the Monitoring the Future study, University of Michigan. http://www.monitoringthefuture.org//pubs/monographs/mtf-overview2012.pdf.)
Comparison of daily marijuana use between college students, young adults 1 to 4 years past high school, and 12th graders from 1980 on shows highest use has been among the young adults not attending college and lowest use among 12th graders. Rates between all groups were comparable in the early 1990s, with the rate among young adults increasing more markedly through the late 1990s. In 2011, 4.7% of college students and 9.4% of young adults reported using marijuana on a daily basis (7).
Questions about synthetic marijuana were first included in the survey in 2011. Synthetic marijuana is made by spraying synthetically produced cannabinoids on herbs or other plant materials, usually sold over the counter or through the Internet as K2, Spice, etc. In 2012, annual prevalence use among 12th graders was 11.2%, unchanged from the previous year. In 2012, 8th and 10th graders were asked about synthetic marijuana use for the first time, with annual prevalence rates of 4.4% and 8.8%, respectively. Aside from alcohol and tobacco, this is the second most widely used drug among 10th and 12th graders after marijuana and the third most widely used among 8th graders after marijuana and inhalants (10).
Amphetamines
Between 1982 and 1992, annual prevalence rates for nonprescription amphetamine use among 12th graders declined considerably, from 20.3% to 7.1% (Fig. 100-7). Among college students, rates fell even more dramatically over the same interval, from 21.1% to 3.6%. During the 1990s, annual use increased in all grades as well as in college students. In general, annual use has decreased since the late 1990s with 2.9%, 6.5%, and 7.9% of 8th, 10th, and 12th graders, respectively, in 2012 (6) and 9.3% of college students reporting in 2011 use in the preceding year (7).
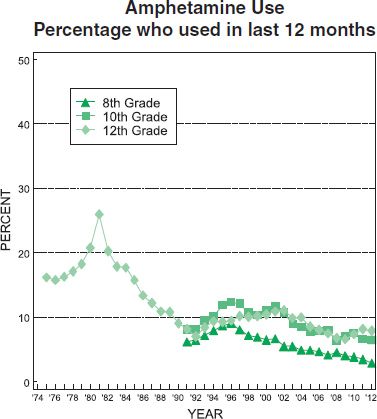
FIGURE 100-7 Amphetamines. Percentage who used in past 12 months. (From the Monitoring the Future study, University of Michigan. http://www.monitoringthefuture.org//pubs/monographs/mtf-overview2012.pdf.)
Methamphetamine
Beginning in 1990, Monitoring the Future has included questions about use of “ice” (crystallized methamphetamine, typically smoked). Use of this drug increased during the 1990s among 12th graders, college students, and young adults. Since 1999, methamphetamine use has decreased significantly among high school students with annual prevalence rates in 2012 of 1.0%, 0.8%, and 1.0% for 8th, 10th, and 12th graders, respectively (6) (Fig. 100-8). A similar decrease among college students and young adults began in 2004, reaching annual use of 0.2% and 0.1%, respectively, in 2011. Because of rising public health concerns about methamphetamine use, questions about this drug were introduced in 1999. Declines have been observed among all populations in the years since, perhaps related to significant media attention (5).
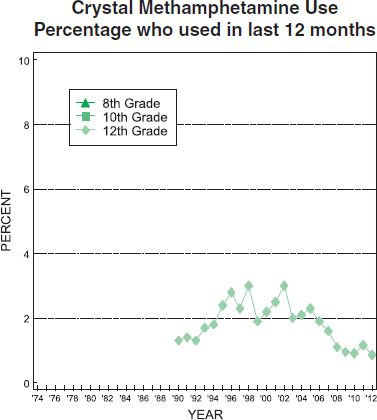
FIGURE 100-8 Crystal methamphetamine. Percentage who used in the past month. (From the Monitoring the Future study, University of Michigan.http://www.monitoringthefuture.org//pubs/monographs/mtf-overview2012.pdf.)
Ecstasy and Other “Club Drugs”
College students and young adults were first asked about ecstasy (3,4-methylenedioxy-N-methylamphetamine, MDMA) use in 1989, but questions about ecstasy were not added to the secondary school surveys until 1996. Between 1989 and 1994, annual prevalence rates were low for the older age groups, but in 1995, rates increased significantly, from 0.5% to 2.4% in college students. When first surveyed in 1996, 10th and 12th graders had higher rates of annual use (4.6% for both) than the college students (6). Between 1998 and 2001, use rates increased dramatically in high school students, college students, and young adults. Since 2001, use rates decreased for the next 2 years and have remained stable since 2003 (Fig. 100-9). In 2012, 1.1% of 8th graders, 3.0% of 10th graders, and 3.8% of 12th graders reported use of ecstasy in the preceding year (9). In 2012, annual prevalence use of gamma-hydroxybutyrate, one of the “date rape drugs,” was 1.4% for 12th grade students. For ketamine, another of these drugs, annual prevalence use for 12th graders was 1.7%. Both have shown drops since their recent peak levels of use (6).
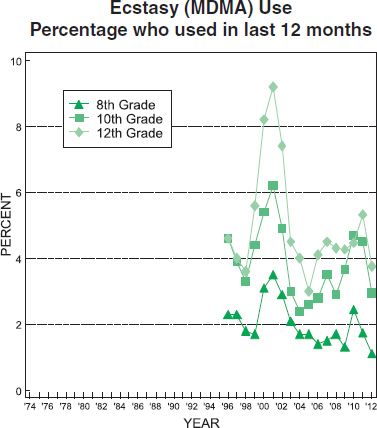
FIGURE 100-9 Ecstasy (MDMA). Percentage who used in past 12 months. (From the Monitoring the Future study, University of Michigan. http://www.monitoringthefuture.org//pubs/monographs/mtf-overview2012.pdf.)
Cocaine
Crack cocaine (the rock form of cocaine) use rapidly increased during the early 1980s. Thereafter, annual prevalence dropped sharply, where it has remained quite low, likely because of its perception as a dangerous drug (see sidebar “Adolescents’ Attitudes toward Alcohol and Other Drugs”). For powdered cocaine in general, use began to decline a year earlier than for crack. This was likely related to the intense media campaign publicizing the drug’s dangers and certainly influenced by the cocaine-related deaths of sports stars Len Bias and Don Rogers. In 2012, annual prevalence rates were 1.2%, 2.0%, and 2.7% for 8th, 10th, and 12th graders (6). In 2011, for college students and young adults not attending college, annual prevalence rates are 3.3% and 4.7% (7).
Inhalants
Inhalants include common household substances such as glues, aerosols, and solvents, inhaled to get high. Unlike most other drugs, they are used more by younger adolescents, and use tends to decline as youth grow older. Among all high school students, there was a marked increase in inhalant use during the early 1990s, followed by a decrease after 1995 (Fig. 100-10). Since 2002, inhalant use has steadily declined among all groups. In 2012, 6.2% of 8th graders, 4.1% of 10th graders, and 2.9% of 12th graders report inhalant use in the preceding year (6).
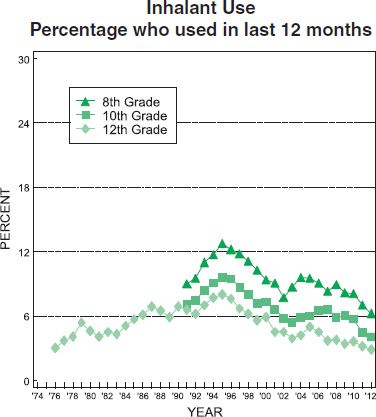
FIGURE 100-10 Inhalants. Percentage who used in past 12 months. (From the Monitoring the Future study, University of Michigan. http://www.monitoringthefuture.org//pubs/monographs/mtf-overview2012.pdf.)
Heroin
Between 1975 and 1979, the annual prevalence use of heroin among 12th graders fell from 1.0% to 0.5%, thereafter remaining stable until 1994 when use increased for 8th, 10th, and 12th graders. This upturn was likely related to the decline in perceived risk as well as the availability of more pure heroin that allowed use by means other than injection (6). For 12th graders, college students, and young adults, rates doubled or tripled over 1 to 2 years in the mid-1990s, remaining at the new higher levels for the rest of the decade (7). Between 2000 and 2002, use began to decrease, and in 2011, all groups had annual prevalence rates below the recent peaks. In 2012, annual prevalence rates for heroin use without a needle were 0.3% for 8th grade students and 0.4% for 10th and 12th grade students. For all three grades, annual prevalence use of heroin with a needle was 0.4% (10).
Nonmedical Use of Prescription Medications
Nonmedical use of prescription medications refers to use of a scheduled prescription medication (narcotics, stimulants, and tranquilizers/sedatives) outside of medical supervision. Though the proportion of 12th graders who report non-medical use of prescription medications has remained stable since 2008, annual prevalence use in 2012 was still high with 14.8% reporting use in the past year. Young people may perceive prescription drugs as less harmful compared with illicit or “street” drugs and, therefore, may be more inclined to use them (11). Concerns have arisen regarding youth initiating narcotic use with oral prescription medications and quickly becoming dependent, necessitating switching to intranasal and injectable drugs like heroin due to economic necessity. The sources of such prescription drugs remain primarily friends and, to a lesser extent, relatives (10).
For 12th grade students, use of narcotics other than heroin trended down from 1977 through 1992. After 1992, use rose sharply with annual prevalence use reaching 9.5% in 2004 before leveling. In 2002, specific questions were added about OxyContin, Vicodin, and Percocet use. Since then, OxyContin use has increased some in all grades with annual prevalence rates 1.6%, 3.0%, and 4.3% for 8th, 10th, and 12th grade students, respectively, in 2012. Use of Vicodin has been steady at higher levels with annual prevalence rates of 1.3%, 4.4%, and 7.5% for 8th, 10th, and 12th grade students (6).
During the late 1970s and all of the 1980s, tranquilizer use decreased dramatically, again increasing during the 1990s until 2002 after which there was a gradual decline. Twelfth graders reached their lowest level of annual prevalence in 2012 since 2002. In 2012, annual prevalence rates were 1.8%, 4.5%, and 5.3% in grades 8, 10, and 12, respectively. Similarly, sedative use decreased beginning in the mid-1970s until 1992 and then increased through 2005 after which use again decreased. In 2012, the annual prevalence rate for 12th graders was 4.5% (5).
Use of prescription stimulants such as Adderall and Ritalin for nonmedical use remains a concern, especially as use can be seen as “performance enhancing” for academic work by students as well as for obtaining a high. Use of Ritalin has trended downward at 8th, 10th, and 12th grade levels from 2001, when illicit use was first measured, to 2012. Adderall use, first measured specifically by name in 2009, has also trended downward for 8th and 10th graders, but has risen from 5.4% reporting annual use in 2009 to 7.6% in 2012 for 12th graders (6). College students report annual use of Adderall at 9.8% in 2011, compared to 2.3% reporting use of Ritalin (7).
Strength Enhancement Drugs
Questions about anabolic steroid use were first included in the 1989 survey. At that time, 1.9% of 12th graders reported annual use, which dropped to 1.1% by 1992 and then slowly increased to 1.8% by 1999. Use rose to 2.5% by 2002, where it remained until 2005, when it dropped to 1.5%. Annual prevalence use for 12th graders was 1.2% in 2011; however, 2.3% of males reported use compared to only 0.6% of females (5). The 2011 annual prevalence rates for androstenedione (andro) are 0.6%, 0.8%, and 0.7% for students in grades 8, 10, and 12, respectively. The annual prevalence use for creatine in 2011 was 1.9%, 7.1%, and 8.6% in grades 8, 10, and 12, respectively. Creatine is widely available over the counter, whereas androstenedione was made illegal in 2005, likely explaining the higher use of creatine. As with anabolic steroids, significantly more males report use of creatine with 16.1% of 12th grade males and 1.0% of females reporting use in the preceding year (5).
Bath Salts
Questions about “bath salts,” which contain synthetic cathinones, stimulants that have effects similar to amphetamines, were included in the survey for the first time in 2012. The annual prevalence rates were 0.8%, 0.6%, and 1.3% for grades 8, 10, and 12, respectively. Calls to poison control centers about bath salts increased dramatically after 2010, with over 6,000 calls in 2011. During 2012, that number fell to 2,654, likely due to the Drug Enforcement Administration scheduling some of the chemicals in bath salts and to widespread publicity about their dangers (10,12).
MORE FREQUENT USE
Much of the previous trend data focuses on annual or lifetime prevalence use of individual drugs. Experimentation is a normal part of adolescent development; rare or occasional use of a substance may not constitute problem use for most individuals. Frequency of use provides a more accurate measure of problem use. For marijuana, the percentage of 12th graders who reported daily use (used at least 20 of the preceding 30 days) peaked in the late 1970s at 10.7%, dropped steadily until 1992 (1.9%), and then increased significantly through 1997, reaching 5.8%. The rates were stable through 2009 (5.2%) and have again increased in 2011 at 6.6%, the highest prevalence rate seen in the last 30 years. Looking at it another way, among 12th graders, 1 out of 15, or 1 to 2 students in each classroom, smokes marijuana daily (6) (Table 100-1).
TABLE 100-1 PREVALENCE OF PROBLEM USE, 2012
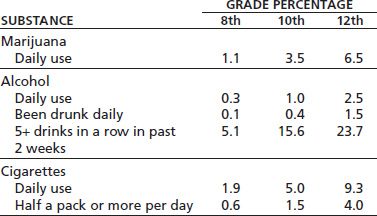
Adapted from the Monitoring the Future study, University of Michigan. http://www.monitoringthefuture.org/pubs/monographs/mtf-overview2012.pdf
MULTIPLE DRUG USE
Though it is important to examine individual drug use patterns over time, many adolescents are using more than one substance and modify their drug use patterns over time. Assessing drug sequence patterns, Yamaguchi and Kandel (13) found that adolescent drug use typically begins with alcohol or cigarette use, followed by marijuana use, and then by other illicit drugs, a finding that has been confirmed by other studies. Golub and Johnson (14) demonstrated a change over time of the probabilities of progression, with those born after the 1960s being substantially less likely to progress from cigarette and alcohol use to marijuana, cocaine, and heroin use. Further research using international data from the World Health Organization World Mental Health Surveys indicates that initiation of “gateway substances” (i.e., alcohol, tobacco, and cannabis) was differentially associated with subsequent onset of other illicit drug use based on background prevalence of the gateway substances, with likely influence of access and/or attitudes about substance use shaping the order of initiation. Changes in order of substance use onset did not appear to affect risk for later dependence. Results of the study imply that prevention efforts to deter substance abuse are likely better targeted at all types of drug use, the early onset of use, and use by youth with other risk behaviors (15).
None of the national surveys cited here includes population information about adolescents who use multiple substances. Martin et al. (16) found that among adolescent alcohol users, significantly more who had been diagnosed with alcohol dependence or abuse reported recent use of other drugs than users without an alcohol diagnosis. Examination of drug patterns over time, including typical sequence of drug use, can provide additional valuable information to guide prevention and intervention efforts.
CORRELATES OF SUBSTANCE USE
Among ethnic/racial subgroups, there are varying associations with substance use. When looking at differences among African American, Hispanic, and white students, it is seen that African American students have lower rates of use of most licit and illicit drugs than white students at all three grade levels. In addition, cigarette use among African Americans has been dramatically lower than for whites throughout the survey’s history (5). Hispanic students in 12th grade have rates of use generally between the two groups, though generally closer to those of whites. For use of some drugs, specifically methamphetamine, crack, cocaine, and inhalants, Hispanics in 12th grade have the highest use. In 8th grade, Hispanics show the highest use for almost all classes of drugs (17).
For illicit drugs, higher proportions of males than females report use, particularly heavy use. For example, daily marijuana use among males is twice that of females. In the lower grades, however, there is little gender difference in use for many drugs and greater use of some drugs among females. In 2011, 8th grade females reported higher use of inhalants, crack, amphetamines, and methamphetamine, among others (5). With alcohol use, males have generally had higher rates of heavy drinking; however, the difference has been diminishing. In 2011, 18% of 12th grade females and 26% of males reported binge drinking, a difference of 8% points contrasting to a 23% point difference in 1975 (5).
Students who report plans to complete 4 years of college have lower rates of licit and illicit drug use in secondary school than those who say they are unlikely to complete college. The difference is particularly striking for daily cigarette use, with 2.8% of college-bound 12th graders reporting smoking a half pack or more daily compared to 11.1% of those who are not college bound (5).
CONCLUSIONS
Examination of the epidemiology of substance use has played an important role in understanding the etiology of drug use as well giving valuable insight into the attitudes and norms that influence substance use. Ongoing analysis of use and attitude trends will continue to provide important information for development of public health strategies to combat adolescent substance use. Examination of epidemiologic trends will also aid in the development of research and education priorities to further our knowledge in this area.

The Monitoring the Future study includes questions about perceived harmfulness of individual drugs and the degree to which the adolescent disapproves of the drug. Understanding attitudes about drug is essential for interpretation of use trends as well as for the development of effective interventions. Adolescents’ attitudes toward alcohol and other drugs influence their decisions about whether to use those substances.
Overall, the Monitoring the Future data show inverse relationships between the level of drug use and both the perceived harmfulness and disapproval of that drug. Of the illicit drugs, marijuana has the highest level of use and one of the lowest levels of perceived risk and disapproval. In contrast, cocaine, perceived as a high-risk drug, has lower levels of use (1).
Over the lifetime of the study, many attitudes and beliefs have changed dramatically. The trends for marijuana use and attitudes strikingly illustrate the relationship between perceived harm and use (Fig. 100-11). Between 1975 and 1978, perceived harm of marijuana decreased markedly as use sharply increased. Beginning in 1979, the media gave attention to increasing rates of marijuana use and potential risks of the drug. Subsequently, the attitudes and beliefs among 12th graders shifted during the next decade. In 1992, perceived risk began to drop again, followed by a sharp increase in use beginning in 1993 (1).
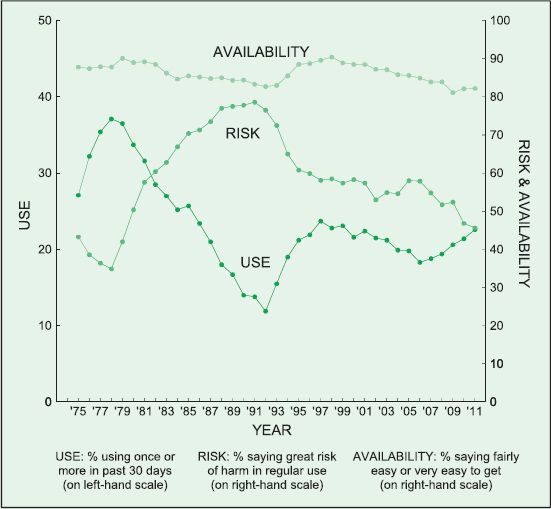
FIGURE 100-11 Marijuana. Trends in perceived availability, perceived risk of regular use, and prevalence of use in past 30 days in grade 12. (From Monitoring the Future study, University of Michigan. http://www.monitoringthefuture.org/pubs/monographs/mtf-vol1_2011.pdf.)
Stay updated, free articles. Join our Telegram channel

Full access? Get Clinical Tree


