CHAPTER 16 Elements of Cardiac Function
ELECTRICAL PROPERTIES OF THE HEART
The Cardiac Action Potential
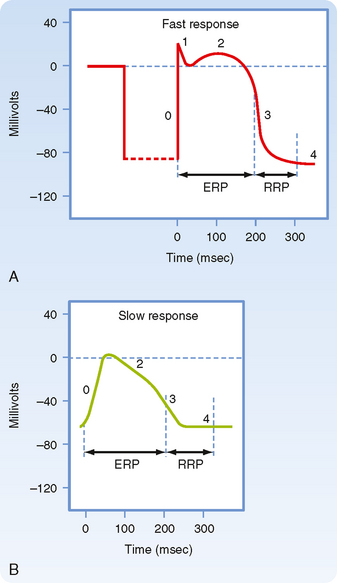
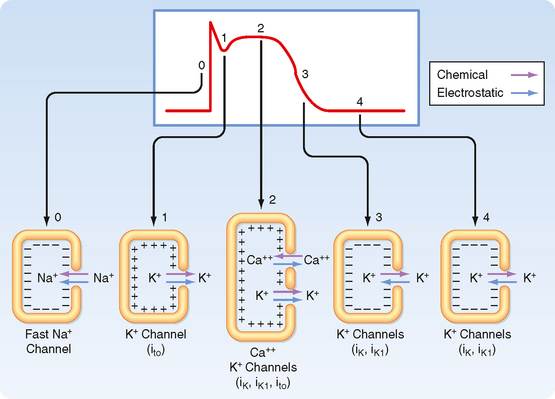
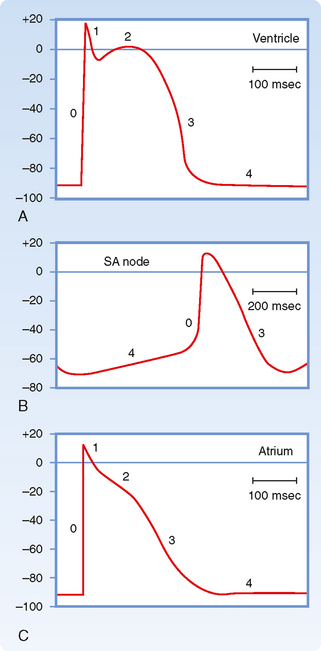
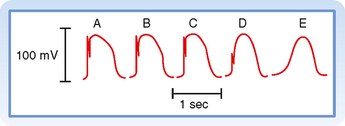
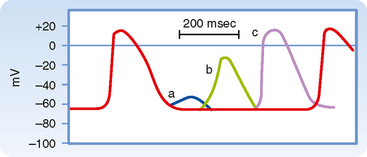
Figure 16-1 illustrates action potentials found in different cardiac cells. Two main types of action potentials occur in the heart and are shown. One type, the fast response, occurs in normal atrial and ventricular myocytes and in the specialized conducting fibers (Purkinje fibers of the heart) and is divided into five phases. The rapid upstroke of the action potential is designated phase 0. The upstroke is followed by a brief period of partial, early repolarization (phase 1) and then by a plateau (phase 2) that persists for about 0.1 to 0.2 second. The membrane then repolarizes (phase 3) until the resting state of polarization (phase 4) is again attained (at point e). Final repolarization (phase 3) develops more slowly than depolarization (phase 0). The other type of action potential, the slow response, occurs in the sinoatrial (SA) node, which is the natural pacemaker region of the heart, and in the atrioventricular (AV) node, which is the specialized tissue that conducts the cardiac impulse from the atria to the ventricles. The slow-response cells lack the early repolarization phase (phase 1). Other differences between the electrical properties of the fast-response and slow-response cells include the following. The resting membrane potential (phase 4) of the fast-response cells is considerably more negative than that of the slow-response cells. Moreover, the slope of the upstroke (phase 0), the amplitude of the action potential, and the overshoot are greater in the fast-response than in the slow-response cells. The action potential amplitude and the steepness of the upstroke are important determinants of propagation velocity along the myocardial fibers. In slow-response cardiac tissue, the action potential is propagated more slowly and conduction is more likely to be blocked than in fast-response cardiac tissue. Slow conduction and a tendency toward conduction block increase the likelihood of some rhythm disturbances (see the section Reentry).
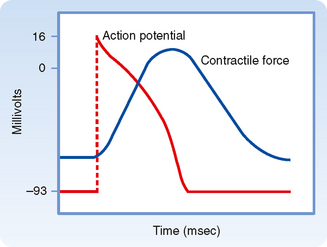
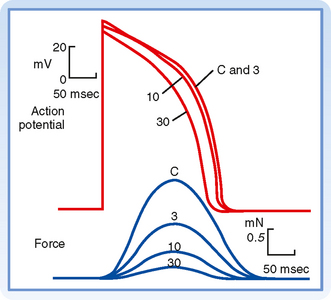
As noted, the action potential initiates contraction of the myocyte. The relationships between the action potential and contraction of cardiac muscle are shown in Figure 16-2. Rapid depolarization (phase 0) precedes the development of force, and completion of repolarization coincides approximately with peak force. Relaxation of the muscle takes place mainly during phase 4 of the action potential. The duration of contraction usually parallels the duration of the action potential.
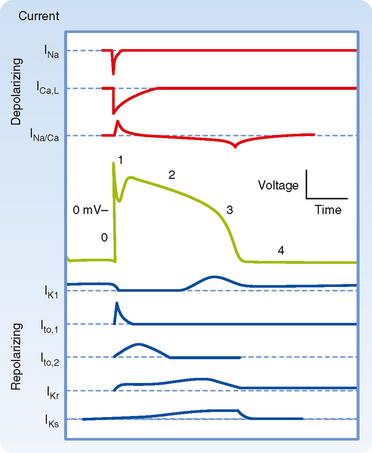
The various phases of the cardiac action potential are associated with changes in cell membrane permeability, mainly to Na+, K+, and Ca++ ions. Changes in cell membrane permeability alter the rate of movement of these ions across the membrane and thereby change the membrane voltage (Vm). These changes in permeability are accomplished by the opening and closing of ion channels that are specific for individual ions (see Chapters 1 and 2).
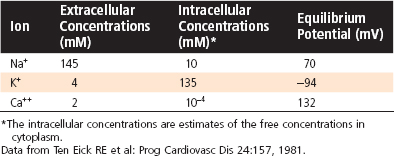
As with all other cells in the body, the concentration of K+ inside a cardiac muscle cell ([K+]i) exceeds the concentration outside the cell ([K+]o). The reverse concentration gradient exists for Na+ and Ca++. Estimates of the extracellular and intracellular concentrations of Na+, K+, and Ca++ and the Nernst equilibrium potentials (see Chapter 1) for these ions are compiled in Table 16-1.
Table 16-1 Intracellular and Extracellular Ion Concentrations and Equilibrium Potentials in Cardiac Muscle Cells
Resting Membrane Voltage
The dependence of Vm on conductance and the intracellular and extracellular concentrations of K+, Na+, and other ions is described by the chord conductance equation (see Chapter 2). In a resting cardiac cell, conductance to K+ (gK) is about 100 times greater than conductance to Na+ (gNa). Therefore, Vm is similar to the Nernst equilibrium potential for K+. As a result, alterations in extracellular [K+] can significantly change Vm, with hypokalemia causing hyperpolarization and hyperkalemia causing depolarization. In contrast, because gNa is so small in the resting cell, changes in [Na+]o do not significantly affect Vm.
Fast responses may change to slow responses under certain pathological conditions. For example, in coronary artery disease, a region of cardiac muscle may be deprived of its normal blood supply. As a result, [K+] in the interstitial fluid that surrounds the affected muscle cells rises because K+ is lost from the inadequately perfused (or ischemic) cells. The action potentials in some of these cells may then be converted from fast to slow responses. Conversion from a fast to a slow response as a result of increasing interstitial [K+] is illustrated later in Figure 16-13.
Fast-Response Action Potentials
Genesis of the Upstroke (Phase 0)
Any stimulus that abruptly depolarizes Vm to a critical value (called the threshold) elicits an action potential. The characteristics of fast-response action potentials are shown in Figure 16-1, A. The rapid depolarization (phase 0) is related almost exclusively to the influx of Na+ into the myocyte as a result of a sudden increase in gNa. The action potential amplitude (the potential change during phase 0) is dependent on [Na+]o. When [Na+]o is decreased, the amplitude of the action potential decreases, and when [Na+]o is reduced from its normal value of about 140 mEq/L to about 20 mEq/L, the cell is no longer excitable.
When the resting membrane potential, Vm, is suddenly depolarized from −90 mV to the threshold level of about −65 mV, the cell membrane properties change dramatically. Na+ enters the myocyte through specific fast voltage-activated Na+ channels that exist in the membrane. These channels can be blocked by the puffer fish toxin tetrodotoxin. In addition, many drugs used to treat certain cardiac rhythm disturbances (cardiac arrhythmias) act by blocking these fast Na+ channels.
The Na+ channels open very rapidly or activate (in about 0.1 msec), thereby resulting in an abrupt increase in gNa. However, once open, the Na+ channels inactivate (time course ≈ 1 to 2 msec), and gNa rapidly decreases (Fig. 16-3). The Na+ channels remain in the inactivated state until the membrane begins to repolarize. With repolarization, the channel transitions to the closed state, from which it can then be reopened by another depolarization of Vm to the threshold. These properties of the Na+ channel underlie the basis of the action potential refractory period. When the Na+ channels are in the inactivated state, they cannot be reopened, and another action potential cannot be generated. During this period the cell is said to be in the effective refractory period. This prevents a sustained, tetanic contraction of cardiac muscle, which would retard ventricular relaxation and therefore interfere with the normal intermittent pumping action of the heart. As the cell repolarizes (phase 3), the inactivated channels begin to transition to the closed state. During this period, called the relative refractory period, another action potential can be generated, but it requires a larger than normal depolarization of Vm. Only when Vm has returned to the resting level (phase 4) are all the Na+ channels closed and thus able to be reactivated by the normal depolarization of Vm.
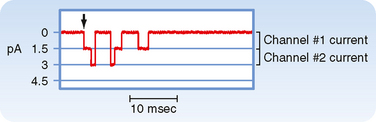
Ionic currents through single membrane channels can be measured with the patch clamp technique. The individual channels open and close repeatedly in a random manner. This process is illustrated in Figure 16-4, which shows the current flow through single Na+ channels in a myocardial cell. To the left of the arrow, the membrane potential was clamped at −85 mV. At the arrow, the potential was suddenly changed to −45 mV, at which value it was held for the remainder of the record. Figure 16-4 indicates that immediately after the membrane potential was made less negative, one Na+ channel opened three times in sequence. It remained open for about 2 or 3 msec each time and closed for about 4 or 5 msec between openings. In the open state it allowed 1.5 pA of current to pass. During the first and second openings of this channel, a second channel also opened, but for periods of only 1 msec. During the brief times that both channels were open simultaneously, the total current was 3 pA. After the first channel closed for the third time, both channels remained closed for the rest of the recording, even though the membrane was held constant at −45 mV.
Genesis of Early Repolarization (Phase 1)
In many cardiac cells that have a prominent plateau, phase 1 is an early, brief period of limited repolarization. This brief repolarization results in the notch between the end of the upstroke and the beginning of the plateau (Figs. 16-1 and 16-3). Repolarization is brief because of activation of a transient outward current (ito) carried mainly by K+. Activation of K+ channels during phase 1 causes a brief efflux of K+ from the cell because the cell interior is positively charged and [K+]i greatly exceeds [K+]o (Fig. 16-3). The cell is briefly and partially repolarized as a result of this transient efflux of K+.
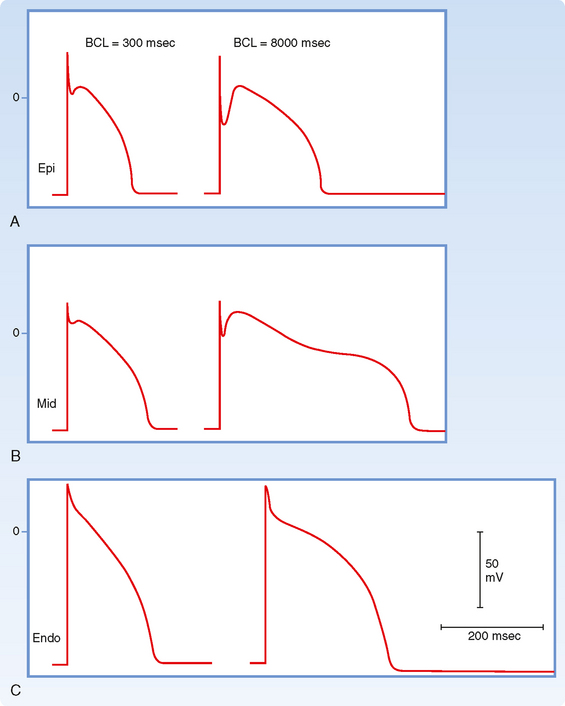
The size of the phase 1 notch varies among cardiac cells. It is prominent in myocytes in the epicardial and midmyocardial regions of the left ventricular wall (Fig. 16-5) and in ventricular Purkinje fibers. However, the notch is negligible in myocytes from the endocardial region of the left ventricle (Fig. 16-5) because the density of ito channels is less in these cells. The notch is also less prominent in the presence of 4-aminopyridine, which blocks the K+ channels that carry ito.
Genesis of the Plateau (Phase 2)
During the action potential plateau, Ca++ enters myocardial cells through calcium channels (see later) that activate and inactivate much more slowly than the fast Na+ channels do. During the flat portion of phase 2 (Figs. 16-1 and 16-3), this influx of Ca++ is counterbalanced by the efflux of K+. K+ exits through channels that conduct mainly the ito, iK, and iK1 currents. The ito current is responsible for phase 1, as described previously, but it is not completely inactivated until after phase 2 has expired. The iK and iK1 currents are described later in this chapter.
Ca++ enters the cell via voltage-regulated Ca++ channels, which are activated as Vm becomes progressively less negative during the action potential upstroke. Two types of Ca++ channels (L type and T type) have been identified in cardiac tissue. Some of their important characteristics are illustrated in Figure 16-6. L-type channels are so designated because once open they inactivate slowly (Fig. 16-6, lower panel) and provide a “long-lasting” Ca++ current. They are the predominant type of Ca++ channel in the heart, and they are activated during the action potential upstroke when Vm reaches about −20 mV. L-type channels are blocked by Ca++ channel antagonists such as verapamil, amlodipine, and diltiazem (Fig. 16-7).
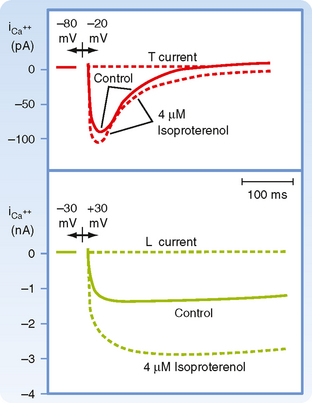
T-type (or “transient”) Ca++ channels are much less abundant in the heart. They are activated at more negative potentials (about −70 mV) than L-type channels are. They also inactivate more quickly than L-type channels do (Fig. 16-6, upper panel).
Because L-type channels are the most abundant, the following is focused on their function and properties. Opening of Ca++ channels results in an increase in Ca++ conductance (gCa) and current (iCa) soon after the action potential upstroke (Fig. 16-3). Because [Ca++]i is much less than [Ca++]o (Table 16-1), the increase in gCa promotes the influx of Ca++ into the cell throughout the plateau. This Ca++ influx during the plateau is involved in excitation-contraction coupling, as described later (see also Chapter 13).
During the plateau (phase 2) of the action potential, the concentration gradient for K+ across the cell membrane is virtually the same as it is during phase 4. However, Vm is now positive. Therefore, there is a large gradient that favors efflux of K+ from the cell (Fig. 16-3). If gK were the same during the plateau as it is during phase 4, efflux of K+ during phase 2 would greatly exceed the influx of Ca++, and a sustained plateau could not be achieved. However, as Vm approaches and then attains positive values near the peak of the action potential upstroke, gK suddenly decreases (Fig. 16-8). The diminished K+ current associated with the reduction in gK prevents excessive loss of K+ from the cell during the plateau.
To enhance gCa, catecholamines first bind to βadrenergic receptors in the cardiac cell membrane. This interaction stimulates the membrane-bound enzyme adenylyl cyclase, which raises the intracellular concentration of cAMP (see also Chapter 3). The rise in the level of cAMP activates cAMP-dependent protein kinase, which in turn promotes phosphorylation of the L-type Ca++ channels in the cell membrane and thus augments the influx of Ca++ into the cells (Fig. 16-6). Conversely, acetylcholine interacts with muscarinic receptors in the cell membrane to inhibit adenylyl cyclase. In this way, acetylcholine antagonizes the activation of Ca++ channels and thereby diminishes gCa.
Ca++ channel antagonists are substances that block Ca++ channels. Examples include the drugs verapamil, amlodipine, and diltiazem. These drugs decrease gCa and thereby impede the influx of Ca++ into myocardial cells. Ca++ channel antagonists decrease the duration of the action potential plateau and diminish the strength of the cardiac contraction (Fig. 16-7). Ca++ channel antagonists also depress the contraction of vascular smooth muscle and thereby induce generalized vasodilation. This diminished vascular resistance reduces the counterforce (afterload) that opposes the propulsion of blood from the ventricles into the arterial system, as explained in Chapter 17. Hence, vasodilator drugs such as the Ca++ channel antagonists are often referred to as afterload-reducing drugs.
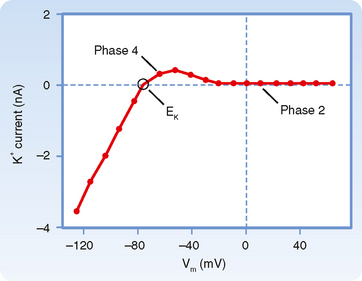
This reduction in gK at both positive and low negative values of Vm is called inward rectification. Inward rectification is a characteristic of several K+ currents, including the iK1 current (Fig. 16-9). For these channels, large K+ currents flow at negative values of Vm (i.e., gK is large). However, when Vm is near 0 mV, or positive, as occurs during the plateau (phase 2), little or no K+ current flows (i.e., gK is low). Thus, the substantial gK that prevails during phase 4 of the cardiac action potential (Fig. 16-8) is largely due to the iK1 channels, but current through these channels is greatly diminished during the plateau (Fig. 16-9).
Other K+ channels play a role in phase 2 of the action potential. These are characterized as delayed rectifier (iK) channels. These K+ channels are closed during phase 4 and are activated very slowly by the potentials that prevail toward the end of phase 0. Hence, activation of these channels tends to increase gK very gradually during phase 2. These channels play only a minor role during phase 2, but they contribute to the process of final repolarization (phase 3), as described later. Two types of iK channels exist, depending on their rates of activation. The more slowly activating channel is designated the iKs channel, whereas the more rapidly activating channel is designated the iKr channel (Fig. 16-8). The duration of the action potential in myocytes in various regions of the ventricular myocardium is determined in part by the relative distributions of these iKr and iKs channels.
The action potential plateau persists as long as the efflux of charge carried mainly by K+ is balanced by the influx of charge carried mainly by Ca++. The effects of altering this balance are demonstrated by the action of the Ca++ channel antagonist diltiazem in an isolated papillary muscle preparation (Fig. 16-7). With increasing concentrations of diltiazem, the plateau voltage becomes progressively less positive and the plateau duration diminishes. Conversely, administration of certain K+ channel antagonists prolongs the plateau substantially.
Genesis of Final Repolarization (Phase 3)
The process of final repolarization (phase 3) starts at the end of phase 2, when efflux of K+ from the cardiac cell begins to exceed influx of Ca++. As noted, at least three outward K+ currents (ito, iK, and iK1) contribute to the final repolarization (phase 3) of the cardiac cell (Figs. 16-3 and 16-8).
The transient outward (ito) and the delayed rectifier (iKr, iKs) currents help initiate repolarization. These currents are therefore important determinants of the duration of the plateau. For example, the duration of the plateau is substantially less in atrial than in ventricular myocytes (Fig. 16-10) because the magnitude of ito during the plateau is greater in atrial than in ventricular myocytes. As already noted, the duration of the action potential in ventricular myocytes varies considerably with the location of these myocytes in the ventricular walls (Fig. 16-5). The ito and delayed rectifier (iK) currents mainly account for these differences. In endocardial myocytes, in which the duration of the action potential is least, the magnitude of iK is greatest. The converse applies to the midmyocardial myocytes. The magnitude of iK and the duration of the action potential are intermediate for epicardial myocytes.
The inwardly rectified K+ current iK1 does not participate in the initiation of repolarization because the conductance of these channels is very small over the range of Vm values that prevail during the plateau. However, the iK1 channels contribute substantially to the rate of repolarization once phase 3 has been initiated. As Vm becomes increasingly negative during phase 3, the conductance of the channels that carry the iK1 current progressively increases and thereby accelerates repolarization (Fig. 16-3).
Restoration of Ionic Concentrations (Phase 4)
The steady inward leak of Na+ that enters the cell rapidly during phase 0 and more slowly throughout the cardiac cycle would gradually depolarize the resting membrane voltage were it not for Na+,K+-ATPase, which is located in the cell membrane (see Chapter 1). Similarly, most of the excess Ca++ ions that had entered the cell mainly during phase 2 are eliminated principally by a 3Na+-1Ca++ antiporter, which exchanges 3 Na+ ions for 1 Ca++ ion. However, some of the Ca++ ions are eliminated by an ATP-driven Ca++ pump.
Slow-Response Action Potentials
As described earlier, fast-response action potentials (Fig. 16-1, A) consist of four principal components: an upstroke (phase 0), an early partial repolarization (phase 1), a plateau (phase 2), and a final repolarization (phase 3). However, in the slow-response action potential (Fig. 16-1, B), the upstroke is much less steep, early repolarization (phase 1) is absent, the plateau is less prolonged and not as flat, and the transition from the plateau to the final repolarization is less distinct.
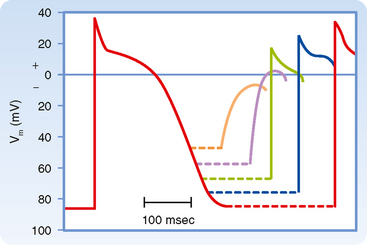
Blocking fast Na+ channels with tetrodotoxin in a fast-response fiber can generate slow responses under appropriate conditions. The Purkinje fiber action potential shown in Figure 16-11 clearly exhibits the two response types. In the control tracing (A), the typical fast-response action potential displays a prominent notch as a result of ito that separates the upstroke from the plateau. In action potentials B to E, progressively larger quantities of tetrodotoxin produce a graded blockade of the fast Na+ channels. The upstroke and notch become progressively less prominent in action potentials B to D. In action potential E, the notch has disappeared and the upstroke is very gradual; this action potential resembles a typical slow response.
Certain cells in the heart, notably those in the SA and AV nodes, exhibit slow-response action potentials. In these cells, depolarization is achieved mainly by influx of Ca++ through L-type Ca++ channels instead of influx of Na+ through fast Na+ channels. Repolarization is accomplished in these fibers by inactivation of the Ca++ channels and by the increased K+ conductance through the iK1 and iK channels (Fig. 16-3).
CONDUCTION IN CARDIAC FIBERS
An action potential traveling along a cardiac muscle fiber is propagated by local circuit currents, much as it is in nerve and skeletal muscle fibers (see Chapter 5). When the wave of depolarization reaches the end of the cell, the impulse is conducted to adjacent cells through gap junctions (see Chapter 2). Impulses pass more readily along the length of the cell (isotropic) than laterally from cell to cell (anisotropic) because gap junctions are preferentially located at the ends of the cell. These channels are rather nonselective in their permeability to ions and have a low electrical resistance that allows ionic current to pass from one cell to another. The electrical resistance of gap junctions is similar to that of cytoplasm. The flow of charge from cell to cell follows the principles of local circuit currents and therefore allows intercellular propagation of the impulse.
Conduction of the Fast Response
The characteristics of conduction differ in fast- and slow-response fibers. In fast-response fibers, fast Na+ channels are activated when the transmembrane potential of one region of the fiber suddenly changes from a resting value of about −90 mV to the threshold value of about −65 mV. The inward Na+ current then rapidly depolarizes the cell at that site. This portion of the fiber subsequently becomes part of the depolarized zone, and the border is displaced accordingly. The same process then begins at the new border. This process is repeated again and again, and the border moves continuously down the fiber as a wave of depolarization (Fig. 16-12).
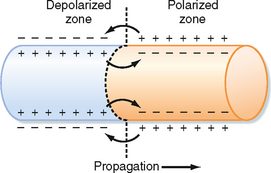
Figure 16-12 The role of local currents in the propagation of a wave of excitation down a cardiac fiber.
The conduction velocity along the fiber varies directly with the amplitude of the action potential and the rate of change of the potential (dVm/dt) during phase 0. The amplitude of the action potential equals the potential difference between the fully depolarized and the fully polarized regions of the cell interior. The magnitude of the local current is proportional to this potential difference (see Chapter 5). Because these local currents shift the potential of the resting zone toward the threshold value, they are local stimuli that depolarize the adjacent resting portion of the fiber to its threshold potential. The greater the potential difference between the depolarized and polarized regions (i.e., the greater the action potential amplitude), the more effective are local stimuli in depolarizing adjacent parts of the membrane and the more rapidly is the wave of depolarization propagated down the fiber.
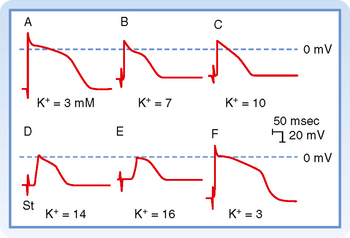
The resting membrane potential is also an important determinant of conduction velocity. Changes in the resting membrane potential influence both the amplitude of the action potential and the slope of the upstroke, which in turn alter the conduction velocity (Fig. 16-13). Depolarization of Vm leads to inactivation of the fast Na+ channels, which in turn decreases the amplitude of the action potential and the slope of the upstroke, and as a consequence conduction velocity is slowed. In addition to changes in [K+]o, premature excitation of a cell that has not completely repolarized will also result in a decrease in conduction velocity. This too reflects the fact that when Vm is depolarized, more fast Na+ channels are inactivated, and thus only a fraction of the Na+ channels are available to conduct the inward Na+ current during phase 0.
Conduction of the Slow Response
Local circuits (Fig. 16-12) also propagate the slow response, the conduction characteristics of which differ quantitatively from those of the fast response. The threshold potential is about −40 mV for the slow response, and conduction is much slower than for the fast response. The conduction velocities of the slow response in the SA and AV nodes are about 0.02 to 0.1 m/sec. The fast-response conduction velocities are about 0.3 to 1 m/sec for myocardial cells and 1 to 4 m/sec for the specialized conducting (Purkinje) fibers in the ventricles. Slow responses are more readily blocked than fast responses; that is, conduction ceases before the impulse reaches the end of the myocardial fiber. In addition, fast-response fibers can respond at repetition rates that are much greater than those of slow-response fibers.
Most of the experimentally induced changes in transmembrane potential shown in Figure 16-13 also take place in the cardiac tissue of patients with coronary artery disease. When blood flow to a region of the myocardium is diminished, the supply of O2 and metabolic substrates delivered to the ischemic tissues is insufficient. The Na+,K+-ATPase in the membrane of cardiac myocytes requires considerable metabolic energy to maintain the normal transmembrane exchanges of Na+ and K+. When blood flow is inadequate, the activity of Na+,K+-ATPase is impaired, and the ischemic myocytes gain excess Na+ and lose K+ to the surrounding interstitial space. Consequently, [K+]o in the extracellular fluid surrounding the ischemic myocytes is elevated. Hence, the myocytes are affected by the elevated [K+]o in much the same way as the myocyte depicted in Figure 16-13. Such changes in [K+]o may disturb cardiac rhythm and conduction critically.
CARDIAC EXCITABILITY
Fast Response
Once the fast response has been initiated, the depolarized cell is no longer excitable until the cell has partially repolarized (Fig. 16-1, A). The interval from the beginning of the action potential until the fiber is able to conduct another action potential is called the effective refractory period. In the fast response, this period extends from the beginning of phase 0 to a point in phase 3 at which repolarization has reached about −50 mV (phase 3 in Fig. 16-1, A). At about this value of Vm, many of the fast Na+ channels have transitioned from the inactivated to the closed state. However, the cardiac fiber is not fully excitable until it has been completely repolarized. Before complete repolarization (i.e., during the relative refractory period), an action potential may be evoked only when the stimulus is stronger than a stimulus that could elicit a response during phase 4.
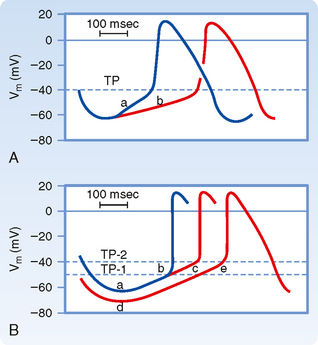
When a fast response is evoked during the relative refractory period of a previous excitation, its characteristics vary with the membrane potential that exists at the time of stimulation (Fig. 16-14). The later in the relative refractory period that the fiber is stimulated, the greater the increase in the amplitude of the response and the slope of the upstroke because the number of fast Na+ channels that have recovered from inactivation increases as repolarization proceeds. As a consequence, propagation velocity also increases the later in the relative refractory period that the fiber is stimulated. Once the fiber is fully repolarized, the response is constant no matter what time in phase 4 the stimulus is applied.
Slow Response
In slow-response fibers, the relative refractory period frequently extends well beyond phase 3 (Fig. 16-1, B). Even after the cell has completely repolarized, it may be difficult to evoke a propagated response for some time. This characteristic of slow-response fibers is called postrepolarization refractoriness.
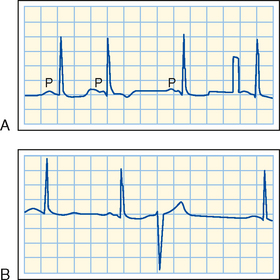
In a patient who has occasional premature depolarizations (Fig. 16-32), the timing of these early beats may determine their clinical consequence. If they occur late in the relative refractory period of the preceding depolarization, or after full repolarization, the premature depolarization is probably inconsequential. However, if the premature depolarizations originate early in the relative refractory period of the ventricles, conduction of the premature impulse from the site of origin will be slow, and hence reentry is more likely to occur. If that reentry is irregular (i.e., if ventricular fibrillation ensues), the heart cannot pump effectively and death may result.
Action potentials evoked early in the relative refractory period are small and the upstrokes are not very steep (Fig. 16-15). The amplitudes and upstroke slopes progressively improve as action potentials are elicited later in the relative refractory period. Recovery of full excitability is much slower than recovery of the fast response. Impulses that arrive early in the relative refractory period are conducted much more slowly than those that arrive late in that period. The long refractory periods also lead to conduction blocks. Even when slow responses recur at low frequency, the fiber may be able to conduct only a fraction of these impulses; for example, in certain conditions only alternate impulses may be propagated (see later).
EFFECTS OF CYCLE LENGTH
Cycle length refers to the time between successive action potentials. Changes in cycle length alter the duration of the action potential in cardiac cells (Fig. 16-16; also see Fig. 16-5) and thus change their refractory periods. Consequently, changes in cycle length are often important factors in the initiation or termination of certain arrhythmias (irregular heart rhythms).
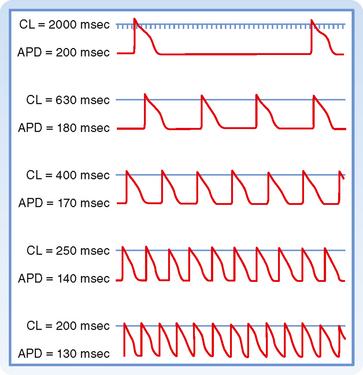
Figure 16-16 Effect of changes in cycle length (CL) on the action potential duration (APD) of Purkinje fibers.
(Modified from Singer D, Ten Eick RE: Am J Cardiol 28:381, 1971.)
The changes in action potential duration produced by stepwise reductions in cycle length from 2000 to 200 msec in a Purkinje fiber are shown in Figure 16-16. Note that as cycle length diminishes, the duration of the action potential decreases. This direct correlation between action potential duration and cycle length is mediated by changes in gK that involve at least two types of K+ channels, namely, those that conduct the delayed rectifier K+ currents iKr and iKs and those that conduct the transient outward K+ current ito.
NATURAL EXCITATION OF THE HEART AND THE ELECTROCARDIOGRAM
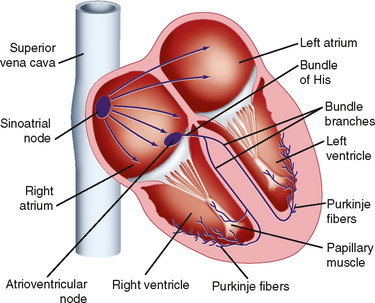
Excitation of the heart normally occurs in an ordered fashion, which allows effective pumping of blood. This ordered excitation occurs via the heart—s conduction system (Fig. 16-17). The SA node is the pacemaker of the heart and initiates the spread of action potentials throughout the atria. This spread of excitation reaches the AV node, where conduction is slowed such that atrial contraction can occur and the ventricles can be adequately filled. Excitation then spreads rapidly throughout the ventricles via the Purkinje fibers so that the ventricular myocytes contract in a coordinated manner. In the following, the properties of each component of the heart—s conduction system are described.
Sinoatrial Node
A typical transmembrane action potential recorded from an SA node cell is depicted in Figure 16-10, B. When compared with the transmembrane potential recorded from a ventricular myocardial cell (Fig. 16-10, A), the resting potential of the SA node cell is usually less negative, the upstroke of the action potential (phase 0) is less steep, the plateau is not sustained, and repolarization (phase 3) is more gradual. These are characteristic attributes of the slow response. As in cells that exhibit the slow response, tetrodotoxin (which blocks the fast Na+ current) has no influence on the SA nodal action potential because the action potential upstroke is not produced by an inward Na+ current through fast channels.
Pacemaker cell frequency may be varied by a change in (1) the rate of depolarization during phase 4, (2) the maximal negativity during phase 4, or (3) the threshold potential (Fig. 16-18). When the rate of slow diastolic depolarization is increased, the threshold potential is attained earlier, and the heart rate increases. A rise in the threshold potential delays the onset of phase 0, and the heart rate is reduced. Similarly, when the maximal negative potential is increased, more time is required to reach the threshold potential, when the slope of phase 4 remains unchanged, and the heart rate therefore diminishes.
Ionic Basis of Automaticity
Several ionic currents contribute to the slow diastolic depolarization that characteristically occurs in the automatic cells in the heart. In the pacemaker cells of the SA node, at least three ionic currents mediate the slow diastolic depolarization: (1) an outward K+ current, iK; (2) an inward current, if, induced by hyperpolarization; and (3) an inward Ca++ current, ICa (Fig. 16-19).
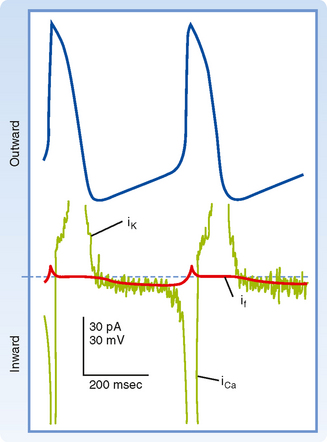
The repetitive firing of the pacemaker cell begins with the delayed rectifier K+ current iK. Efflux of K+ tends to repolarize the cell after the upstroke of the action potential. K+ continues to move out well beyond the time of maximal repolarization, but its efflux diminishes throughout phase 4 (Fig. 16-19). As the current diminishes, its opposition to the depolarizing effects of the two inward currents (if and iCa) also gradually decreases. The progressive diastolic depolarization is mediated by the two inward currents if and iCa, which oppose the repolarizing effect of the outward current iK.
< div class='tao-gold-member'>
Stay updated, free articles. Join our Telegram channel

Full access? Get Clinical Tree


