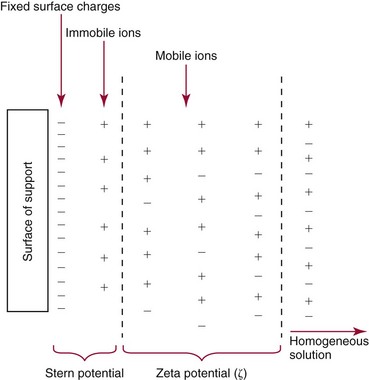
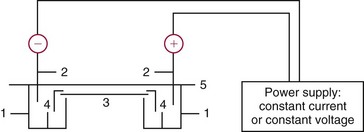
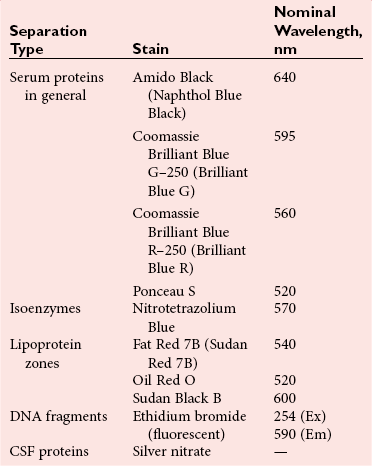
Electrophoresis

Chapter 12


Electrophoresis


Developments in deoxyribonucleic acid (DNA) testing, improvements in ease of performance through automation, and advantages of speed and miniaturization afforded by the technique of capillary electrophoresis (CE) have led to a renaissance and growth of electrophoresis as an analytical tool that is widely used in clinical laboratories. These developments and improvements have enabled clinical laboratories to keep pace with higher volumes of testing and to introduce more sophisticated technology to meet the demands of modern clinical practice. This chapter will review the principles and practice of the technique and will separately discuss conventional, capillary, and microchip electrophoresis. Particular attention is given to newer methods and their promise in fields such as genomics and proteomics.


Basic Concepts And Definitions


Electrophoresis is a comprehensive term that refers to the migration of charged solutes or particles of any size in a liquid medium under the influence of an electrical field. Iontophoresis and isotachophoresis (ITP) are similar terms but refer specifically to the migration of small ions. The first electrophoresis method used to study proteins was the free solution or moving boundary method devised by Tiselius in 1937. This technique was used in research to measure electrophoretic mobility and to study protein-protein interaction. It was able to resolve the serum proteins into only four component mixtures, with the α1 fraction incompletely separated from albumin.


Zone electrophoresis refers to the migration of charged molecules of proteins, usually in a porous supporting medium like agarose gel film, such that each protein zone is sharply separated from neighboring zones by a protein-free area. Zones are visualized by staining with a protein-specific stain to produce an electropherogram that is then scanned and quantified using a densitometer. The support medium can also be handled after drying and kept as a permanent record. It is a most commonly applied technique in clinical chemistry and is used to separate proteins in serum, urine, cerebrospinal fluid (CSF), other physiologic fluids, erythrocytes and tissue, and nucleic acids in various tissue cells.


Although electrophoretic separation of biologically relevant macromolecules in gels (or paper) has been the workhorse of modern biomedical research, the advent of capillary electrophoresis (CE) has revolutionized separations. Intense interest in carrying out electrophoretic separation in capillaries with inner diameters ranging from 20 to 75 µm has resulted from its unprecedented resolving power, separation speed, and small sample analysis capabilities. However, the true significance of CE to the separations community is seen in its ability to apply these separation principles in a multimodal approach to a variety of analytes that obviously included proteins and polynucleic acids, but also peptides, small drug-like molecules, and even ions.


Theory Of Electrophoresis


Depending on the charge they carry, ionized solutes move toward either the cathode (negative electrode) or the anode (positive electrode) in an electrophoresis system. For example, positive ions (cations) migrate to the cathode, and negative ions (anions) to the anode. An ampholyte (a molecule that is either positively or negatively charged, formerly called a zwitterion) becomes positively charged in a solution that is more acidic than its isoelectric point (pI)* and migrates toward the cathode. In a more alkaline solution, the ampholyte becomes negatively charged and migrates toward the anode. Because proteins contain many ionizable amino (—NH2) and carboxyl (—COOH) groups, and because the bases in nucleic acids may also be positively or negatively charged, they both behave as ampholytes in solution.


The rate of migration of ions in an electrical field depends on the factors listed in Box 12-1. The equation expressing the driving force in such a system is given by


image (1)


where


Steady acceleration of the migrating ion is counteracted by a resisting force characteristic of the solution in which migration occurs. This force, expressed by Stokes’ law, is


image (2)


where


The force F′ counteracts the acceleration that would be produced by F if no counter force were present, and the result of the two forces is a constant velocity. Therefore, when


image (3)


then


image (4)


or


image (5)


where v/X is the rate of migration (cm/s) per unit field strength (E/cm), defined as the electrophoretic mobility. It is expressed by the symbol µ and has the units cm2/(V)(s).


Electrophoretic mobility is directly proportional to the net charge and inversely proportional to the size of the molecule and the viscosity of the electrophoresis medium. In practice, the equation µ = m2/(V)(s) is used to calculate electrophoretic mobility. For example, if albumin travels 3 cm (l) on a 10-cm (d)-long agarose gel and does so in 75 minutes (or 75 × 60 s) at a voltage of 250 V, then


image


Because 1 mobility unit is defined as 10−5 cm2/(V)(s), this result is converted to 2.7 mobility units. Mobility may be positive or negative, depending on whether a protein migrates in the same or the opposite direction as the electrophoretic field (defined as extending from the anode to the cathode). In the example just given, electrophoresis was performed at pH 8.6, where proteins have a negative charge; therefore migration occurred from the cathode to the anode, and the mobility would be −2.7 mobility units.


In addition to the factors listed in Box 12-1, other factors that affect electrophoretic mobility include electroendosmosis (endosmosis) and wick flow. Electroendosmosis affects mobility by causing uneven movement of water through the support medium. An electrophoretic support medium, such as a gel in contact with water, takes on a negative charge caused by adsorption of hydroxyl ions. These ions are fixed to the surface and are immobile. Positive ions in solution cluster about the fixed negative charge sites, forming an ionic cloud of mostly positive ions. The number of negative ions in the solution increases with increasing distance from the fixed negative charge sites until eventually positive and negative ions are present in equal concentrations (Figure 12-1).


When current is applied to such a system, charges attached to the immobile support remain fixed, but the cloud of ions in solution moves to the electrode of opposite polarity. Because ions in solution are highly hydrated, this results in movement of the solvent as well. Movement of solvent and its solutes relative to the fixed support is referred to as endosmosis and causes preferential movement of water in one direction. Macromolecules in solution that move in the direction opposite this flow may remain immobile or may even be swept back toward the opposite pole if they are insufficiently charged. In media in which endosmosis is strong, such as conventional cellulose acetate and unpurified agarose gel, γ-globulins are swept back from the application point. Because the inner surface of a glass capillary contains many such charged groups, endosmosis is very strong and is actually the primary driving force for migration in CE systems. In practice, the endosmosis in CE is manipulated, however, to modify the magnitude of the endosmotic effect. In electrophoretic media in which surface charges are minimal (starch gel, purified agarose gel, or polyacrylamide gel), endosmosis is minimal.


Wick flow results from the movement of buffer into the support medium. During electrophoresis, heat evolved because of the passage of current through a resistive medium can cause evaporation of solvent from the electrophoretic support. This drying effect draws buffer into the support, and, if significant, the flow of buffer can affect protein migration and hence the calculated mobility.


Conventional Electrophoresis


In this section, (1) instrumentation, (2) general electrophoretic operations, (3) technical and practical considerations, and (4) types of conventional electrophoresis are discussed.


Instrumentation


Although modern electrophoresis equipment and systems vary considerably in form and degree of automation, the essential components common to all systems (Figure 12-2) include two reservoirs (1), which contain the buffer used in the process, a means of delivering current from a power supply via platinum or carbon electrodes (2), which contact the buffer, and a support medium (3) in which separation takes place connecting the two reservoirs. In some systems, wicks (4) may connect the medium to the buffer solution or directly to the electrodes. The entire apparatus is enclosed (5) to minimize evaporation and protect both the system and the operator. The direct current power supply sets the polarity of the electrodes and delivers current to the medium.


Power Supplies


The power supply drives the movement of ionic species in the medium and allows adjustment and control of the current or the voltage. With more sophisticated units, the power may be controlled as well, and conditions may be programmed to change during electrophoresis. Capillary systems use power supplies capable of providing voltages in the kilovolt range.


Current flowing through a medium that has resistance produces heat:


image (6)


where


This heat is released into the medium and increases the thermal agitation of all dissolved ions, and therefore the conductance of the system (decreases resistance). With constant-voltage power supplies, the resultant rise in current increases both protein migration and evaporation of water from the medium. Any water loss increases the ion concentration and further decreases the resistance (R). Under these circumstances, the current and therefore the migration rate will progressively increase. To minimize these effects, it is best to use a constant-current power supply. According to Ohm’s law,


image (7)


Therefore if R decreases, the applied EMF also decreases, keeping the current constant. This in turn decreases the heat effect and stabilizes the migration rate.


For isoelectric focusing (IEF) (see later section), a power supply that provides constant power is advisable. During electrophoresis, current drops significantly because of lower conductivity as carrier ampholytes focus at their isoelectric points, and because of creation of zones of pure water. If a constant voltage supply is used, frequent voltage adjustments may be necessary. As a result, constant current power supplies are not customarily used in IEF. Pulsed-power or pulsed-field techniques (see later section) require a power supply that can periodically change the orientation of the applied field relative to the direction of migration.


Buffers


Buffer ions have a twofold purpose in electrophoresis: they carry the applied current, and they set the pH at which electrophoresis is carried out. Thus they determine (1) the type of electrical charge on the solute, (2) the extent of ionization of the solute, and therefore (3) the electrode toward which the solute will migrate. The buffer’s ionic strength determines the thickness of the ionic cloud (buffer and nonbuffer ions) surrounding a charged molecule, the rate of its migration, and the sharpness of the electrophoretic zones. With increasing concentration of ions, the ionic cloud increases in size, and the molecule becomes more hindered in its movement. For the separation of serum proteins, the barbital or tris-boric acid ethylenediaminetetraacetic acid (EDTA) buffers remain the most popular.


According to Joule’s law, power produced when current flows through a resistive medium is dissipated as heat. This heat increases in direct proportion to the resistance, but also in proportion to the square of the current. The reduction in resistance caused by a high ionic strength buffer therefore leads to increased current and excessive heat. These buffers yield sharper band separations, but the benefits of sharper resolution are diminished by the Joule (heat) effect that leads to denaturation of heat-labile proteins or degradation of other components.


Ionic strength (also denoted by the symbol µ) is computed according to the following:


image (8)


where


The ionic strength µ of an electrolyte (buffer) composed of monovalent ions is equal to its molarity (mol/L). The ionic strength of a 1-mol/L electrolyte solution with one monovalent and one divalent ion is 3 mol/L, and for a doubly divalent electrolyte, it is 4 mol/L.


A relatively high ionic strength buffer used in high-resolution electrophoresis improves the separation of serum proteins into as many as 13 bands, with two or more bands in the α1, α2, and β-globulin regions and one or more additional bands seen in various pathologic conditions. Because of higher conductivity and the associated heat produced, it is necessary to reduce the temperature of the system to 10 to 14 °C. “Submarine” techniques, in which gels are submersed in circulating buffer cooled by an external cooling device or are supported on an electrophoresis chamber cooled by circulating water or an integral Peltier plate,41 provide exact temperature control. Effective cooling with less precise temperature control may also be achieved using chambers designed with a sealed compartment of cooled ethylene glycol, which is in contact with the gel during running.


Because buffers used in electrophoresis are good culture media for the growth of microorganisms, they should be refrigerated when not in use. Moreover, a cold buffer is preferred in an electrophoretic run, because it improves resolution and decreases evaporation from the electrophoretic support. Buffer used in a small-volume apparatus should be discarded after each run because of pH changes resulting from the electrolysis of water that accompany electrophoresis. If volumes used are larger than 100 mL, buffer from both reservoirs may be combined, mixed, and reused up to four times.


Support Media


The support medium provides the matrix in which protein separation takes place. Various types of support media have been used in electrophoresis and range from pure buffer solutions in a capillary to insoluble gels (e.g., sheets, slabs, or columns of starch, agarose, or polyacrylamide) or membranes of cellulose acetate. Gels are cast in a solution of the same buffer to be used in the procedure and may be used in a horizontal or vertical direction. In either case, maximum resolution is achieved if the sample is applied in a very fine starting zone. Separation is based on differences in charge-to-mass ratio of the proteins and, depending on the pore size of the medium, possibly molecular size.


Cellulose Acetate

Cellulose acetate, a thermoplastic resin made by treating cellulose with acetic anhydride to acetylate the hydroxyl groups, also is primarily of historical interest. When dry, the membranes contain about 80% air space within the interlocking cellulose acetate fibers and are opaque, brittle films. As the film is soaked in buffer, the air spaces fill with liquid, and it becomes pliable. Samples were applied with a twin-wire applicator or the edge of a glass slide. Because of their opacity, stained membranes needed to be made transparent (cleared) for densitometry by soaking in 95 : 5 methanol : glacial acetic acid. Cleared membranes were strong and could be stored as a permanent record, but because of the necessity for presoaking and clearing, cellulose acetate has largely been replaced by agarose gel in most clinical applications.


Agarose

Agarose is a linear polymer containing alternating D-galactose and 3,6-anhydro-L-galactose monomers. It is the purified, essentially neutral fraction of agar obtained by separating agarose from agaropectin, a more highly charged fraction containing acidic sulfate and carboxylic side groups. Because the pore size in agarose gel is large enough for all proteins to pass through unimpeded, separation is based only on the charge-to-mass ratio of the protein. Advantages of agarose gel include its lower affinity for proteins and its native clarity after drying, which permits excellent densitometry. It is essentially free of ionizable groups and so exhibits little endosmosis.


Most routine procedures for agarose electrophoresis (AGE) are now performed using commercially produced, prepackaged microzone gels, and the sample is applied by means of a comb or a thin plastic template, with small slots corresponding to sample application points. The template is placed on the agarose surface, and 5- to 7-µL samples are placed on each slot. The serum sample is allowed to diffuse into the agarose for 5 minutes, excess sample is removed by blotting, and the template is removed. AGE separation for most routine serum applications requires an electrophoresis time of 20 to 30 minutes.


Polyacrylamide Gel

Polyacrylamide is a polymeric matrix consisting of linear chains of acrylamide cross-linked with bis-acrylamide. It is thermostable, transparent, strong, and relatively chemically inert, and—depending on concentration—can be made in a wide range of pore sizes. Its average pore size in a typical 7.5% gel is about 5 nm (50 Å)—large enough to allow most serum proteins to migrate unimpeded. However, proteins with a molecular radius and/or length that exceeds critical limits will be impeded in their migration. Some of these proteins are (1) fibrinogen, (2) β-lipoprotein, (3) α2-macroglobulin, and (4) γ-globulins. Thus separation is based on both charge-to-mass ratio and molecular size (a phenomenon referred to as molecular sieving), and serum proteins can be resolved into more individual fractions than with agarose gel. Furthermore, these gels are uncharged, thus eliminating electroendosmosis. Precast minigels are available in a variety of concentrations and acrylamide-to-bis-acrylamide ratios suitable for most protein or nucleic acid separations. Because of the potential carcinogenicity of acrylamide, however, appropriate caution must be exercised when handling this material if gels are prepared by hand.


Attempts to improve the hydrophilic nature of polyacrylamide have led to the development of mono- and di-substituted monomers, one of which is N-acryloyl-tris(hydroxymethyl)aminomethane, or poly NATTM.5 This material is more hydrophilic than polyacrylamide, and its matrix has larger pores, thereby presenting less resistance to the passage of large molecules. It is ideally suited to the separation of DNA fragments up to 20 kilobases (kb) in size using a homogeneous (nonpulsed) electric field. Fragments that differ in size by as little as 2% can be resolved. Gels are submersed in buffer during use, allowing temperatures to be tightly controlled at values between 50 and 60 °C. Use of elevated temperatures results in shorter run times and more reproducible band migration.


Automated Systems


Because of increased volume of testing, primarily for serum proteins, many laboratories are converting to automated systems for electrophoresis. Such a system is the Helena SPIFE 4000 (Helena Laboratories, Beaumont, Tex), an automated electrophoresis system providing automated reagent application and a variety of gel sizes that permit analysis of 10 to 100 samples simultaneously. It also features (1) in-line sample application, (2) automated electrophoretic separation and staining of analytes, (3) multiple staining capability, and (4) positive sample identification. The Interlab Microgel system (Interlab Srl, Rome, Italy) also fully automates the process and integrates (1) sample application, (2) temperature-controlled electrophoresis, (3) staining, and (4) densitometry into a single unit with the capability of managing four gels simultaneously. Other systems that have partially automated the procedure or incorporated the ability to process sequentially multiple gels of different compositions include the (1) Phast System (Pharmacia LKB, Gaithersburg, Md), (2) HITE Fractoscan (Olympus, Invicon, München, Germany), (3) Hydragel-Hydrasys (Sebia Inc., Durham, NC), and (4) High-Performance Gel Electrophoresis (HPGE)-1000 system (LabIntelligence Inc., Belmont, Calif). Most CE systems (see “Capillary Electrophoresis” section) have autosampling capability for sequentially processing specimens, but the Sebia Capillarys permits simultaneous processing of seven samples by using multiple capillaries. Newer microchip-based analyzers like the Agilent 2100 Bioanalyzer (Agilent Technologies Inc., Santa Clara, Calif) significantly miniaturize and increase the speed of the process for separating proteins, nucleic acids, or even entire cells. These advances substantially reduce the labor component associated with this technique.


General Operations


General operations performed in conventional electrophoresis include (1) separation, (2) detection, (3) quantification, and (4) a number of “blotting” techniques.


Electrophoretic Separation


When electrophoresis is performed on precast microzone agarose gels, the following steps are typical: (1) excess buffer is removed from the support surface by blotting, taking care that bubbles are not present; (2) 5 to 7 µL of sample is applied using a comb or a plastic template and is allowed to diffuse into the gel; it is then blotted to remove the excess; (3) the gel is placed into the electrode chamber; (4) electrophoresis is performed at specified current, voltage, or power; (5) the gel is rinsed, fixed, and then dried; (6) the gel is stained and redried; and (7) the gel is scanned in a densitometer. If isoenzymes are to be determined, substrate dye solution is incubated on the gel to stain zones before fixing and drying. Alternative procedures would be required if the more sophisticated methods described later are used.


Detection and Quantification


Once separated, proteins may be detected by staining followed by quantification using a densitometer, or by direct measurement using an optical detection system set at 210 nm.


Staining

If staining is used to visualize separated proteins, the proteins usually are fixed first by precipitating them in the gel with a chemical agent such as acetic acid or methanol. This prevents diffusion of proteins out of the gel when submersed in the stain solution. The amount of dye taken up by the sample is affected by many factors, such as the type of protein and the degree of denaturation of the proteins by fixing agents.


Table 12-1 lists dyes commonly used in electrophoresis, along with suggested wavelengths for quantification by densitometry. Most commercial methods for serum protein electrophoresis use Amido Black B or members of the Coomassie Brilliant Blue series of dyes for staining. Isoenzymes are typically visualized by incubating the gel in contact with a solution of substrate, which is linked structurally or chemically to a dye before fixing. Silver nitrate and silver diammine stain proteins and polypeptides with sensitivity 10- to 100-fold greater than that of conventional dyes.52 Selective fixing and staining of protein subclasses also can be achieved by combining a stain molecule with an antiglobulin, as is done in immunofixation.


Improvements in conducting sensitive measurements have been achieved by linking an enzyme such as alkaline phosphatase or peroxidase to a single or double antibody specific for particular proteins such as oligoclonal immunoglobulin (Ig)G,53 or by spraying separated proteins with luminal and peroxide to develop chemiluminescence, which, in turn, exposes x-ray film to form a permanent image.64 Chemiluminescence has been used in this way to quantify IgE (Lumi-Phos 530, Lumigen, Inc., Southfield, Mich),67 and DNA fragments have been detected by linking with a fluorescent dye label.35


In practice, a typical stain solution may be used several times before it is replaced. A good rule of thumb is that a stain solution of 100 mL may be used for a combined total of 387 cm2 (60 in2) of agarose film. The stain solution may be considered faulty if leaching of stained protein zones occurs in the 5% acetic acid wash solution. Whenever protein zones appear too lightly stained, the stain or substrate reagent—in the case of isoenzymes—should always be suspected. Stain solution must be stored tightly covered to prevent evaporation.


Quantification

A densitometer is used to quantify stained zones. This instrument measures the absorbance of each fraction as the gel (or other medium) is moved past a photometric optical system and displays an electropherogram on a recorder chart or computer display. Microprocessor-containing units automatically integrate the area under each peak and report each as a percent of total or as absolute concentration or activity computed from the total protein or activity of enzyme in the sample.


Reliable densitometric quantitation requires (1) light of an appropriate wavelength, (2) linear response from the instrument, and (3) a transparent background in the medium being scanned. Linearity may be tested with a neutral density filter designed with separated or adjacent areas of linearly increasing density. The densities are permanent and have expected absorbance values. The very small sample sizes used and the transparency of agarose gels satisfy the requirement for a clear background. Nevertheless, problems occur with densitometry because of differences in the quantity of stain taken up by individual proteins and differences in protein zone sizes.


Essential features of a densitometer include (1) the ability to scan gels 25 to 100 mm in length; (2) electronic adjustment of the most intense peak to full scale; (3) automatic background zeroing (peaks are not lost or “cut off”); (4) variable wavelength control over the range of 400 to 700 nm; (5) variable slits to allow adjustment of the beam size; (6) an integrating device with both automatic and manual selection of cut points between peaks; and (7) automatic indexing, a feature that advances the electrophoresis strip from one sample channel to the next.


Desirable features of a densitometer include computerized integration and printout, built-in diagnostics for instrument troubleshooting, choice of one of several scanning speeds, and ability to measure in the reflectance mode. Models with a separate computer for data processing permit storage and reformatting of data, if desired, and reprinting or delayed transmission to a host computer.


DNA analysis requires the ability to scan larger gels, which may contain several dozen bands of DNA fragments of different length. Modern automated electrophoresis systems also use larger gels containing 30 or more samples, which are scanned on a new generation of densitometers referred to as flat bed scanners or digital image analyzers. These instruments are capable of scanning and storing digitized light intensity readings from large areas and use ultrasensitive charge-coupled device (CCD) detectors having a resolution of up to 1200 dots per inch (21 µm). Sophisticated data processing software permits manipulation of stored image information to produce conventional scans and computations or more complex outputs, such as overlaying and subtraction of patterns from two different samples.


Blotting Techniques


In 1975, Edward Southern developed a technique that is widely used to detect fragments of DNA. This technique, known as Southern blotting,24 first requires electrophoretic separation of DNA or DNA fragments by AGE. Next, a strip of nitrocellulose or a nylon membrane is laid over the agarose gel, and the DNA or DNA fragments are transferred or “blotted” onto it by capillary, electro-, or vacuum blotting. They are then detected and identified by hybridization with a labeled, complementary nucleic acid probe. This technique is widely used in (1) molecular biology for identifying a particular DNA sequence; (2) determining the presence, position, and number of copies of a gene in a genome; and (3) typing DNA (see Chapters 17, 38, and 39 for further details).


Northern and Western blotting techniques,24 named by analogy to Southern blotting, were subsequently developed to separate and detect ribonucleic acids (RNAs) and proteins, respectively. Northern blotting is carried out identically to Southern blotting except that a labeled RNA probe is used for hybridization. Western blotting is used to separate, detect, and identify one or more proteins in a complex mixture. It involves first separating the individual proteins by polyacrylamide gel and then transferring or “blotting” onto an overlying strip of nitrocellulose or a nylon membrane by electro-blotting. The strip or membrane is then reacted with a reagent that contains an antibody raised against the protein of interest.


Technical and Practical Considerations


In performing electrophoretic separations, a number of technical and practical aspects need to be considered, as they affect the process.


Sampling


To achieve a proper balance between sensitive measurements and resolution, the amount of serum protein applied to an electrophoretic support must be optimum. Albumin is about 10 times more concentrated in serum than the smallest fraction, the α1-globulins. Therefore, the amount of serum applied should prevent overloading with albumin, but should still be adequate to quantify α1-globulin. For separation of serum proteins using polyacrylamide gel electrophoresis (PAGE), 3 µL of serum containing approximately 210 µg of total protein is applied. For alkaline phosphatase isoenzymes, up to 25 µL of a normal serum may be applied (less may be used if activity is greatly increased). Urine specimens require 50- to 100-fold concentration or extended application time for adequate sensitivity, and CSF may or may not require concentration, depending on the staining approach used.


Stay updated, free articles. Join our Telegram channel

Nov 27, 2016 | Posted by in GENERAL & FAMILY MEDICINE | Comments Off on Electrophoresis

Full access? Get Clinical Tree

Get Clinical Tree app for offline access