Chapter 17 Drug therapy and poisoning
Drug therapy


The patient


 Immunization against serious microbial infections (e.g. influenza vaccination)

 Oral contraceptives in sexually active women wishing to avoid pregnancy.
Co-morbidity may also significantly alter the way in which conditions are treated particularly in the elderly. Some examples are shown in Table 17.1.
Table 17.1 Examples of drugs to be avoided in people with co-morbidity
| Co-morbidity | Avoid | Effect |
|---|---|---|
Parkinson’s disease | Neuroleptics | Exacerbates Parkinsonian symptoms (including tremor) |
Hypertension | Non-steroidal anti-inflammatory drugs | Sodium retention |
Asthma | Beta-blockers, adenosine | Bronchospasm |
Respiratory failure | Morphine, diamorphine | Respiratory depression |
Renovascular disease | ACE inhibitors/antagonists | Reduction in glomerular filtration |
Chronic heart failure | Trastuzumab | Worsening of heart failure |
Chronic infections (e.g. tuberculosis, hepatitis C, histoplasmosis | Cytokine modulators (e.g. etanercept) | Increased risk of exacerbation |
Prescribing in neonates, infants, children and adolescents


There are other difficulties in prescribing for children:
 Many treatments have never been subject to formal trials in either children or adolescents and their benefits and risks have not, therefore, been appropriately assessed in these age groups. Efforts are being made, internationally, to redress this.

 Precise oral dosing is often impossible in babies who spit out unpleasant-tasting products!

Prescribing for the elderly
The use of drugs in the elderly is often a problem:
 Rates of hepatic drug metabolism and renal excretion decline with age. Extrapolation of drug dosages, from those appropriate in younger adults, may therefore lead to toxic plasma levels.


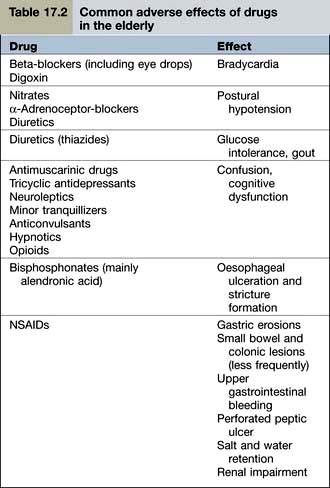
Examples of common problems encountered in the use of drugs amongst older people are shown in Table 17.2.
 |
Drug use in pregnancy
Clinicians should be extremely cautious about prescribing drugs to pregnant women, and only essential treatments should be given. When a known teratogen is needed during pregnancy (e.g. an anticonvulsant drug or lithium), the potential adverse effects should be discussed with the parents, preferably before conception. If parents wish to go ahead with the pregnancy, they should be offered an appropriate ultrasound scan to assess whether there is any fetal damage. Some known human teratogens are shown in Table 17.3.
Table 17.3 Some human teratogens
| Drug | Effect |
|---|---|
ACE inhibitors/antagonists | Oligohydramnios |
Retinoids, e.g. acitretin | Multiple abnormalities |
Carbimazole | Neonatal hypothyroidism |
| Abnormalities of bone growth |
Antiepileptics |
|
Carbamazepine | Cleft palate |
Lamotrigine | |
Phenytoin | |
Valproate | Neural tube defects |
NSAIDs | Delayed closure of the ductus arteriosus |
Cytotoxic drugs | Most are presumed teratogens |
Lithium | Ebstein’s anomaly |
Misoprostol | Moebius’s syndrome |
Thalidomide (and possibly lenalidomide) | Phocomelia |
Note: All drugs should be avoided in pregnancy unless benefit clearly outweighs the risk.
The drug
Selecting the right drug involves three elements:
 The drug’s clinical efficacy for the proposed use
 The balance between the drug’s efficacy and safety

The most common approach to assessing a drug’s efficacy is the randomized controlled trial (RCT), although other approaches (see p. 907) can be informative. The demonstration of absolute efficacy (against placebo) may, itself, be insufficient. Where there is more than one treatment for the same indication these should be compared with one another, taking account of the magnitude of their benefits, their individual adverse reaction profiles, and their costs.
The dose
Fixed dosage regimens
Drugs suitable (in adults) for prescribing at the same ‘fixed’ dose, for all patients, share common features. Efficacy is optimal in virtually all patients; and the risks of dose-related (type A) adverse reactions (see p. 904) are normally low. These drugs have a high ‘therapeutic ratio’ (i.e. the ratio between toxic and therapeutic doses). Examples of drugs prescribed at a fixed dose are shown in Table 17.4.
Table 17.4 Examples of fixed dose prescribing
| Drug | Indication |
|---|---|
Aspirin | Secondary prevention of myocardial infarction |
Clopidogrel | |
Bendroflumethiazide | Hypertension |
Broad spectrum penicillins | Lower urinary tract infection |
Cephalosporins | |
Macrolides | Upper and lower respiratory tract infection |
Levonorgestrel | Emergency contraception |
Ulipristal | |
Oestrogen antagonists | Secondary prevention of breast cancer |
Aromatase inhibitors | |
Vaccines | e.g. Diphtheria, pertussis, mumps, measles, rubella, influenza, etc. |
Pharmacokinetics


Liver drug metabolism occurs in two stages:
 Phase I is the modification of a drug, by oxidation, reduction or hydrolysis. Of these, oxidation is the most frequent route and is largely undertaken by a family of isoenzymes known as the cytochrome P450 system (see p. 902). Inhibition or induction of cytochrome P450 isoenzymes are major causes of drug interactions (Table 17.5).

Table 17.5 Some inducers and inhibitors of cytochrome P450
Inducers | Carbamazepine |
Hyperforina | |
Nifedipine | |
Non-nucleoside reverse transcriptase inhibitors (NNRTIs) | |
Omeprazole | |
Phenobarbital | |
Phenytoin | |
Rifampicin | |
Ritonavir (see p. 180) | |
Inhibitors | Allopurinol |
Amiodarone | |
Cimetidine | |
Erythromycin, clarithromycin | |
Fluoxetine, paroxetine | |
Grapefruit juice (contains flavonoids) | |
Imidazoles | |
Quinolones | |
Saquinavir | |
Sulphonamides |
a Hyperforin is one of the ingredients of the herbal product known as St John’s wort used by herbalists to treat depression. Although it is marketed as a licensed medicine, it is a reminder that drug interactions can occur with alternative, as well as conventional, medicines.
Genetic causes of altered pharmacokinetics
Variability in the genes that encode drug-metabolizing enzymes (Table 17.6) is a major determinant of the inter-individual differences in the therapeutic and adverse responses to drug treatment. The most common involve polymorphisms of the cytochrome P450 family of enzymes, CYP. The first to be discovered was the polymorphism in the hydroxylation of the antihypertensive agent debrisoquin (CYP2D6). Defective catabolism was shown to be a monogenetically inherited trait, involving 5–10% of Caucasian populations, and leading to an exaggerated hypotensive response.
Table 17.6 Some genetic polymorphisms involving drug metabolism
| Enzyme | Drug |
|---|---|
P450 |
|
Cytochrome CYP1A2 | Amitriptyline |
Clozapine | |
Cytochrome CYP3A4 | Amlodipine |
Ciclosporin | |
Nifedipine | |
Sildenafil | |
Simvastatin | |
Protease inhibitors | |
Tacrolimus | |
Cytochrome CYP2C9 | Warfarin |
Glipizide | |
Losartan | |
Phenytoin | |
Cytochrome CYP2D6 | Beta-blockers |
Codeine | |
Risperidone | |
SSRIs | |
Tramadol | |
Venlafaxine | |
Cytochrome CYP2C19 | Clopidogrela |
Cyclophosphamide | |
Diazepam | |
Lansoprazole | |
Omeprazole | |
Plasma pseudocholinesterase | Succinylcholine |
Mivacurium | |
Thiopurine methyltransferase | Azathioprine |
Mercaptopurine | |
UDP-glucuronosyl transferase | Irinotecan |
N-acetyl transferase | Isoniazid |
CYP, cytochrome; SSRIs, Selective serotonin reuptake inhibitors.
a Clopidogrel is a prodrug and impaired metabolizers have a reduced response.
Individual differences in the activity of thiopurine methyltransferase (TPMT) determine the doses of mercaptopurine and azathioprine that are used. TMPT activity is therefore undertaken routinely in children undergoing treatment for acute lymphatic leukaemia and people with Crohn’s disease (see p. 233).
This may, however, become possible in the future, and would contribute – in part – to the prospect of ‘personalized prescribing’ (see p. 899).
Other causes of altered pharmacokinetics
Rates of hepatic drug clearance can also be influenced by environmental factors including diet, alcohol consumption and concomitant therapy with drugs capable of inducing or inhibiting (Table 17.5) drug metabolism. Hepatic drug clearance also decreases with age. By contrast, renal drug clearance does not show substantial variation between healthy individuals although it declines with age and in people with intrinsic renal disease.
Pharmacodynamics
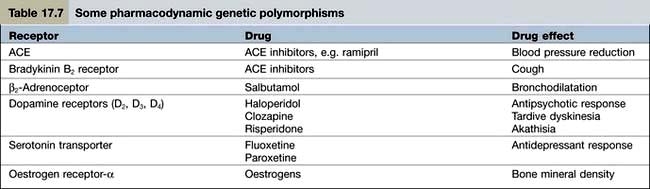
Pharmacodynamics is the study of what the drug does to the body. Pharmacodynamic sources of variability in the intensity of drug action are at least partly due to drug receptor polymorphisms (Table 17.7). At present, the pharmacodynamic tests used in clinical practice to target therapy are largely confined to the expression of:
 oestrogen and HER2 receptors in women with breast cancer (to determine, respectively, responsiveness to anti-oestrogens and trastuzumab)

 |
Monitoring the effects of treatment
Measuring plasma drug concentrations
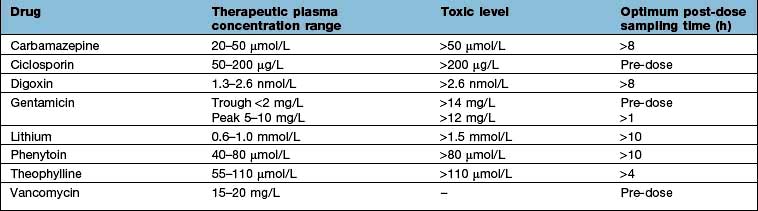
For a few drugs, dosages can be effectively monitored by reference to their plasma concentrations (Table 17.8). This technique is only useful, however, if both the following criteria are fulfilled:
 There is a reliable and available drug assay.
 Plasma concentrations correlate well with both therapeutic efficacy and toxicity.
Affordability
The money available for healthcare varies widely across the world and there are marked differences (Fig. 17.1). All healthcare systems try to provide their populations with the highest standards of care within the resources they have at their disposal. The expenditure of large sums on a few people may deprive many of cost-effective remedies – a phenomenon known as the ‘opportunity cost’. The differences in healthcare expenditure shown in Figure 17.1 can be very largely accounted for by their differences in national wealth as reflected by their gross domestic products.
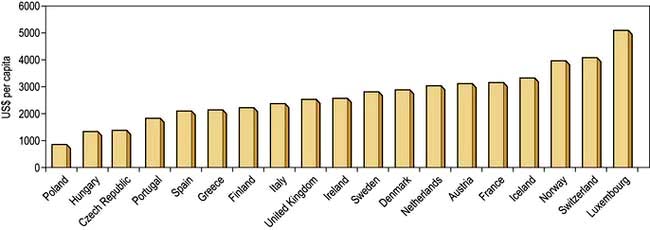
Figure 17.1 Annual expenditure on healthcare, as US$ per head of the population, in some developed countries.
(Source: OECD; http://www.oecd.org/document/4/0,3746,en_2649_37407_35101892_1_1_1_37407,00.html.)
Adverse drug reactions
Classification
Two types of ADR are recognized.
Type A (augmented) reactions (Table 17.9) are:
 qualitatively normal, but quantitatively abnormal, manifestations of a drug’s pharmacological or toxicological properties
 predictable from its known pharmacological or toxicological actions


Table 17.9 Examples of adverse drug reactions
| Type of reaction and drug | Adverse reaction |
|---|---|
Type A (augmented) |
|
ACE inhibitors | Hypotension |
ACE antagonists | Hypotension |
Anticoagulants | Gastrointestinal bleeding |
Antipsychotics | Acute dystonia/dyskinesia |
Cytotoxic agents | Bone marrow dyscrasias |
Erythromycin | Nausea, vomiting |
Glucocorticosteroids | Hypoadrenalism |
Insulin | Hypoglycaemia |
Tricyclic antidepressants | Dry mouth |
Type B (bizarre) |
|
Benzylpenicillin | Anaphylaxis |
Broad-spectrum penicillins | Maculopapular rash |
Carbamazepine | Toxic epidermal necrolysis |
Carbamazepine | Hepatotoxicity |
Isotretinoin | Depression |
ACE, angiotensin-converting enzyme; SSRIs, selective serotonin reuptake inhibitors.
a In children and adolescents.
Type B (idiosyncratic) reactions (Table 17.9) have no resemblance to the recognized pharmacological or toxicological effects of the drug. They are:


Diagnosis
 Appropriate time interval. The time interval between the administration of a drug and the suspected adverse reaction should be appropriate. Acute anaphylaxis usually occurs within a few minutes of administration, whilst aplastic anaemia will only become apparent after a few weeks (because of the life-span of erythrocytes). Drug-induced malignancy, however, will take years to develop.


 Results of laboratory tests. In a few instances, the diagnosis of an adverse reaction can be inferred from the plasma concentration (Table 17.8). Occasionally, an ADR produces diagnostic histopathological features. Examples include putative reactions involving the skin and liver.

Management
Specific therapy is sometimes required for ADRs such as bleeding with warfarin (vitamin K), acute dystonias (benztropine) or acute anaphylaxis (see Emergency Box 3.1, p. 69).
FURTHER READING
Pirmohamed M. The applications of pharmacogenetics to prescribing: what is currently known? Clin Med 2009; 9:493–495.
Relling M, Giacomini KM. Pharmacogenetics. In: Brunton LL, Lazo JS, Parker KL, eds. Gilman & Goodman’s The Pharmacological Basis of Therapeutics, 11th edn. New York: McGraw-Hill; 2006:93–115.
Wilkinson GR. Drug metabolism and variability among patients in drug response. N Engl J Med 2005; 352:2211–2221.
Woodcock J, Lesko LJ. Pharmacogenetics – tailoring treatment for outliers. N Engl J Med 2009; 360:811–813.
Evidence-based medicine
Randomized controlled trials
 In a superiority trial the study treatment is usually compared to placebo or to current standard practice.

Assessing randomized controlled trials
Were the treated and control groups comparable?
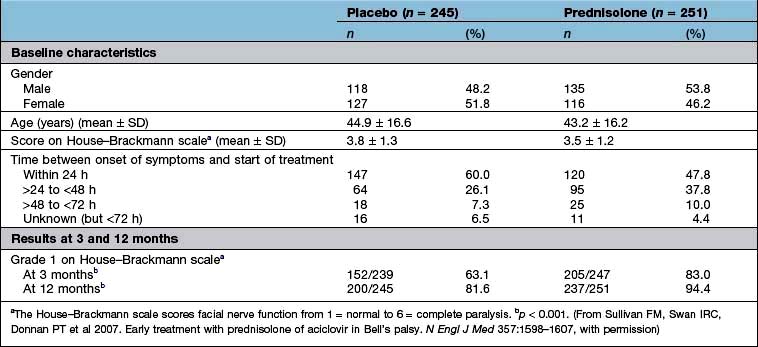
Were they similar in their ‘baseline’ characteristics? Were they, for example, of similar age, severity and duration of illness? If not, are the differences likely to influence the results? Has the statistical analysis (using analysis of covariance, or Cox’s proportional hazards model) (see below) tried to adjust for them? Table 17.10 shows some of the baseline characteristics of a trial comparing prednisolone with placebo in the treatment of Bell’s palsy (idiopathic facial paralysis).
Outcomes
There are two ways to look at the outcomes of an RCT.
 Per protocol analysis: this includes only those who completed the study.
 Intention-to-treat analysis: this includes all patients from the time of randomization.
Ideally, there should be no difference but in reality the results of a per protocol analysis are usually more advantageous to a treatment than an intention-to-treat analysis. The reason is that the intention-to-treat analysis will take account of patients who have withdrawn from the trial because of intolerance of the treatment or adverse drug reactions. It is therefore a much more robust approach. The results of the intention-to-treat analysis, in the trial of prednisolone in Bell’s palsy, are shown in Table 17.10. The trial results indicate, with a high probability, that treatment of Bell’s palsy with prednisolone will increase the chances of a full recovery of facial nerve function.
Analysis of a superiority trial
 Any difference may still be due to chance; and it is often better to await the results of at least two independent studies before adopting a new treatment.

 A statistically significant difference may not, necessarily, be clinically relevant.
 Effect size. The results of the well-designed trial in Table 17.10 show, very convincingly, that the treatment of Bell’s palsy with prednisolone increases the chances of complete recovery of facial nerve function, at 12 months, from 81.6% to 94.4%. This is a far more convincing description of the benefits of treatment than the p value.
 Another expression of the benefit of a treatment such as prednisolone can be derived from the number needed to treat (NNT). This is an estimate of the numbers of patients needed to be treated with a drug to achieve one positive result. In the study shown in Table 17.10, the NNT to enable one patient with Bell’s palsy to regain normal facial nerve function, after prednisolone treatment, is eight.
Controlled observational trials


Historical controlled trials


Case–control studies
A case–control design allows an estimation of the odds ratio (OR), which is the ratio of the probability of an event occurring to the probability of the event not occurring (Box 17.1).
Box 17.1
Estimation of odds ratio
| Cases | Controls | |
|---|---|---|
Risk factor present | a | c |
Risk factor absent | b | d |
The odds ratio (OR) = (a ÷ b) / (c ÷ d) | ||
Evaluation of new drugs
New drugs are subjected to a vigorous programme of preclinical and clinical testing before they are licensed for general use (Table 17.11) and are also monitored for safety following licensing. Doctors are recommended to fill in yellow cards when they suspect an adverse reaction has taken place.
Table 17.11 Evaluation of new drugs
Phase I: Healthy human subjects (usually men) |
Phase II: First assessment in patients |
Phase III: Use in wider patient population |
Phase IV: Post-marketing surveillance |
Statistical analyses
The average
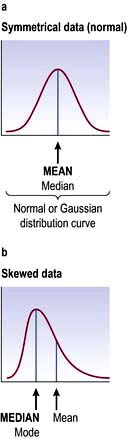
 The mean is the average of a distribution of values that are grouped symmetrically around the central tendency.


In a symmetrically distributed population, the mean, median and mode are the same.
Correlation
 If r = 1, there is complete and direct concordance between the two variables
 If r = −1, there is complete but inverse concordance

 The 1 in 20 rule is a convention and does not exclude the possibility that a presumed association is due to chance

Expressions of benefit and harm
There are three ways in which the outcomes, in clinical studies, are expressed:
Continuous outcomes. Studies such as that in Table 17.10 may report outcomes using one or more continuous scales. In this study of the effects of prednisolone in the treatment of Bell’s palsy, the House–Brackmann measure of facial nerve function was used as the outcome measure. Conventional tests of statistical significance using Student’s t-test, for example, can be calculated to assess whether the null hypothesis should be rejected.
NNT = 1/ (pactive – pno treatment)
Stay updated, free articles. Join our Telegram channel

Full access? Get Clinical Tree


