Diet and Blood Pressure1


Diet and Blood Pressure1


Lawrence J. Appel


Elevated blood pressure (BP) is one of the most common and important risk factors for cardiovascular (CV) and renal diseases. Worldwide, nearly 1 billion individuals (˜26% of adults) have hypertension (1). Elevated BP is responsible for about 54% of strokes and 47% of ischemic heart disease events (2) and for nearly 7.5 million deaths per year (3). Consequently, elevated BP is considered the leading global cause of preventable deaths (3), not only in high-income countries but also in low- and middle-income countries as well.

In the United States, about 31% of adults (nearly 68 million adults) have hypertension, defined as having a systolic BP (SBP) of 140 mm Hg or higher, a diastolic BP (DBP) of 90 mm Hg or higher, or treatment with antihypertensive drugs (4). Additionally, at least as many US residents have prehypertension, defined as an SBP of 120 to 139 mm Hg or DBP of 80 to 89 mm Hg, without medication (5). Unfortunately, control rates remain low at about 50% (4, 5).

In all but a few isolated societies, SBP gradually increases with age (6), and as a result, most adults develop hypertension in their lifetime. According to data from the Framingham Heart Study, roughly 90% of US adults will develop hypertension in their lifetime (7). Both men and women are affected by elevated BP; and African-Americans, on average, have higher BP and a higher prevalence of hypertension than non-African-Americans (5). African-Americans also have an increased risk of BP-related diseases, particularly stroke and kidney disease.

BP is a strong, independent, and etiologically relevant risk factor for CV and renal diseases (8). The relationship between BP and the risk of CV disease is direct and progressive: as BP rises, so does the risk of CV disease throughout the range of BP including prehypertensive and hypertensive BP (9). It has been estimated that nearly a third of BP-related deaths from coronary heart disease (CHD) occur in individuals with BP in the nonhypertensive range (10). Correspondingly, prehypertensive individuals not only have a high likelihood of developing hypertension but also have an increased risk of CV disease compared with persons with normal BP (SBP <120 mm Hg and DBP <80 mm Hg) (11).

Elevated BP results from environmental factors, genetic factors, and interactions among these factors. Of the environmental factors that influence BP (diet, physical inactivity, toxins, and psychosocial factors), dietary factors likely have a predominant role. Reducing weight and decreasing dietary sodium intake lower BP, as does increased potassium intake. For persons who drink alcohol excessively, limiting alcohol consumption to moderate levels also reduces BP. Since 1997, consumption of a diet similar to the ones tested in the Dietary Approaches to Stop Hypertension (DASH) and Optimal Macronutrient Intake Trial to Prevent Heart Disease (OmniHeart) has emerged as an effective strategy to lower BP (12).


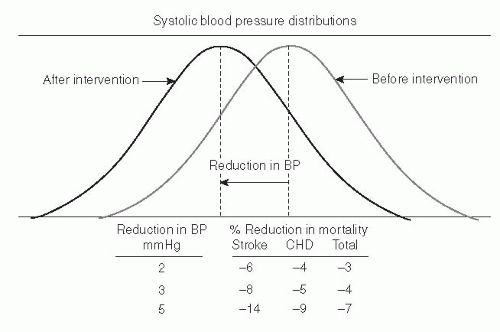
Fig. 66.1. Estimated effects of population-wide shifts in systolic blood pressure (BP) on mortality. CHD, coronary heart disease. (Adapted with permission from Stamler R. Implications of the INTERSALT study. Hypertension 1991;17[Suppl]:I16-20.)

Dietary changes that lower BP can prevent nonhypertensive individuals from developing hypertension and reduce their risk of BP-related CV disease. In fact, even minor reductions in BP across an entire population could have a tremendous, beneficial public health impact. For example, it has been estimated that an 8% reduction in stroke mortality and a 5% reduction in mortality from CHD could result from just a 3 mm Hg reduction in SBP (Fig. 66.1) (13). Dietary changes can serve as first-line therapy, before antihypertensive medication, for treating uncomplicated stage I hypertension (SBP 140 to 159 mm Hg or DBP 90 to 99 mm Hg). Among hypertensive individuals who are already taking medication, dietary changes, particularly reduced sodium intake, can further lower BP and make it possible to reduce the number and dose of antihypertensive medications. In general, BP reductions from dietary changes are greater in hypertensive than in nonhypertensive individuals.

Although there is ample evidence that dietary changes lower BP, there are fewer data on whether dietary changes can reduce the age-related rise in SBP, which is approximately 0.6 mm Hg per year in adults (14). Trials of dietary changes are often less than 3 years in duration and therefore are not of sufficient duration to answer that question. Hence, whether the BP reductions observed in these trials have merely shifted the age-related rise in BP curve downward, without a change in slope (Fig. 66.2A), or have actually reduced its slope (see Fig. 66.2B) cannot be determined from short-term trials (15). Nonetheless, migration studies, ecologic studies, and, most recently, observational analyses of trial data (16) offer some evidence to suggest that dietary factors may indeed reduce the age-associated rise in SBP.

This chapter reviews the evidence on the relationship between diet and BP. The summary of evidence and corresponding recommendations largely reflects existing reviews and consensus statements. (15, 17, 18). Table 66.1 provides a summary of this evidence, whereas Table 66.2 provides a summary of recommendations.


DIETARY FACTORS THAT LOWER BLOOD PRESSURE


Weight Loss

On average, as weight rises, so do BP levels. The significance of this association is reinforced by the high and increasing prevalence of obesity worldwide. In the United
States, roughly 69% of adults are considered either overweight or obese, as defined by a body mass index (BMI) of at least 25 kg/m2, and approximately 36% of adults are considered obese (BMI >30 kg/m2) (19). Among children and adolescents in the United States, the prevalence of obesity remains high (20). Concomitant with rising weight and the high prevalence of obesity in children are increased BP levels (21).


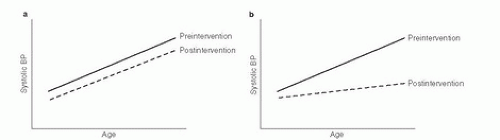
Fig. 66.2. A. Model in which a dietary intervention shifts age-blood pressure (BP) curve downward without affecting slope. B. Model in which a dietary intervention that shifts age-BP curve downward and reduces its slope. (Reprinted with permission from Appel LJ. Hypertension: A Companion to Braunwald’s Heart Disease. Philadelphia: Saunders, 2007:201-12.)


TABLE 66.1 SUMMARY OF THE EVIDENCE ON THE EFFECTS OF DIETARY FACTORS AND DIETARY PATTERNS ON BLOOD PRESSURE


HYPOTHESIZED EFFECT


EVIDENCE


Weight


Direct


++


Sodium chloride (salt)


Direct


++


Potassium


Inverse


++


Magnesium


Inverse


+/—


Calcium


Inverse


+/—


Alcohol


Direct


++


Fat


Saturated fat


Direct


+/—


Omega-3


Inverse


++


polyunsaturated fat


Omega-6


Inverse


+/—


polyunsaturated fat


Monounsaturated fat


Inverse


+


Protein


Total protein


Uncertain


+


Vegetable protein


Inverse


+


Animal protein


Uncertain


+/—


Carbohydrate


Uncertain


+/—


Fiber


Inverse


+


Cholesterol


Direct


+/—


Vitamin C


Inverse


+


Dietary patterns


Vegetarian diets


Inverse


++


DASH Diet


Inverse


++


+/-, limited or equivocal evidence; +, suggestive evidence, typically from observational studies and some clinical trials; ++, persuasive evidence, typically from clinical trials; DASH, Dietary Approaches to Stop Hypertension.


Reproduced with permission from Appel LJ, Brands MW, Daniels SR et al. Dietary approaches to prevent and treat hypertension: a scientific statement from the American Heart Association. Hypertension 2006;47:296-308.


TABLE 66.2 DIET-RELATED LIFESTYLE RECOMMENDATIONS


LIFESTYLE MODIFICATION


RECOMMENDATION


Weight loss


For overweight or obese persons, lose weight, ideally attaining a body mass index <25 kg/m2 For nonoverweight persons, maintain desirable body mass index <25 kg/m2


Reduced sodium intake


Lower sodium intake as much as possible, with a goal of no more than 2,300 mg/d in the general population and no more than 1,500 mg/d in blacks, middle-aged and older persons, and individuals with hypertension, diabetes, or chronic kidney disease


DASH-style dietary pattern


Consume a diet rich in fruits and vegetables (8-10 servings/d), rich in low-fat dairy products (2-3 servings/d), and reduced in saturated fat and cholesterol


Increased potassium intake


Increase potassium intake to 4.7 g/day, which is also the level provided in the DASH diet


Moderation of alcohol intake


For those who drink alcohol, consume ≤2 alcoholic drinks/ day (men) and <1 alcohol drinks/day (women)a


DASH, Dietary Approaches to Stop Hypertension.


a One alcoholic drink is defined as 12 oz of regular beer, 5 oz of wine (12% alcohol), or 1.5 oz of 80 proof distilled spirits.


Reproduced with permission from Appel LJ, Brands MW, Daniels SR et al. Dietary approaches to prevent and treat hypertension: a scientific statement from the American Heart Association. Hypertension 2006;47:296-308.


On average, weight loss reduces BP. The reduction in BP occurs before, and even without, attainment of an ideal body weight. In a meta-analysis of 25 trials, an average weight loss of 5.1 kg lowered mean SBP by 4.4 mm Hg and DBP by 3.6 mm Hg (22). In subgroup analyses, those who lost more weight had greater reductions in BP levels. Trials, dose-response analyses (23), and observational studies also provide evidence that greater weight loss leads to greater BP reduction.

Other research has documented that modest weight loss, with or without sodium reduction, can prevent overweight, nonhypertensive individuals from developing hypertension by about 20% (24) and can help decrease the number and doses of antihypertensive drugs in hypertensive individuals (25). Behavioral intervention trials have consistently achieved short-term weight loss, predominantly through a reduction in caloric intake. In several instances, substantial weight loss has also been maintained over 3 or more years (26, 27, 28), with regular physical activity recognized as a critical factor in sustaining weight loss. Whether weight loss can lessen the agerelated rise in SBP is uncertain (29). In one of the longest weight loss trials to date, mean BP still rose over time among the subgroup of individuals with sustained weight loss of greater than 10 lb (Fig. 66.3) (23).

Although further study of the effects of weight loss in combating the age-related rise in BP is needed, available evidence, in aggregate, strongly supports weight loss as an effective method for preventing and treating hypertension.


Reduced Salt (Sodium Chloride) Intake

Dietary sodium intake has a direct relationship with BP. Evidence of this relationship comes from animal studies, epidemiologic studies, clinical trials, and meta-analyses of
more than 50 randomized trials that have been performed to date. In a meta-analysis that focused on trials with plausible levels of sodium intake (30), a median reduction in urinary sodium of about 1.8 g/day (78 mmol/day) lowered SBP/DBP by 2.0/1.0 mm Hg in nonhypertensive individuals and by 5.0/2.7 mm Hg in hypertensive persons. A trial of 12 patients with resistant hypertension found that reducing sodium consumption by roughly 4500 mg/day lowered SBP/DBP by 22.7/9.1 mm Hg (31).


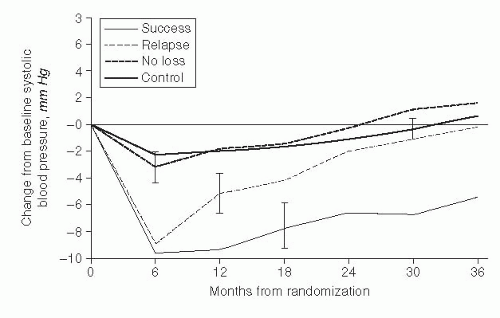
Fig. 66.3. Mean systolic blood pressure change in the Trials of Hypertension Prevention (TOHP2) in four groups of participants: those assigned to a weight loss group who successfully maintained weight loss, those assigned to a weight loss group who lost weight but experienced relapse, those assigned to a weight loss group who never lost weight, and the control group. (Reprinted with permission from Stevens VJ, Obarzanek E, Cook NR et al. Long-term weight loss and changes in blood pressure: results of the Trials of Hypertension Prevention, phase II. Ann Intern Med

Rigorously controlled, dose-response studies provide the most compelling evidence of the effects of sodium consumption on BP (32, 33). These trials each tested three or more sodium intake levels, and each trial found statistically significant, direct, progressive, dose-response relationships. The largest of these trials, the DASH-Sodium trial (32), tested the effects of each of three different sodium intakes on two different diets—the DASH diet (described in a subsequent section) and a control diet resembling a typical US diet. As estimated from 24-hour urine collections, the three sodium levels (termed lower, intermediate, and higher) provided 65, 107, and 142 mmol/day (or 1.5, 2.5, and 3.3 g/day), respectively, of sodium.

The main results of the DASH-Sodium trial are displayed in Figure 66.4 (32). The BP response to lower sodium intake, albeit direct and progressive, was nonlinear. Decreasing sodium consumption by approximately 0.9 g/day (40 mmol/day) caused a greater BP reduction when the starting sodium level was lower than 100 mmol/ day than when it was above this level. In subgroup analyses by race and gender (34, 35), reduced sodium intake significantly lowered BP in African-Americans, non-African-Americans, men, and women. Reducing sodium intake significantly lowered BP in nonhypertensive individuals who were following both the DASH and control diets. In addition to lowering BP, trials have shown that a reduced-sodium diet can prevent hypertension (relative risk reduction of ˜20%, with or without concomitant weight loss) (24). A reduced sodium intake can lower BP in individuals taking antihypertensive medications (36) and can improve hypertension control. In ecologic studies, a low sodium intake has also been associated with a reduction in the age-related rise in SBP.

Similar to other interventions, the BP response to change in dietary sodium intake is heterogeneous. Despite attempts to classify individuals in research studies as “salt sensitive” and “salt resistant,” the change in BP from a change in sodium intake is not binary (37). Instead, change in BP has a continuous distribution, meaning that individuals have greater or lesser degree of BP reduction. Although the BP response is varied, the magnitude of BP reduction resulting from reduced sodium intake is greater in blacks, middle-aged and older persons, and individuals with hypertension. These groups tend to have a less responsive renin-angiotensin-aldosterone system (38). There is speculation that sodium sensitivity is a phenotype that reflects subclinical kidney dysfunction (39). As discussed later, genetic and other dietary factors also affect the BP response to sodium. For example, the rise in BP for a given increase in sodium is diminished in
the setting of either the DASH diet (32) or a high dietary potassium intake.


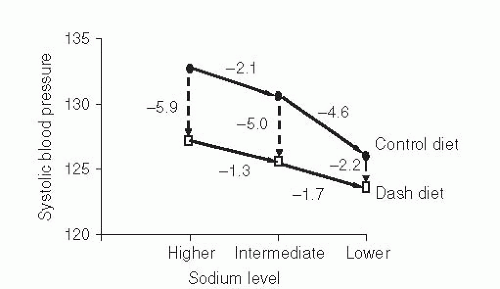
Fig. 66.4. Mean systolic blood pressure changes in the DASH-Sodium trial. The sample size was 412, 59% were prehypertensive, and 57% were African-American. Solid lines display the effects of sodium reduction in the two diets; hatched lines display the effects of the Dietary Approaches to Stop Hypertension (DASH) diet at each sodium level. (Adapted with permission from Sacks FM, Svetkey LP, Vollmer WM et al. Effects on blood pressure of reduced dietary sodium and the Dietary Approaches to Stop Hypertension [DASH] diet. DASH-Sodium Collaborative Research Group. N Engl J Med 2001;344:3-10.)

Observational studies have examined the relationship of sodium intake with CV outcomes. Substantial methodologic issues, often related to accuracy of sodium measurement, have made it methodologically challenging to find direct evidence of a relationship between sodium intake and CV disease (40). Despite these challenges, a metaanalysis of prospective observational studies found an association between higher sodium intake and increased risk of stroke and CV disease (41). Still, other studies (42, 43) have documented paradoxic findings, likely related to methodologic issues, especially given consistent findings of benefit in the few available trials with clinical outcomes (36, 44, 45).

Only gold members can continue reading. Log In or Register to continue

Stay updated, free articles. Join our Telegram channel

Jul 27, 2016 | Posted by in PUBLIC HEALTH AND EPIDEMIOLOGY | Comments Off on Diet and Blood Pressure1

Full access? Get Clinical Tree

Get Clinical Tree app for offline access