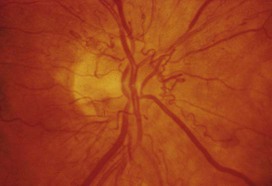
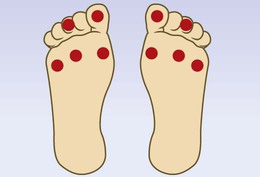
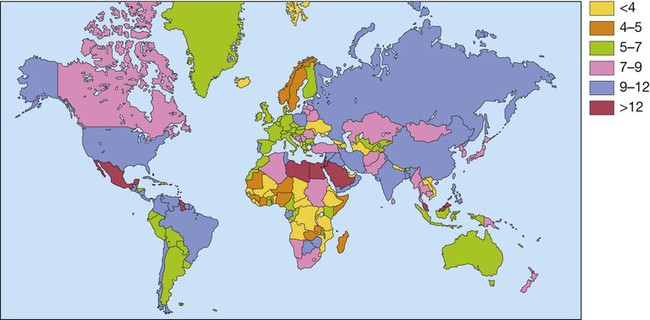
7 Examination of the eyes 11 Examination of the feet • Abnormal in stocking distribution in typical peripheral sensorimotor neuropathy • Testing light touch with monofilaments is sufficient for risk assessment; test other sensation modalities (vibration, pain, proprioception) only when neuropathy is being evaluated Diabetes mellitus is a clinical syndrome characterised by an increase in plasma blood glucose (hyperglycaemia). Diabetes has many causes (see Box 21.5, p. 807) but is most commonly due to type 1 or type 2 diabetes. Type 1 diabetes is caused by autoimmune destruction of insulin-producing cells (β cells) in the pancreas, resulting in absolute insulin deficiency, whereas type 2 diabetes is characterised by resistance to the action of insulin and an inability to produce sufficient insulin to overcome this ‘insulin resistance’. Hyperglycaemia results in both acute and long-term problems. Acutely, high glucose and lack of insulin can result in marked symptoms, metabolic decompensation and hospitalisation. Chronic hyperglycaemia is responsible for diabetes-specific ‘microvascular’ complications affecting the eyes (retinopathy), kidneys (nephropathy) and feet (neuropathy). There is a continuous distribution of blood glucose in the population, with no clear division between people with normal and abnormal values. The diagnostic criteria for diabetes (a fasting plasma glucose ≥ 7.0 mmol/L (126 mg/dL) or glucose 2 hours after an oral glucose challenge ≥ 11.1 mmol/L (200 mg/dL); see p. 807) have been selected to identify those who have a degree of hyperglycaemia which, if untreated, carries a significant risk of microvascular disease, and in particular diabetic retinopathy. Less severe hyperglycaemia is called ‘impaired glucose tolerance’. This is not associated with a substantial risk of microvascular disease, but is connected with an increased risk of large vessel disease (e.g. atheroma leading to myocardial infarction) and with a greater risk of developing diabetes in future. The incidence of diabetes is rising. Globally, it is estimated that 366 million people had diabetes in 2011 (approximately 8.3% of the world population, or 3 new cases every 10 seconds), and this figure is expected to reach 552 million by 2030. This global pandemic principally involves type 2 diabetes, the prevalence of which varies considerably around the world (Fig. 21.1), being associated with differences in genetic as well as environmental factors such as greater longevity, obesity, unsatisfactory diet, sedentary lifestyle, increasing urbanisation and economic development. A pronounced rise in the prevalence of type 2 diabetes occurs in migrant populations to industrialised countries, as in Asian and Afro-Caribbean immigrants to the UK or USA. Type 2 diabetes is now being observed in children and adolescents, particularly in some ethnic groups, such as Hispanics and Afro-Americans. After ingestion of a meal containing carbohydrate, normal blood glucose levels are maintained by: • suppression of hepatic glucose production • stimulation of hepatic glucose uptake • stimulation of glucose uptake by peripheral tissues (Fig. 21.2). Insulin, the primary regulator of glucose metabolism and storage (Box 21.1), is secreted from pancreatic β cells into the portal circulation in response to a rise in blood glucose (Fig. 21.3). A number of other factors released from the gut following food intake can augment insulin release, including amino acids and hormones such as glucagon-like peptide 1 (GLP-1) and gastrointestinal peptide (GIP). As a result, insulin release is greater when glucose is administered by mouth than when the same rise in plasma glucose is achieved by intravenous glucose infusion, a phenomenon termed the ‘incretin’ effect (see Fig. 21.3). The post-prandial rise in portal vein insulin and glucose, together with a fall in portal glucagon concentrations, suppresses hepatic glucose production and results in net hepatic glucose uptake. Depending on the size of the carbohydrate load, around one-quarter to one-third of ingested glucose is taken up in the liver. In addition, insulin stimulates glucose uptake in skeletal muscle and fat, mediated by the glucose transporter, GLUT 4. When intestinal glucose absorption declines between meals, portal vein insulin and glucose concentrations fall while glucagon levels rise. This leads to increased hepatic glucose output via gluconeogenesis and glycogen breakdown. The liver now resumes net glucose production and glucose homeostasis is maintained. The main substrates for gluconeogenesis are glycerol and amino acids, as shown in Figure 21.2. Type 1 diabetes is a T cell-mediated autoimmune disease (p. 86) involving destruction of the insulin-secreting β cells in the pancreatic islets. Progressive loss of β cell function takes place over a prolonged period (months to years), but marked hyperglycaemia, accompanied by the classical symptoms of diabetes, occurs only when 80–90% of the functional capacity of β cells has been lost. The pathology in the pre-diabetic pancreas is characterised by ‘insulitis’ (Fig. 21.4), with infiltration of the islets by mononuclear cells containing activated macrophages, helper cytotoxic and suppressor T lymphocytes, natural killer cells and B lymphocytes. Initially, these lesions are patchy and, until a very late stage, lobules containing heavily infiltrated islets are seen adjacent to unaffected lobules. The destructive process is β cell-specific, the glucagon and other hormone-secreting cells in the islet remaining intact. Islet cell antibodies are present before the clinical presentation of type 1 diabetes, and their detection can be useful in confirming a diagnosis of type 1 diabetes, but they are poorly predictive of disease progression and disappear over time (see Fig. 21.4). Type 1 diabetes is associated with other autoimmune disorders (Ch. 4), including thyroid disease (p. 738), coeliac disease (p. 880), Addison’s disease (p. 777), pernicious anaemia (p. 1025) and vitiligo (p. 1295). Genetic factors account for about one-third of the susceptibility to type 1 diabetes, the inheritance of which is polygenic (Box 21.2). Over 20 different regions of the human genome show some linkage with type 1 diabetes but most interest has focused on the human leucocyte antigen (HLA) region within the major histocompatibility complex on the short arm of chromosome 6; this locus is designated IDDM 1. The HLA haplotypes DR3 and/or DR4 are associated with increased susceptibility to type 1 diabetes in Caucasians and are in ‘linkage disequilibrium’, i.e. they tend to be transmitted together, with the neighbouring alleles of the HLA-DQA1 and DQB1 genes. The latter may be the main determinants of genetic susceptibility, since these HLA class II genes code for proteins on the surface of cells which present foreign and self antigens to T lymphocytes (p. 87). Candidate gene and genome-wide association studies have also implicated other genes in type 1 diabetes, e.g. CD25, PTPN22, IL2RA and IL-10, which are involved in immune recognition of pancreatic islet antigens, T-cell development and immune regulation. The genes associated with type 1 diabetes overlap with those for other autoimmune disorders, such as coeliac disease and thyroid disease, consistent with clustering of these conditions in individuals or families. Although genetic susceptibility appears to be a prerequisite for type 1 diabetes, the concordance rate between monozygotic twins is less than 40% (see Box 21.2), and wide geographic and seasonal variations in incidence suggest that environmental factors have an important role in precipitating disease. Patients with type 1 diabetes present when progressive β-cell destruction has crossed a threshold at which adequate insulin secretion and normal blood glucose levels can no longer be sustained. Above a certain level, high glucose levels may be toxic to the remaining β cells, so that profound insulin deficiency rapidly ensues, causing the metabolic sequelae shown in Figure 21.5. Hyperglycaemia leads to glycosuria and dehydration, causing fatigue, polyuria, nocturia, thirst and polydipsia, susceptibility to urinary and genital tract infections, and later tachycardia and hypotension. Unrestrained lipolysis and proteolysis result in weight loss. Ketoacidosis occurs when generation of ketone bodies exceeds the capacity for their metabolism. Elevated blood H+ ions drive K+ out of the intracellular compartment, while secondary hyperaldosteronism encourages urinary loss of K+. Thus patients usually present with a short history (typically a few weeks) of hyperglycaemic symptoms (thirst, polyuria, nocturia and fatigue), infections and weight loss, and may have developed ketoacidosis (p. 811). Type 2 diabetes is a diagnosis of exclusion, i.e. it is made when type 1 diabetes and other types of diabetes (see Box 21.5, p. 807) are ruled out, and is highly heterogeneous. The natural history of typical type 2 diabetes is shown in Figure 21.6. Initially, insulin resistance leads to elevated insulin secretion in order to maintain normal blood glucose levels. However, in susceptible individuals, the pancreatic β cells are unable to sustain the increased demand for insulin and a slowly progressive insulin deficiency develops. Some patients develop diabetes at a young age, usually driven by insulin resistance due to obesity and ethnicity; others, particularly the elderly, develop diabetes despite being non-obese and may have more pronounced β-cell failure. The key feature is a ‘relative’ insulin deficiency, such that there is insufficient insulin production to overcome the resistance to insulin action. This contrasts with type 1 diabetes, in which there is rapid loss of insulin production and an absolute deficiency, resulting in ketoacidosis and death if the insulin is not replaced. Type 2 diabetes, or its antecedent, impaired glucose tolerance, is one of a cluster of conditions thought to be caused by resistance to insulin action. Thus, patients with type 2 diabetes often have associated disorders including hypertension, dyslipidaemia (characterised by elevated levels of small dense low-density lipoprotein (LDL) cholesterol and triglycerides, and a low level of high-density lipoprotein (HDL) cholesterol), non-alcoholic fatty liver (p. 959) and, in women, polycystic ovarian syndrome. This cluster has been termed the ‘insulin resistance syndrome’ or ‘metabolic syndrome’, and is much more common in patients who are obese. Deposition of fat in the liver is a common association with central obesity and is exacerbated by insulin resistance and/or deficiency. Many patients with type 2 diabetes have evidence of fatty infiltration of the liver (non-alcoholic fatty liver disease (NAFLD)). This condition may improve with effective treatment of the diabetes and dyslipidaemia, but despite this, a few patients progress to non-alcoholic steatohepatitis (NASH, p. 959) and cirrhosis. In the early stages of type 2 diabetes, reduction in the total mass of pancreatic islet tissue is modest. At the time of diagnosis, around 50% of β-cell function has been lost and this declines progressively (see Fig. 21.6B). Some pathological changes are typical of type 2 diabetes, the most consistent of which is deposition of amyloid in the islets. In addition, elevated plasma glucose and FFAs exert toxic effects on pancreatic β cells to impair insulin secretion. However, while β-cell numbers are reduced, β-cell mass is unchanged and glucagon secretion is increased, which may contribute to hyperglycaemia. Genetic factors are important in type 2 diabetes, as shown by marked differences in susceptibility in different ethnic groups and by studies in monozygotic twins where concordance rates for type 2 diabetes approach 100%. However, many genes are involved and the chance of developing diabetes is also influenced very powerfully by environmental factors (Box 21.3). Genome-wide association studies have identified over 65 genes or gene regions that are associated with type 2 diabetes, each exerting a small effect. The largest effect is seen with variation in TCF7L2; the 10% of the population with two copies of the risk variant for this gene have a nearly twofold increase in risk of developing type 2 diabetes. Most of the genes known to contribute to risk of type 2 diabetes are involved in β-cell function or in regulation of cell cycling and turnover, suggesting that altered regulation of β-cell mass is a key factor. Epidemiological studies show that type 2 diabetes is associated with overeating, especially when combined with obesity and underactivity. Middle-aged people with diabetes eat significantly more and are fatter and less active than their non-diabetic siblings. The risk of developing type 2 diabetes increases tenfold in people with a body mass index (BMI) of more than 30 kg/m2 (p. 115). However, although the majority of patients with type 2 diabetes are obese, only a minority of obese people develop diabetes, as the majority of obese patients are able to increase insulin secretion to compensate for the increased demand resulting from obesity and insulin resistance. Those who develop diabetes may have genetically impaired β-cell function, reduced β-cell mass, or a susceptibility of β cells to attack by toxic substances such as FFAs or inflammatory cytokines. Type 2 diabetes is more common in the middle-aged and elderly (Box 21.4). In the UK, it affects 10% of the population over 65, and over 70% of all cases of diabetes occur after the age of 50 years. • Prevalence: increases with age, affecting ~10% of people over 65 years. Half of these people are undiagnosed. Impaired β-cell function and exaggerated insulin resistance with ageing both contribute. • Glycosuria: the renal threshold for glucose rises with age, so glycosuria may not develop until the blood glucose concentration is markedly raised. • Pancreatic carcinoma: may present in old age with the development of diabetes, in association with weight loss and diminished appetite. Patients with type 2 diabetes have a slow onset of ‘relative’ insulin deficiency. Relatively small amounts of insulin are required to suppress lipolysis, and some glucose uptake is maintained in muscle, so that, in contrast with type 1 diabetes, lipolysis and proteolysis are not unrestrained and weight loss and ketoacidosis seldom occur. In type 2 diabetes, hyperglycaemia tends to develop slowly over months or years; because of this insidious onset many cases of type 2 diabetes are discovered coincidentally and a large number are undetected. At diagnosis, patients are often asymptomatic or give a long history (typically many months) of fatigue, with or without ‘osmotic symptoms’ (thirst and polyuria). In some patients with type 2 diabetes, presentation is late and pancreatic β-cell failure has reached an advanced stage of insulin deficiency (see type 1 diabetes, p. 803). These patients may present with weight loss but ketoacidosis is uncommon. However, in some ethnic groups, such as African Americans, half of those whose first presentation is with diabetic ketoacidosis have type 2 diabetes. Intercurrent illness, e.g. with infections, increases the production of stress hormones which oppose insulin action, such as cortisol, growth hormone and catecholamines. This can precipitate an acute exacerbation of insulin resistance and insulin deficiency, and result in more severe hyperglycaemia and dehydration (see hyperglycaemic hyperosmolar state, p. 814). Other causes of diabetes are shown in Box 21.5. In most cases, there is an obvious cause of destruction of pancreatic β cells. Some acquired disorders, notably other endocrine diseases such as acromegaly (p. 792) or Cushing’s syndrome (p. 773), can precipitate type 2 diabetes in susceptible individuals. • Genetic defects of β-cell function (see Box 21.6) • Genetic defects of insulin action (e.g. leprechaunism, lipodystrophies) • Pancreatic disease (e.g. pancreatitis, pancreatectomy, neoplastic disease, cystic fibrosis, haemochromatosis, fibrocalculous pancreatopathy) • Excess endogenous production of hormonal antagonists to insulin, e.g. • Drug-induced (e.g. corticosteroids, thiazide diuretics, phenytoin) • Uncommon forms of immune-mediated diabetes (e.g. IPEX (immunodysregulation polyendocrinopathy X) syndrome) • Associated with genetic syndromes (e.g. Down’s syndrome; Klinefelter’s syndrome; Turner’s syndrome; DIDMOAD (Wolfram’s syndrome) – diabetes insipidus, diabetes mellitus, optic atrophy, nerve deafness; Friedreich’s ataxia; myotonic dystrophy) A number of unusual genetic diseases are associated with diabetes. In rare families, diabetes is caused by single gene defects with autosomal dominant inheritance. These subtypes constitute less than 5% of all cases of diabetes and typically present as ‘maturity-onset diabetes of the young’ (MODY), i.e. non-insulin-requiring diabetes presenting before the age of 25 years (Box 21.6). Very rarely, diabetes can develop at or soon after birth. This neonatal diabetes is usually genetic in origin, with 50% due to mutations in the KATP channel of the pancreatic β cell causing insulin deficiency and diabetic ketoacidosis. However, sulphonylurea drugs overcome the defect in potassium channel signalling, so that insulin therapy is not necessary in these cases. maturity-onset diabetes of the young (MODY)
Diabetes mellitus
Clinical examination of the patient with diabetes

Functional anatomy and physiology
Normal glucose and fat metabolism
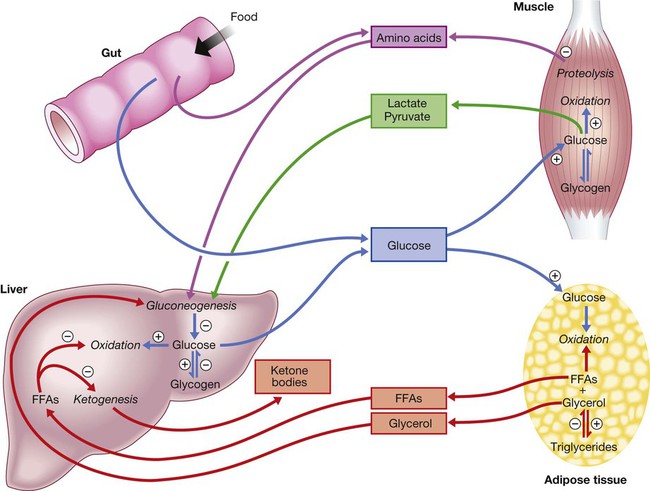
⨁ indicates stimulation and  indicates suppression by insulin. In response to a rise in blood glucose, e.g. after a meal, insulin is released, suppressing gluconeogenesis and promoting glycogen synthesis and storage. Insulin promotes the peripheral uptake of glucose, particularly in skeletal muscle, and encourages storage (as muscle glycogen). It also promotes protein synthesis and lipogenesis, and suppresses lipolysis. The release of intermediate metabolites, including amino acids (glutamine, alanine), 3-carbon intermediates in oxidation (lactate, pyruvate) and free fatty acids (FFAs), is controlled by insulin. In the absence of insulin, e.g. during fasting, these processes are reversed and favour gluconeogenesis in liver from glycogen, glycerol, amino acids and other 3-carbon precursors.
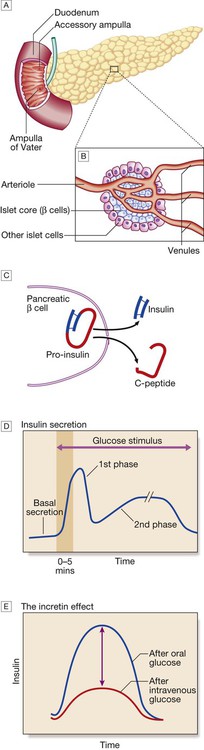
A The normal adult pancreas contains about 1 million islets, which are scattered throughout the exocrine parenchyma. Histology is shown in Figure 21.4. B The core of each islet consists of β cells that produce insulin, and is surrounded by a cortex of endocrine cells that produce other hormones, including glucagon (α cells), somatostatin (δ cells) and pancreatic polypeptide (PP cells). C Pro-insulin in the pancreatic β cell is cleaved to release insulin and equimolar amounts of inert C-peptide (connecting peptide). Measurement of C-peptide can be used to assess endogenous insulin secretory capacity. D An acute first phase of insulin secretion occurs in response to an elevated blood glucose, followed by a sustained second phase. E The incretin effect describes the observation that insulin secretion is greater when glucose is given by mouth than when glucose is administered intravenously to achieve the same rise in blood glucose concentrations. The additional stimulus to insulin secretion is mediated by release of peptides from the gut and these actions are exploited in incretin-based therapies (p. 823).
Aetiology and pathogenesis of diabetes
Type 1 diabetes
Pathology
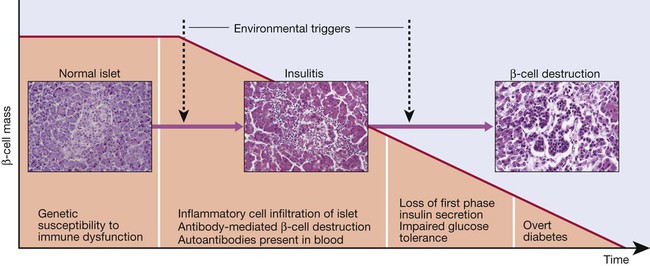
Proposed sequence of events in the development of type 1 diabetes. Environmental triggers are described in the text.
Genetic predisposition
Environmental predisposition
Metabolic disturbances in type 1 diabetes
Type 2 diabetes
Pathology
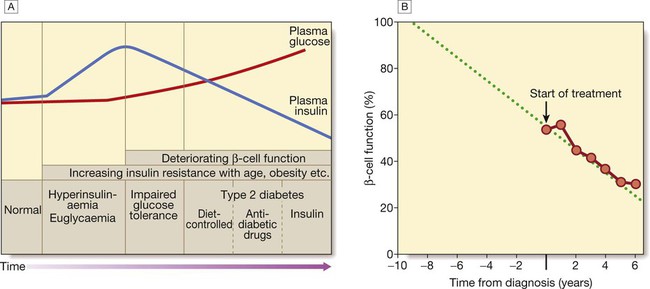
A In the early stage of the disorder, the response to progressive insulin resistance is an increase in insulin secretion by the pancreatic cells, causing hyperinsulinaemia. Eventually, the β cells are unable to compensate adequately and blood glucose rises, producing hyperglycaemia. With further β-cell failure, glycaemic control deteriorates and treatment requirements escalate. B Progressive pancreatic β-cell failure in patients with type 2 diabetes in the United Kingdom Prospective Diabetes Study (UKPDS). Beta-cell function was estimated using the homeostasis model assessment (HOMA) and was already below 50% at the time of diagnosis. Thereafter, long-term incremental increases in fasting plasma glucose were accompanied by progressive β-cell dysfunction. If the slope of this progression is extrapolated, it appears that pancreatic dysfunction may have been developing for many years before diagnosis of diabetes. Part B adapted from Holman 1998 – see p. 836.
Insulin resistance
Pancreatic β-cell failure
Genetic predisposition
Environmental and other risk factors
Diet and obesity
Age
 21.4 Diagnosis of diabetes mellitus in old age
Metabolic disturbances in type 2 diabetes
Other forms of diabetes
 21.5 Aetiological classification of diabetes mellitus
 21.6 Monogenic diabetes mellitus
Functional defect
Main type*
Gene mutated*
β-cell glucose sensing
MODY2
GCK
The set point for basal insulin release is altered, causing a high fasting glucose, but sufficient insulin is released after meals. As a result, the HbA1c is often normal and microvascular complications are rare. Treatment is rarely required
β-cell transcriptional regulation
MODY3
HNF-1α
MODY5
HNF-1β
MODY1
HNF-4α
Diabetes develops during adolescence/early adulthood and can be managed with diet and tablets for many years, but ultimately, insulin treatment is required. The HNF-1α and 4α forms respond particularly well to sulphonylurea drugs. All types are associated with microvascular complications. HNF-1β mutations also cause renal cysts and renal failure ![]()
Stay updated, free articles. Join our Telegram channel

Full access? Get Clinical Tree


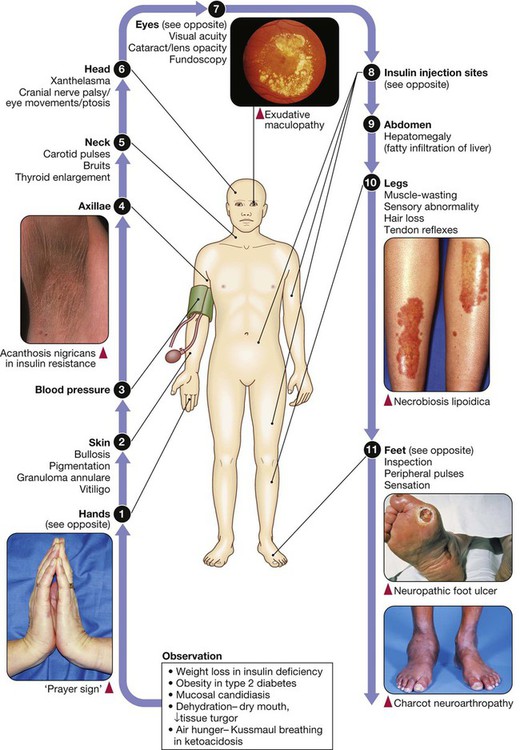
 hands,
  blood pressure,
  and
and  axillae and neck,
  eyes,
eyes,  insulin injection sites and
  feet.
feet.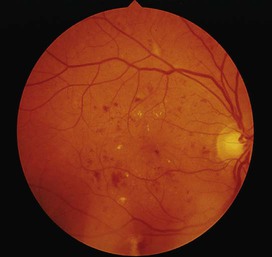

 21.1
21.1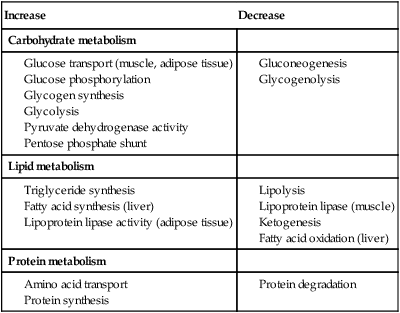
 21.2
21.2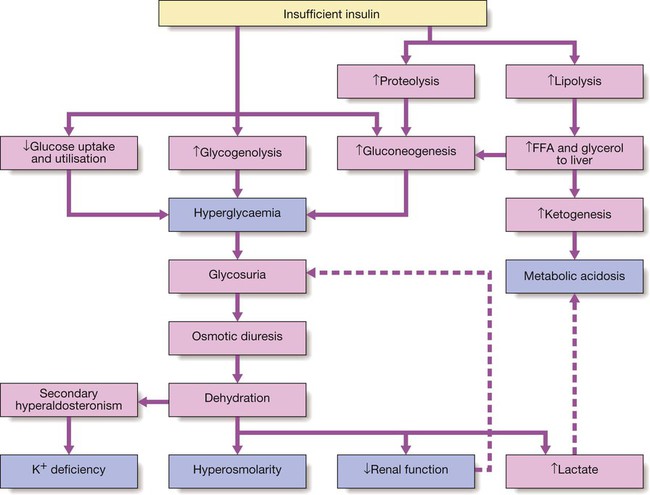
 21.3
21.3