Table 18.2. Rates (%) needed to be induced in the treated group in order to achieve levels of power of 50% and 90% of detecting an effect based on Fisher’s exact test and group size of 50

For those studies with very small group sizes, descriptive statistics of the variables collected may be sufficient for the investigator to see the preliminary results of the experiment and to make decisions on how to proceed next in his or her research program.
For toxicity studies using slightly large group sizes of 20–25 animals, statistical inferences can be performed. However, as mentioned above, it is still important to address the issue of the power of statistical tests. With the abovementioned group sizes, statistical tests will not be able to detect the effects of small differences between control and treated animals under regular statistical analysis practices such as using 0.05 or 0.01 level of significance and using normal approximation to calculate the statistical significance level (i.e. p-value). The investigator has to recognise the limitation of small group size on the power of statistical tests in their interpretations of the study results. They may have to assume a much larger type I error (false positive), the error of rejecting a true null hypothesis, as an unavoidable expense to increase the power of a statistical test. Otherwise, a non-statistically significant result is more likely to mean that the statistical test does not have enough power to detect a true toxic effect than to indicate that there is no such toxic effect of the drug.
In the analysis of continuous variable data, the global null hypothesis of equal means or medians of the variable of treatment groups can be tested by analysis of variance (ANOVA)9,10 or analysis of covariance (ANCOVA)9,10 or their corresponding non-parametrics procedures such as Kruskal–Wallis test.11 Again, if the global null hypothesis of equal means or medians is rejected, pairwise comparisons between means of pairs of individual treatment groups or between means of pairs of subsets of treatment groups can be performed by testing various contrasts about the population means to obtain further information about the patterns of difference in the populations. Dose–responses in those continuous variables collected in a toxicity study can be tested either by using the regression procedure or by testing the special contrasts of the means in ANOVA developed for testing trends or the Jonckheere test.11–13
Categorical, especially binary, data from toxicity studies are also collected. Pearson’s Chi-Square test and Fisher’s exact test11 can be used to test pairwise differences in proportion between pairs of treatment groups. The Cochran–Armitage test14–16 and the permutation trend test7,8 can be used to test the dose–response in proportion in binary variables. For data with more than two categories, the Wilcoxon rank sum test11 and Jonckheere’s test11–13 can be used for the evaluation of pairwise differences and dose–responses in those categorical variables.
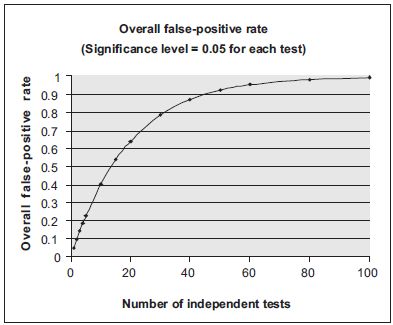
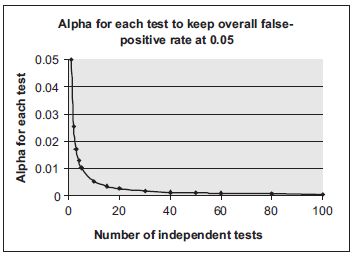
The above comparisons between means, medians or proportions of pairs or subsets of treatment groups all involve multiple testing. It is therefore important to control the overall type I error by adjusting the effect of multiple tests in those statistical analyses. The need for such an adjustment is exemplified in Figures 18.1 and 18.2. As shown in Figure 18.1, if the multiplicity effect is not properly adjusted the overall false positive rate increases dramatically with the number of tests performed. Figure 18.2 illustrates the simplest, but not necessarily the most appropriate, method of adjustment for multiple comparisons, the Bonferroni method.17,18 For ‘n’ tests with an overall significance level α, the Bonferroni adjustment controls overall false positive rate by using an adjusted significance level of α/n for each individual test. Various methods of multiplicity adjustment have been proposed. The books by Hochberg and Tamhane17 and Westfall and Young18 provide extensive discussions on those methods.
The parametric methods of probit and logit analysis19–23 are widely used to estimate LD50 and confidence interval for LD50 single-dose acute studies. Some non-parametric methods such as the one described in24 can also be used to estimate the above parameters.
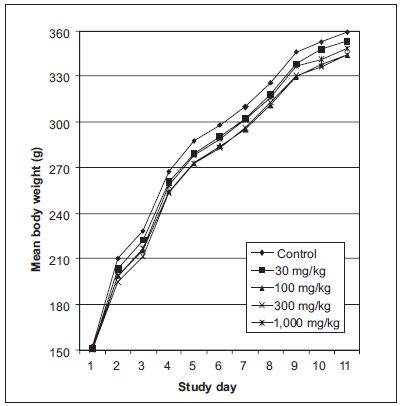
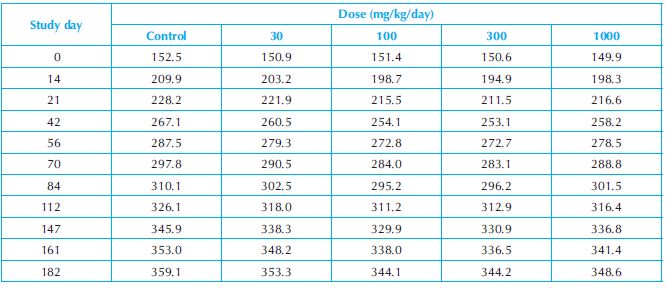
Numerical example: The ANOVA procedure is applied to the data of a 6-month repeat-dose toxicity study in male rats. There were five dose groups in the study and 15 animals in each dose group. The bodyweight data were recorded at 11 time points during the study. The group mean bodyweights of the study are presented in Table 18.3 and Figure 18.3.
Table 18.3. Group mean bodyweights of a 6-month toxicity study in male rats
A one-way fixed-effect ANOVA with repeated measurements is applied to the bodyweight data of the study. The analysis results are presented in Table 18.4 below.
Table 18.4. Analysis of variance results of the bodyweight data of male rats in a 6-month toxicity study

The results show that the group mean bodyweights are not significantly different between the dose groups (p = 0.1161), but the group mean bodyweights are significantly different between different time points (p < 0.0001). The findings suggest absence of drug effect on bodyweight.
Genotoxicity Studies
The purpose of genotoxicity studies of a compound is to determine if the compound induces genetic damage. Genotoxicity studies are important in the safety evaluation of new drugs.25 They are used for detection of new drugs that induce mutation in somatic and germ cells, for assessment of drug hazard potential in the development of genetic diseases, and for prediction of new drug in vivo carcinogenicity studies in rodents.
There are many assays using different experimental units for assessment of damages to different components of the genetic system. Some are widely used and better validated than others. They can be classified into the following categories: in vitro microbial colony assays, in vitro mammalian cell gene mutation assays, in vitro bacterial/mammalian fluctuation assays, in vitro and in vivo cytogenetic assays, in vitro and in vivo sister chromatid exchange assays, in vivo dominant lethal assays, experiments using Drosophila fruit flies and experiments using transgenic animals. Three tests are recommended by the ICH26 and the FDA27 for evaluation of the genotoxic potential of a new drug: (i) an in vitro test for gene mutation in bacteria (the Ames test), (ii) an in vitro cytogenetic evaluation of chromosomal damage using mammalian cells, or an in vitro mouse lymphoma tk assay and (iii) an in vivo study for chromosomal damage in rodent haematopoietic cells (This in vivo test for chromosomal damage in rodents could be an analysis of chromosomal aberrations in bone marrow and/or peripheral blood cells of animals.) However, the 2006 FDA Guidance for industry and review staff27 encourages the completion the fourth test in the ICH battery, if one or more of the above three assays are positive.
Ames Assay (Salmonella/Escherichia coli reverse mutation assay)
The Ames assay is the most widely used, most validated and has the most complete historical data among in vitro mutagenicity tests. It was designed to detect reverse mutation for auxotrophic cells requiring histidine for growth (His–) to histidine-independent prototrophic cells (His+). Cells are cultured in a soft agar containing a trace amount of histidine to allow residual growth of auxotrophic bacteria.
Study Design
Methods of Statistical Analysis of Data of Ames Assay
Modelling Numbers of Revertant Colonies
It is usually assumed in Ames tests that all microbes, whether on the same plate or not, behave in a stochastic manner independent of each other, and that each microbe placed on a particular plate experiences the same environment as any other microbe placed on the same plate. Under the above experimental conditions and assumptions, the number of revertant colonies observed on a plate can be modelled approximately by a Poisson distribution.
However, if there are replicate counts, there usually will be plate-to-plate variability. Because of uncontrollable assay factors, distributions of data from Ames test assays generally show that the variance is greater than the mean. The Poisson distribution has the property that the variance is equal to the mean, and may not be appropriate for modelling the plate-to-plate variability in number of revertant colonies in Ames tests. The use of the Poisson distribution without considering the above uncontrollable factors can substantially underestimate the evidence of mutagenicity of a new drug. This leads to the use of the negative binomial distribution, which allows the mean of the Poisson distribution to vary according to the gamma distribution, and thus to model the plate-to-plate variability in number of revertant colonies.
Modelling Dose Response in Number of Revertant Colonies
There are two different statistical approaches to the modelling of numbers of revertant colonies in Ames assay. The first approach uses complex mathematical models based on the mechanisms for revertant colony formation and toxicity of an assay.28–30 This group of procedures considers the toxic effect in addition to the mutagenic effect of the tested new drug to reflect the possible non-monotonic or downturn phenomenon in number of revertant colonies. They also consider the multigenerational phenomenon of the reverse mutation process. The second approach consists of empirically based procedures.31–35 They use regular statistical procedures, such as analysis of variance and regression analysis, without relying much on scientific knowledge of biological mechanisms of the assays. Most of those procedures also include terms for testing the mutagenic and toxic effects of the tested new drug. The selection of methods to be used depends largely on the design of a study. In general, the empirical approach is used when data for common doses are available. When there are no such data available, the mechanism-based approach is used.
Methods for Estimating Parameters of Distributions and Testing the Dose Response in Number of Revertant Colonies
The maximum likelihood method29,30 and the quasi-likelihood method36 have been proposed to estimate the parameters of the above negative binomial distribution used in the modelling of numbers of revertant colonies.
The likelihood ratio test can be used to test the homogeneity, the dose–response and the pairwise difference between the control group and each of the treated groups in group mean number of revertant colonies. For the test of dose–response effects, a specific dose–response function links the relationship between the group mean number of revertant colonies with dose selected from those based on biologically or empirically based methods discussed above such as log(µi) = β0 + β1di. A more detailed discussion on the use of the likelihood ratio test in tests of treatment effects is included in the section on methods of statistical analysis of data of reproductive and development toxicity studies
Methods of Statistical Analysis of Data from Other Genotoxicity Assays
As mentioned above, for the evaluation of the genotoxicity of a new drug both ICH26 and FDA27 recommend that an in vitro test with cytogenetic evaluation of chromosomal damage using mammalian cells (or an in vitro mouse lymphoma thymidine kinase+/– gene mutation assay), and an in vivo test for chromosomal damage using mammalian haematopoietic cells (micronucleus assay) should also be conducted, in addition to the test for gene mutations in bacteria described above. Methods of statistical analysis of data of these and other recommended tests are discussed in this subsection.
The purpose of the in vitro chromosomal aberration test is to identify agents that cause structural chromosomal aberrations in cultured mammalian cells. The experimental unit is the cell, and the percentage of cells with structural chromosomal aberration(s) is the main endpoint for the evaluation of chromosomal aberration of the new drug.
The dose–response and pairwise differences of data proportions of cells with chromosomal aberration can be analysed by the Cochran–Armitage trend test14–16 and Fisher’s exact test.37,38 Logistic regression39 using µi = exp(β0 + β1di)/(1 + exp[β0 + β1di]) can also be used to test the dose–response effect in the proportion of cells with chromosomal aberration. In a regular experiment, there are only two replicates for each treatment group. The evaluation of replicate-to-replicate extra-binomial variability by assuming the proportions are distributed with a beta-binomial distribution will not be meaningful. Data of both replicates can be combined in the analysis.
The main purpose of the in vitro mouse lymphoma tk cell assay is to detect gene alterations (mutations), although it can also be used to detect chromosomal aberrations, induced by chemical substances. The main endpoint of the assay is mutant cell relative frequency, defined as the number of mutant cells observed divided by the number of viable cells.
As in Ames assay, if only two or three replicate plates are conducted for each group, the number of mutant cells in in vitro mouse lymphoma tk cell assay can be modelled by a negative binomial distribution40 when the plate-to-plate variability is considered, or by a Poisson distribution when the plate-to-plate variability is not considered. The maximum likelihood method, and the quasi-likelihood method mentioned above can be used to estimate the parameters of the negative binomial distribution used in the modelling of numbers of mutant cells. The likelihood ratio test41 can be used to test the homogeneity, the dose–response, and the pairwise difference between the control group and each of the treated groups in group mean number of mutant cells. The log linear function, log µi = β0 + β1di,39 can be used in the likelihood ratio test for dose–response in the number of mutant cells.
The mammalian erythrocyte micronucleus assay is the most widely used in vivo test for the detection of damage induced by the test substance to the chromosomes or the mitotic apparatus of erythroblasts by analysis of erythrocytes as sampled in bone marrow and/or peripheral blood cells of animals, usually rodents. The purpose of the micronucleus test is to identify substances that cause cytogenetic damage which results in the formation of micronuclei containing lagging chromosome fragments or whole chromosomes. An increase in the frequency of micronucleated polychromatic erythrocytes in treated animals is an indication of induced chromosome damage.
The endpoints of interest in the micronucleus test are the proportion of immature erythrocytes among a total of at least 200 erythrocytes counted in bone marrow for each of at least five animals per sex, and the proportion of micronucleated immature erythrocytes among a total of at least 2,000 immature erythrocytes counted for each of at least five animals per sex in peripheral blood.
The dose–response and pairwise differences of data proportions of immature erythrocytes and the proportion of micronucleated immature erythrocytes can also be analysed by the Cochran–Armitage trend test and Fisher’s exact test, respectively, using binary erythrocyte data. As above, logistic regression method with µi = exp(β0 + β1di)/(1 + exp[β0 + β1di]) can also be used to test the dose–response effect in the above proportions for binary erythrocyte data. The proportion of the immature erythrocytes or the proportion of micronucleated immature erythrocytes can be modelled by a beta-binomial distribution42 if it is believed that replicate-to-replicate extra-binomial variability exists in the assay.
As noted previously, the maximum likelihood method and the quasi-likelihood method mentioned above can be used to estimate the parameters of the above beta-binomial distribution. The likelihood ratio test can be used to test the homogeneity, the dose–response, and the pairwise differences between the control group and each of the treated groups in the group endpoint proportions. The logistic linear function, µi = exp(β0 + β1di)/(1 + exp[β0 + β1di]), can be used in the likelihood ratio test for dose–response in the endpoint proportions. Logistic regression can also be used to test the dose–response effect in the proportion of immature erythrocytes or the proportion of micronucleated immature erythrocytes.
Sister-chromatid exchange (SCE) tests (both in vitro and in vivo) are used for the detection of damage induced by test substance to the chromosomes. The experimental unit is the cell and the number of SCEs per chromosome for each metaphase is the main endpoint for the evaluation of chromosomal aberration of a new drug. The numbers of SCE for the cells (or chromosomes if such data are available) in a culture plate are usually assumed to be independent and follows a Poisson or negative binomial distribution (if the parameter of the Poisson distribution is considered as random and follow a gamma distribution). Parameters of the Poisson or the negative binomial distribution can be estimated using the maximum likelihood method or weighted least squares method, and the likelihood ratio test can be used to the homogeneity, the dose–response, and the pairwise difference between the control group and each of the treated groups in group mean number of SCE frequency. The log linear function, log µi = β0 + β1di, can be used in the likelihood ratio test for dose–response in SCE frequency. The dose–response effect can also be analysed by log linear regression.
Numerical example: The Cochran–Armitage trend test and the logistic regression procedure are applied to the data from an in vitro study of chromosome with structural aberration in Chinese hamster lung (CHL) cells (without metabolic activation) to test if there is a dose–response relationship in the proportion of cells with aberrations. The data of the study are presented in Table 18.5. In the study, there were seven treatment groups including a solvent group and a positive control group. There were two replicates for each treatment group and 100 cells scored in each replicate. There were two kinds of chromosomal aberration observed in the study: including and excluding gaps. The results of the tests are presented in Table 18.6. The analysis results show that there are a very statistically significant dose–response relationships in proportion of cells with aberration including and excluding gaps. As expected, the test results also show that there is no difference between the two replicates in terms of cells with aberration either including or excluding gaps.
Table 18.5. Summary of numbers of structural aberration in CHL cells (without metabolic activation)
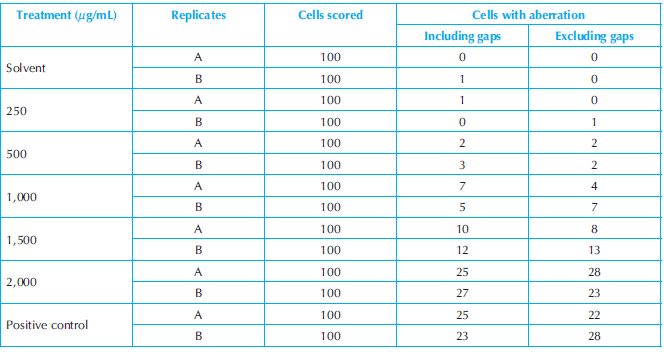
Table 18.6. Results of statistical analysis of chromosomal aberration study data

Reproductive and Developmental Toxicity (DART) Studies
The purpose of DART studies of a compound is to determine the adverse effects of a compound or its metabolite on mammalian reproduction and to assess potential risks to humans. ICH guidelines (S5A and S5B)43, 44 recommend that to allow detection of immediate and latent effects of exposure, observations should be continued through one complete life cycle, that is, from conception in one generation through the conception of the following generation. The entire life cycle is divided into the following stages: (i) premating to conception; (ii) conception to implantation; (iii) implantation to closure of the hard palate; (iv) closure of the hard palate to the end of pregnancy; (v) birth to weaning and (vi) weaning to sexual maturity.
There are three test protocols (Segments I, II and III) for testing the reproductive and developmental effects of a new drug described in the ICH guidelines. The Segment I study that covers stages A and B of the life cycle is a study of the toxic effects of the drug on fertility and early embryonic development of the test animals. The Segment II (or teratology) study that covers stages C to D is a study of toxic effects on embryo-foetal development (organogenesis). The Segment III study that covers stages C to F is a study of toxic effects of the drug on prenatal and postnatal development, including maternal function. This section of the chapter includes some information on study designs directly from the ICH guideline documents and Lakings.45
Segment I: Drug Effects on Male and Female Fertility and Early Embryonic Development to Implantation
The purpose of the study is to test for toxic effects or disturbances of a new drug on male and female fertility, general reproductive processes, and the development of offspring resulting from the treatment of a new drug from before mating (males/females) through mating and implantation.
Study Design
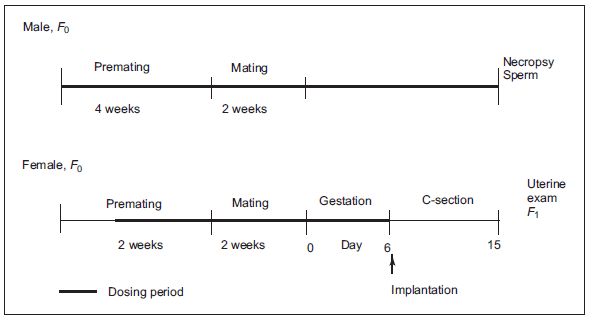
Figure 18.4 Scheme of Segment I: Study for drug effects on male and female fertility and early embryonic development to implantation.
Segment II: Drug Effects on Embryo-Foetal Development
The purpose of the Segment II (or teratology) study is to determine the adverse effects of exposure to a new drug during the period of major organogenesis on embryo/foetal development (from female pregnancy to hard palate closure) including the production of structural alterations, that is, to determine the potential for embryotoxicity or teratogenic effects of a new drug.
Study Design
Stay updated, free articles. Join our Telegram channel

Full access? Get Clinical Tree


