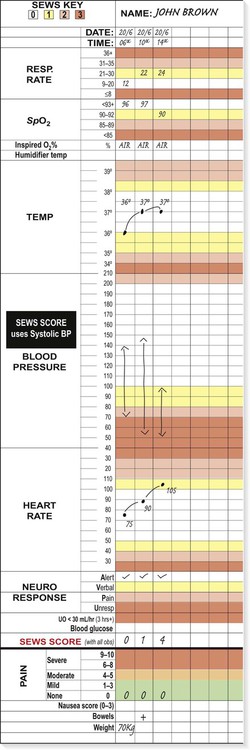
early warning scores • Record standard observations: • Note whether the observation falls in a shaded ‘at-risk zone’ (see SEWS key) • Add the points scored and record total SEWS score on chart If SEWS score ≥ 4, a doctor should assess the patient within 20 mins. If SEWS score ≥ 6, a senior doctor should assess the patient within 10 mins. *Peripheries may be cool in sepsis with hypovolaemia, or if myocardial depression is present. A critically ill patient is at imminent risk of death. Recognition, assessment and management of critical illness are thus fundamental to clinical care in any area of medicine. The principle underpinning intensive care is the simultaneous assessment of illness severity and stabilisation of life-threatening physiological abnormalities. The goal is to prevent deterioration and effect improvements as the diagnosis is established, and treatment of the underlying definitive disease process(es) is initiated. Blinkered attention to either resuscitation or diagnosis in isolation results in worse outcomes and increased mortality; the two processes are inextricably interlinked. Appropriate physiological monitoring is required to allow continuing assessment and re-assessment of response to therapy, wherever the clinical environment. Atmospheric oxygen moves down a partial pressure gradient from air, through the respiratory tract, from alveoli to arterial blood and then to the capillary beds and cells, diffusing into the mitochondria, where it is utilised at cytochrome a3 (Fig. 8.1). The movement of oxygen from the left ventricle to the systemic tissue capillaries is known as oxygen delivery (DO2), and is the product of cardiac output (flow) × arterial oxygen content (CaO2) The latter is the product of haemoglobin (Hb) × arterial oxygen saturation of haemoglobin (SaO2) × 1.34. By increasing cardiac output, arterial oxygen saturation or haemoglobin concentration, DO2 will be increased. The atrial filling pressures, or preload, determine the end-diastolic ventricular volume, which, according to Starling’s Law and depending on myocardial contractility, defines the force of cardiac contraction and the stroke volume (see Fig. 18.22, p. 547). The principal determinant of preload is venous return, determined by the intravascular volume, venous ‘tone’ and intrathoracic pressure. This can be measured as the central venous pressure (CVP), as described on page 185 (Box 8.1). If the preload is low, volume loading with intravenous fluids is the priority and is the most appropriate means of improving cardiac output and tissue perfusion. The choice of fluid for volume loading is controversial, but as there is no clear advantage of colloid over crystalloid, sodium chloride is used. Fluid challenges of 200–250 mL should be administered rapidly over a couple of minutes, and titrated against heart rate, blood pressure (BP), peripheral circulation, and measurements of CVP (Fig. 8.2). Red cells have traditionally been transfused to achieve and maintain a haemoglobin concentration of 100 g/L, but in the absence of significant heart disease, the target is 70–90 g/L (p. 184). This determines the stroke volume that the ventricle can generate against a given afterload for a particular preload. The ventricular stroke work is the external work performed by the ventricle with each beat. The relationship between stroke work and filling pressure is shown in Figure 18.22 (p. 547). Myocardial contractility is frequently reduced in critically ill patients due to pre-existing cardiac disease (usually ischaemic), drugs (e.g. β-blockers, verapamil) or to the disease process itself (particularly sepsis, as the associated low diastolic BP may compromise coronary arterial perfusion). It is thus important to maintain satisfactory perfusion and oxygen delivery to all organs at maximum cardiac efficiency, to minimise myocardial ischaemia. The oxyhaemoglobin dissociation curve (Fig. 8.3) describes the relationship between the saturation of haemoglobin (SO2) and the partial pressure (PO2) of oxygen in the blood. A shift in the curve will influence the uptake and release of oxygen by the haemoglobin molecule. If the curve moves to the right, the haemoglobin saturation will be lower for any given oxygen tension: less oxygen will be taken up in the lungs but more will be released to the tissues. As capillary PCO2 rises, the curve moves to the right, increasing the unloading of oxygen in the tissues – a phenomenon known as the Bohr effect. Thus a shift to the right increases capillary PO2 and hence cellular oxygen supply. Due to the shape of the curve, a small drop in arterial PO2 (PaO2) below 8 kPa (60 mmHg) will cause a marked fall in SaO2.. Its position and the effect of various physicochemical factors are defined by the PO2 at which 50% of the haemoglobin is saturated (P50), which is normally 3.5 kPa (26 mmHg). The shape of the curve also means that increases in PaO2 beyond the level that ensures SaO2 is greater than 90% produce relatively small additional increases in CaO2 (Fig. 8.3). Thus, in a patient who is both anaemic (Hb 60 g/L or 6 g/dL) and hypoxaemic (SaO2 75%) when breathing air (fractional inspired oxygen concentration (FiO2) 20%), supplementary oxygen at FiO2 40% will increase SaO2 to 93% and CaO2 by 24%. However, further increases in FiO2, while raising PaO2, cannot produce any further useful increases in SaO2 or CaO2. However, increasing haemoglobin to 90 g/L (9 g/dL) by blood transfusion will result in a further 50% increase in CaO2. The mediators and clinical manifestations of the inflammatory response are described on page 82. In critically ill patients, these have important consequences (Box 8.2). Systemic inflammatory response syndrome (SIRS) • Defined by the presence of two or more of • A wide pulse pressure, e.g. 115/42 mmHg, may be an early pointer to systemic sepsis • Cause may be infection or a non-infective condition, e.g. pancreatitis, trauma, cardiopulmonary bypass, vasculitis etc. • Hypothermia and septic neutropenia indicate more severe infection Normally, a delicate balance is achieved between pro- and anti-inflammatory mediators. However, if the response is excessive, a large array of pro-inflammatory mediators may be released into the circulation (p. 74). The inflammatory and coagulation cascades are intimately linked, as the latter cause not only platelet activation and fibrin deposition, but also activation of leucocytes and endothelial cells. Conversely, leucocyte activation induces tissue factor expression and initiates coagulation pathways. The natural anticoagulants, antithrombin (AT III), activated protein C (APC) and tissue factor pathway inhibitor (TFPI), inhibit pro-inflammatory cytokines. Deficiency of AT III and APC (features of disseminated intravascular coagulation (DIC), p. 1056) facilitates thrombin generation and promotes further endothelial cell dysfunction. The endothelium itself produces mediators that control local blood vessel tone. The profound vasodilatation that characterises septic shock and some other acute systemic inflammatory states, such as pancreatitis, results from excessive production of nitric oxide (NO, p. 82), due to activation of inducible NO synthase enzymes. CVP or right atrial pressure (RAP) is monitored using a catheter inserted via either the internal jugular or the subclavian vein, with the distal end sited in the upper right atrium. The CVP may help in assessing the need for intravascular fluid replacement and the rate at which this should be given (see Box 8.1, p. 182). If the CVP is low in the presence of a low MAP or cardiac output, fluid resuscitation is necessary. However, a raised level does not necessarily mean that the patient is adequately volume-resuscitated. Right heart function, pulmonary artery pressure, intrathoracic pressure and venous ‘tone’ also influence CVP, and may lead to a raised CVP even when the patient is hypovolaemic (Box 8.3). In addition, positive pressure ventilation raises intrathoracic pressure and causes marked swings in atrial pressures and systemic BP in time with respiration. Pressure measurements should be recorded at end-expiration. In severe hypovolaemia, the RAP may be sustained by peripheral venoconstriction, and transfusion may initially produce little or no change in the CVP (see Fig. 8.3, p. 183). The CVP is usually an adequate guide to the filling pressures of both sides of the heart. However, certain conditions, such as pulmonary hypertension or right ventricular dysfunction, may lead to raised CVP levels even in the presence of hypovolaemia. In these circumstances, it may be appropriate to insert a pulmonary artery flotation catheter (Fig. 8.4) so that pulmonary artery pressure and pulmonary artery ‘wedge’ pressure (PAWP), which approximates to left atrial pressure, can be measured. Oesophageal Doppler ultrasonography provides a rapid and useful assessment of volume status and cardiac performance to guide early fluid and vasoactive therapy. A 6 mm probe is inserted into the distal oesophagus, allowing continuous monitoring of the aortic flow signal from the descending aorta (Fig. 8.5). Using the stroke distance (area under the velocity/time waveform) and a correction factor that incorporates the patient’s age, height and weight, an estimate of left ventricular stroke volume and hence cardiac output can be made. Peak velocity is an indicator of left ventricular performance, while flow time is an indicator of left ventricular filling and peripheral resistance. Acid–base balance is discussed on page 443. Base excess or deficit is calculated as the difference between the patient’s bicarbonate and the normal bicarbonate after the PCO2 has been maintained in a blood gas machine at 5.33 kPa (40 mmHg). This is particularly useful, as it describes patients’ underlying metabolic status independently of their current respiratory status. A metabolic acidosis with base deficit of more than 5 mmol/L requires investigation (p. 445). It often indicates increased lactic acid production in poorly perfused, hypoxic tissues, and impaired lactate metabolism and clearance due to poor hepatic perfusion. Serial lactate measurements may therefore be helpful in monitoring tissue perfusion and response to treatment. Other conditions, such as acute renal failure, ketoacidosis and poisoning, may be the cause, and infusions of large volumes of fluids containing sodium chloride may lead to a hyperchloraemic acidosis. Oxygen saturation (SpO2) is measured by a probe attached to a finger or earlobe. Spectrophotometric analysis determines the relative proportions of saturated and desaturated haemoglobin. It is unreliable if peripheral perfusion is poor, in the presence of nail polish, excessive movement or high ambient light. It is not useful in carbon monoxide poisoning, as it does not detect carboxy-haemoglobin. If this is suspected, PO2 must be measured in an arterial blood gas sample. In general, arterial oxygenation is safe if SpO2 is above 90%. Box 8.4 lists the causes of sudden falls in SpO2. The CO2 concentration in inspired gas is zero, but during expiration, after clearing the physiological dead space, it rises progressively to reach a plateau that represents the alveolar or end-tidal CO2 concentration. This cyclical change in CO2 concentration, or capnogram, is measured using an infrared sensor inserted between the ventilator tubing and the endotracheal tube (Fig. 8.6). In normal lungs, the end-tidal CO2 closely mirrors PaCO2, and can be used to assess the adequacy of alveolar ventilation. However, its use is limited as there may be marked discrepancies in the presence of lung disease or impaired pulmonary perfusion (e.g. due to hypovolaemia). In combination with the gas flow and respiratory cycle data from the ventilator, CO2 production and hence metabolic rate may be calculated. In clinical practice, end-tidal CO2 is used to confirm correct placement of an endotracheal tube, in the management of head injury, and during the transport of ventilated patients. Continuous measurement of end-tidal CO2 is important in the minute-to-minute monitoring of any patient ventilated through an endotracheal tube or tracheostomy in the acute setting. • the airway (for patency and noises, e.g. stridor, snoring, gurgling, none) • breathing (rate, symmetry, work of breathing, including accessory muscle use, paradoxical chest/abdominal movement or see-saw pattern) • peripheral circulation (temperature of the extremities) Tachypnoea is often the earliest abnormality to appear and the most sensitive sign of a worsening clinical state, but it is the least well documented. In the UK, the use of early warning scores, such as the Standard Early Warning System chart (SEWS, p. 181), has been adopted to improve the recognition of critical illness. These alert staff to severely ill patients, complement clinical judgement and facilitate the prioritisation of clinical care. A patient with a SEWS score of 4 or more requires urgent review and appropriate interventions. An elevated score correlates with increased mortality. Conscious level should be assessed using the Glasgow Coma Scale (GCS; see Box 26.15, p. 1160). Best eye, verbal and motor responses should be assessed and documented. Appropriate painful stimuli include supra-orbital pressure and trapezius pinch. A score of 8 or less denotes coma with associated airway compromise and loss of airway protection, which necessitates intervention. Focal neurological signs may indicate unilateral cerebral pathology. Abnormal pupil size, symmetry or reaction to light may indicate primary cerebral disease or global cerebral insults induced by drugs (e.g. opioids), hypoxia or hypoglycaemia. During the initial assessment and resuscitation, several decisions must be made (Box 8.5), but particularly whether referral to the critical care service is necessary. This requires local knowledge about the clinical areas providing enhanced care, whether intermediate high-dependency or advanced intensive care, and the mechanism of referral. • How much help is needed and how quickly? • Where would the patient be best managed? • When should the patient be moved? • What is required before transporting the patient? ABCDE resuscitation ± endotracheal intubation and ventilation Monitoring, including invasive arterial ± CVP Volume resuscitation and vasoactive support • Is specialist involvement required? • Intensive care units allow management of the sickest patients who require invasive ventilation, multimodal monitoring and multiple organ system support (Box 8.6). • Patients requiring/likely to require endotracheal intubation and invasive mechanical ventilatory support • Patients requiring support of two or more organ systems (e.g. inotropes and haemofiltration) • Patients with chronic impairment of one or more organ systems (e.g. COPD or severe ischaemic heart disease) who require support for acute reversible failure of another organ • High-dependency care allows a greater degree of monitoring, physiological support and nursing/medical input than the standard ward, for patients following major surgery, or for the septic patient requiring invasive haemodynamic monitoring and circulatory support alone, or for the patient with respiratory failure manageable with non-invasive ventilation (NIV) or continuous positive airway pressure (CPAP).
Critical illness
Clinical examination of the critically ill patient
 Recognition of critical illness
 Clinical features of shock
Physiology of critical illness
Oxygen transport
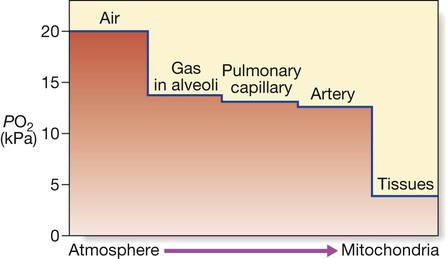
Gas containing oxygen is entrained into the lungs by inspiratory flow. The partial pressure of O2 falls as it moves from lungs to blood and then to the tissues. The partial pressure gradient between capillary blood and the intracellular environment is pivotal to oxygen reaching the mitochondria. (PO2 = oxygen partial pressure (kPa) 1 kPa = 7.5 mmHg).
Cardiovascular component of oxygen delivery: flow
Preload
Myocardial contractility
Oxygenation component of oxygen delivery: content
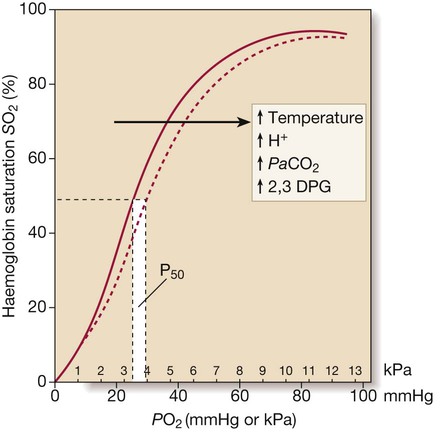
The dotted line illustrates the rightward shift of the curve (i.e. P50 increases) caused by increases in temperature, PaCO2, metabolic acidosis and 2,3 diphosphoglycerate (DPG).
Pathophysiology of the inflammatory response
 8.2 Terminology in the inflammatory state
Local inflammation
Systemic inflammation
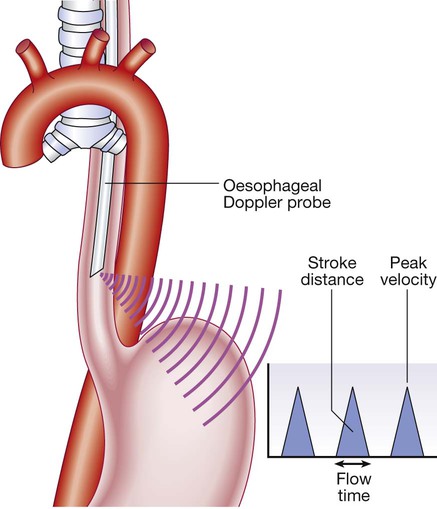
Monitoring
Monitoring the circulation
Central venous pressure
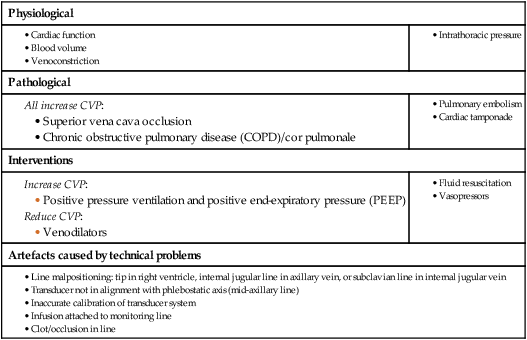
 8.3 Factors affecting central venous pressure
Physiological
Pathological
Interventions
Artefacts caused by technical problems
Pulmonary artery catheterisation and pulmonary artery ‘wedge’ pressure
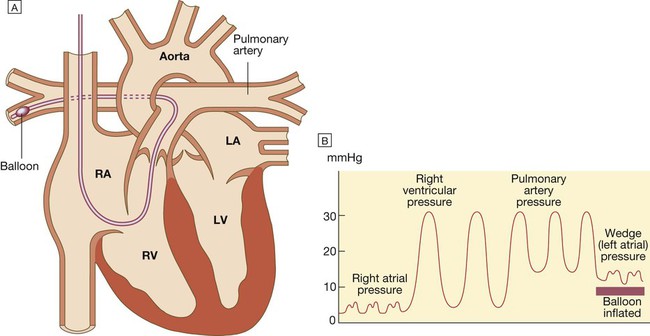
A There is a small balloon at the tip of the catheter and pressure can be measured through the central lumen. The catheter is inserted via an internal jugular, subclavian or femoral vein and advanced through the right heart until the tip lies in the pulmonary artery. When the balloon is deflated, the pulmonary artery pressure can be recorded. B Advancing the catheter with the balloon inflated will ‘wedge’ the catheter in the pulmonary artery. Blood cannot then flow past the balloon, so the tip of the catheter will now record the pressure transmitted from the pulmonary veins and left atrium (known as the pulmonary artery wedge pressure), which provides an indirect measure of the left atrial pressure. (LA = left atrium; LV = left ventricle; RA = right atrium; RV = right ventricle).
Cardiac output
Blood lactate, hydrogen ion and base excess/deficit
Monitoring respiratory function
Oxygen saturation
Capnography
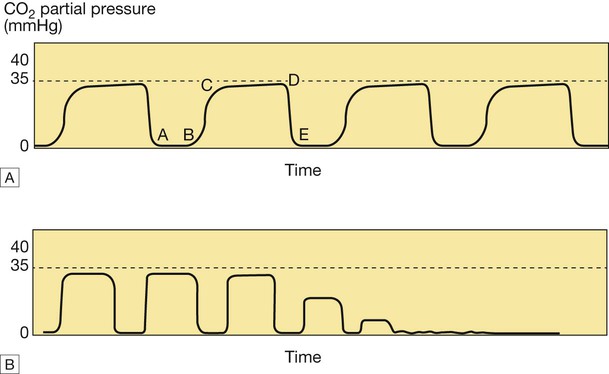
A The normal capnogram represents the varying CO2 level throughout the breath cycle. A–B = baseline, B–C = expiratory upstroke, C–D = expiratory plateau, D = end-tidal concentration, D–E = inspiration. B Loss of the capnograph can occur with loss of cardiac output, as well as airway displacement. (1 kPa = 7.5 mmHg)
Recognition of critical illness
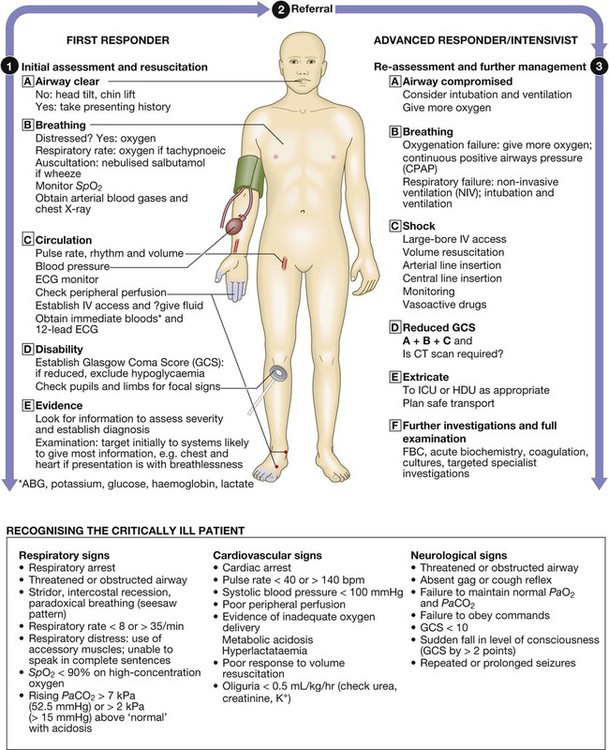
Assessment and initial resuscitation of the critically ill patient
Airway and breathing
Disability
Clinical decision-making and referral to critical care
 8.5 Clinical decisions in the critically ill
 8.6 Admission criteria for intensive care (ICU) and high-dependency units (HDU)
![]()
Stay updated, free articles. Join our Telegram channel

Full access? Get Clinical Tree


Critical illness
 8.1
8.1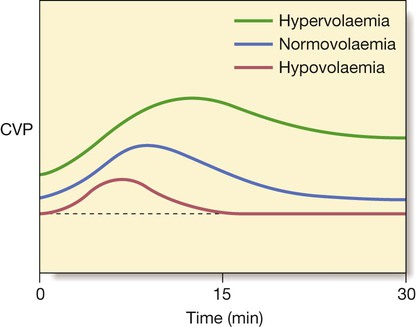
 8.4
8.4