Bundles
The process of bundling evidence-based care practices allows ICUs to keep up with regulatory changes and practice the most up to date critical care practices. Unlike checklists, ICU care bundles are always evidence based. Bundles are comprised of interrelated processes and have a limited number of elements (typically three to seven) whose key processes must be carried out in the same space and time. Bundles exist addressing ventilator-associated pneumonia, central line infection, catheter-associated urinary tract infection and pressure ulcer prevention, diagnosis and treatment of sepsis, and promotion of palliative care. Large collaborative groups in the United States, including the Voluntary Hospital Association, The Institute for Healthcare Improvement and the Michigan Health and Hospital Association-Keystone Project, have shown improved patient outcomes after implementation of various bundles.23 Continuing education is required to maintain appropriate use and compliance with these management bundles. The implementation and use of sepsis resuscitation bundle and management bundle were significantly improved after 2 month nationwide education effort to improve compliance with the care for patients with severe sepsis.24 These evidence-based guidelines and bundles have been shown to improve mortality and decrease morbidity and ICU related complications. Severe sepsis and septic shock bundles are associated with reduced in-hospital mortality (Table 10-2). Mortality rates in these centers using severe sepsis and septic shock bundles decreased by 16.7%.25 It has also been shown that the implementation of central venous catheter care bundles led to decreased central line associated blood stream infections (Table 10-3).26 Awakening, breathing, coordination, delirium, and early mobility (ABCDE) bundles show some improvement in ICU average length of stay and average days on mechanical ventilation.27 Finally, some have “bundled” a variety of these disparate bundles together to drive global evidence-based care. The Surgical Care Improvement Project (SCIP) guidelines are perhaps the most relevant and robust example.
Table 10-1B Extended FAST HUG – as Modified by the Authors from above

Table 10-2 Surviving Sepsis Care Bundle

The application of evidence-based guidelines into clinical practice, even facilitated by use of bundles, is often difficult. Educational and quality improvement programs, described above, can improve the implementation of and compliance with these evidence-based guidelines. Further, it is important to realize that bundles and any evidence-based guidelines must be continuously updated as new information comes to the fore, particularly if the level of evidence or strength of recommendation was weak. Examples in the care of the septic patient will be discussed below. Finally, although use of bundles can promote team-building by providing objective feedback of performance, competent and individualized clinical decision-making should not be sacrificed.
Table 10-3 Central Line Associated Bloodstream Infection (CLABSI) Bundle

Table 10-4 Comparison of ICU Scoring Systems

CRITICAL CARE PROGNOSTICATION AND SCORING
4 ICU scoring systems have been used to provide a framework to describe patients’ severity of illness for the routine evaluation of ICU performance, quality improvement initiatives and to prognosticate outcome.28 The most robust prognostication systems compare observed and risk-adjusted hospital mortality for critically ill patient groups derived from analysis of large data sets. They operate on the premise that early physiologic derangements prior to resuscitation and therapy present early in the ICU admission will influence hospital mortality. Other systems have been developed to quantify organ dysfunction and therapeutic interventions predicted.
The ideal scoring system should be valid, reliable, calibrated, discriminating, and simple. The Glasgow coma scale score is an apt example. However, since ICU patients are heterogeneous, documentation is often incomplete and practices are not standardized, such a system is not available in the ICU. The most frequently used severity of illness scores in an adult ICU used to prognosticate hospital mortality are Acute Physiology and Chronic Health Evaluation (APACHE), the Mortality Probability Model (MPM), and the Simplified Acute Physiology Score (SAPS) with higher scores portending increased hospital mortality. APACHE and MPM were developed using data predominantly from the United States; SAPS was more global (Table 10-4). To stay relevant and useful, these scoring systems require and have undergone regular updates and regional customizations. These scoring systems are currently in their third and fourth generations. It is vital to remember that these scoring systems provide prognostication for the outcome of an ICU population more accurately than for an isolated patient.
APACHE was developed several decades ago by William Knaus and colleagues at George Washington University. The inaugural version ranked 34 acute variables from one to four and weighted chronic health conditions A to D to render a score with higher numbers suggesting more acutely ill patients. Versions two and three decreased the acute variable to 12 and 17, respectively, and created a simpler way to weight the chronic health evaluation. The proprietary (and expensive) version, APACHE III, never had large market penetration and was much more complex than earlier versions. APACHE IV29 which included more variables has many components in the public domain; however, without a regulatory requirement to provide risk-adjusted ICU metrics and the need to employ personnel to verify and interpret data, it is also not widely used. Further, since the data is collected at the time of ICU admission, the possibility of lead-time bias exists. APACHE provides an algorithm for prediction of ICU length of stay. Several studies have indicated that the current version of APACHE, although labor intensive, is more accurate in prognosticating outcome due to better calibration and discrimination with fewer excluded patients. This is particularly true for surgical patients.
SAPS shared many variables and weightings common with APACHE but provided separate prognostication for medical, scheduled and unscheduled surgical patients; cardiac and burn patients are excluded.30 Further, it provides customizable equations to predict outcome according to seven distinct geographic locations.
The MPM uses dichotomous physiologic (not laboratory) variables for the most part (simplifying data collection), collecting data both upon admission and at 24 hours to measure mortality risk at 24 and 48 hours. However, it excludes more patients than does APACHE. MPM-III has been further modified with additional variables and different patient exclusions and is known as the ICU Outcomes Model (ICOM) that has been endorsed by the National Quality Forum of the United States for public reporting of risk-adjusted hospital mortality of ICU patients.31
The future of ICU prognostication may well involve interpretation of “big data” that relies less on traditional data acquisition and storage and more on linear or logistic regression modeling. Much work must be done in this realm before practical applications are available.32
Several organ failure scores exist as well, designed to link homogeneous patients for the purpose of clinical trials and quality assessment. They can be used to provide initial as well as serial assessments. The SOFA and Marshall scores consider variables in six categories (respiratory, cardiovascular, hematologic, central nervous system, renal, and hepatic). The Denver score excludes the hematologic and neurologic components. A Marshall or Denver score greater than or equal to 4 implies multiorgan dysfunction (Table 10-5).33,34
TISS provides a sum of all interventions in physiologic categories to assist with resource utilization.
HEMODYNAMIC MONITORING AND TREATMENT
Oxygen Delivery and Consumption
Oxygen delivery (DO2), the rate at which oxygen is transported to the microcirculation from the lungs, is the product of cardiac output and arterial oxygen content (CaO2) and is normally about 1,000 mL/min. CaO2, in turn, is the product of hemoglobin and oxygen saturation (SaO2) multiplied by 1.34 (g oxygen per 100 mL hemoglobin) added to the partial pressure of oxygen (PaO2) multiplied by 0.003. Thus, delivery falls in instances of cardiac failure, hypovolemia, anemia, or less so due to poor oxygenation. Oxygen consumption (VO2), the rate at which oxygen is removed from the blood by the microcirculation, is the product of cardiac output and the arteriovenous O2 difference (CaO2 − CvO2) and is normally 250 mL/min in an average adult. Thus, oxygen extraction (OE) ratio or the ratio of VO2 to DO2 is normally about 25%. (The myocardium has the body’s highest extraction ratio at approximately 75%.) Consumption remains constant over a wide range of DO2 by changes in OE. For example, in situations of decreased delivery such as hemorrhagic or cardiogenic shock, consumption can be maintained by increasing the extraction ratio. This mechanism may be altered in critically ill patients who show marked increases in consumption under the influence of stress hormones and catecholamines. However, there is little evidence that artificially augmenting DO2 to so-called supranormal levels by means of inotropes or red cell transfusion results in improvement in morbidity or mortality.
Table 10-5 Marshall Multiple Organ Dysfunction Syndrome (MODS) Versus Denver Multiple Organ Failure (MOF) Organ Failure Scores

Mixed venous oxygen saturation (SvO2) is expressed as 1-VO2/DO2, with normal values of 60% to 80% that can be continuously displayed with an oximetric pulmonary artery catheter or measured from the distal port. Reductions in SvO2 reflect a mismatch between DO2 and VO2 (Table 10-6).
Hemodynamic Monitoring
Assessment of volume status and cardiac function of the critically ill patient is evolving. Traditional static measures of volume assessment using central and pulmonary artery catheters (PACs) are being replaced in many settings by dynamic or functional measures afforded by technologies such as pulse waveform analysis and focused cardiac ultrasound (ECHO). Similarly, indirect measurement of cardiac function by PACs is being subsumed by pulse waveform analysis and systolic and diastolic evaluation of left and right global and regional function using ECHO.
Assessment of Fluid Responsiveness
The concept of volume status using static measures has evolved to “volume responsiveness” using dynamic or functional measures to assess whether a fluid bolus will improve the stroke volume (SV) and cardiac performance of a critically ill patient, the principal goal of resuscitation. Static measures such as central venous pressure (CVP) and pulmonary artery occlusion pressure (PAOP) can give inferential data of cardiac filling pressures at a single time-point, which then extrapolates to cardiac preload (end diastolic volume) and volume status of the patient. However, these pressures can be altered depending on cardiopulmonary physiology, do not always correlate with Frank–Starling principles, and give no indication of whether the patient will respond to a bolus of infused fluid, which is ultimately what those tasked with resuscitation want to know.
Static measures of volume status include assay of CVP and PAOP. These measures are made at end expiration when the pleural pressure is closest to atmospheric pressure. Normal venous waveform components include the “a” wave (corresponding to atrial contraction), the “c” wave (tricuspid valve closure and isovolumic right ventricular contraction), and the “v” wave (ventricular ejection driving venous filling of the atrium) (Fig. 10-1). Clinically, the high point of the “a” wave is the atrial pressure at maximum contraction, where atrial pressure is greater than ventricular diastolic pressure. Here, the atrium is contracted and the tricuspid valve is open, which is synonymous with right ventricular end diastolic pressure, making the ventricle, atrium, and vena cava interconnected. Optimally, this is the point at which the CVP is measured. Unfortunately, many intracardiac and extracardiac interactions can alter these pressure relationships in the vena cava and diseased heart, and, thus, affect the CVP waveform. For example, atrial fibrillation fails to produce an “a” wave, and AV-dissociation produces irregular augmented (cannon) “a” waves with absent “c” and “v” waves, making calculation of mean CVP difficult. Tricuspid regurgitation and tamponade may produce augmentation of the v wave and falsely imply adequate or increased intravascular volume in a patient who may be hypovolemic. Thus, the CVP waveform may fail to provide an adequate reflection of volume responsiveness in diseased states.
Table 10-6 Oxygen Delivery and Consumption Equations

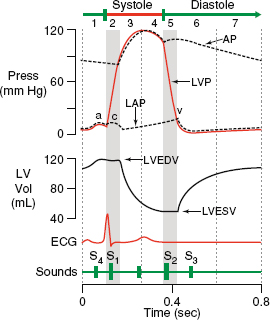
Figure 10-1. Normal venous waveform with ECG.
5 Further, the use of CVP to guide resuscitation has not been demonstrated to be beneficial in many large clinical series. A large meta-analysis revealed a very poor relationship between CVP and blood volume.35 Additionally, several large recent trials of sepsis resuscitation demonstrated that resuscitation targeted to CVP endpoints did not improve outcome.36,37
Pulmonary artery catheter-based volume assessment employs the principle that a single column of fluid forms from the pulmonary artery to the left ventricle during diastole. For a given left ventricular end-diastolic pressure (LVEDP) and compliance, left ventricular end-diastolic volume (LVEDV) can be estimated. Based on the Frank–Starling principle, the force of ventricular contraction is proportional to muscle stretch and LVEDV, thus as PAOP estimates LVEDV for a given cardiac output, preload may be determined. Numerous physiologic changes may alter the relationship between PAOP and LVEDV, including veno-occlusive disease, pulmonary hypertension, ARDS, increased intrathoracic pressure, valvular disease, and altered cardiac compliance. Finally, large clinical trials have failed to demonstrate a benefit to outcome for those resuscitated to a PAOP endpoint.38
Dynamic or functional measures of volume responsiveness include those on both the arterial side and venous side of the heart. Normally, the inspiratory increase in pleural pressure during positive pressure breathing reduces right ventricular preload and stroke volume, manifested on the arterial side within two to three beats in most. Left ventricular stroke volume diminution is maximal during expiration. These normal physiologic changes during the mechanically supported respiratory cycle are augmented with hypovolemia that is volume responsive. Pulse waveform analysis uses analysis of the arterial pressure waveform. The area under the curve corresponding to systole (i.e., before the dicrotic notch) is used to calculate stroke volume (Fig. 10-2). Computer calculation is made of the maximal and minimal amplitude of the curve. In general, a variation in stroke volume (SVV) of greater than 13% to 15% reflects volume responsiveness, whereas values below this threshold imply that the patient is beyond the upper inflection point of the Frank–Starling curve, and will not benefit from further volume loading. There are instances where it is possible to misinterpret these values. For example, high vasopressor burden or lack of arterial compliance (such as in diffuse atherosclerosis) may alter blood flow and arterial wave morphology, respectively. However, clinical applications of SVV as a volume assessment tool have been promising.39
Venous assessment of volume responsiveness is performed by ECHO, which can also perform arterial side estimation. ECHO can provide volume assessment with both static and dynamic values. Further, many static measures can be rendered functional by performing measurements both before and after a passive leg raise, a maneuver that replicates volume loading. Passive leg raising measurements may be the only accurate methodology to approximate fluid responsiveness in spontaneously breathing patients. In these patients, a breath results in an increase in SV and systolic pressure. Static values include measurement of the inferior vena cava (IVC) on the long axis view, or in some series by the superior vena cava (SVC) or internal jugular vein (IJV) on the venous side or calculation of the velocity time integral (VTI) on the arterial side. Collapsibility of the IVC (or SVC/IJV) of at least 15% and as much as 50% during respiration predicts fluid responsiveness.40 Right-sided heart failure may alter the size relationships of the central veins, thus providing an underestimate of fluid responsiveness using venous measurements (lack of respiratory variation due to pressure overload and diminished venous return to the heart). Arterial assessments are typically done of aortic blood velocity approximated from the VTI.
Assessment of Cardiac Function is best understood by recollection of the cardiac pressure–volume curve depicting the cardiac cycle (Fig. 10-3). Starting at the top right at “A,” the aortic valve opens and blood is ejected into the outflow tract. At “B” systole ends as the aortic valve closes. A period of isovolumic relaxation occurs and ventricular pressure falls until the mitral valve opens at “C,” the start of diastole. Diastole ends as the mitral valve closes at “D” and then there is a period of isovolumic contraction with both valves closed until the cycle repeats. Note that the distance across the box represents SV. SV is the amount of blood ejected per beat and is expressed in mL and determined by preload, afterload, and contractility. The product of SV and heart rate is CO. Ejection fraction (EF), a more valid estimate of cardiac function, is the proportion of preload or EDV ejected per beat or SV/EDV.

Figure 10-2. Arterial pressure waveform. Area under systole curve is used to calculate stroke volume. pSBP, peripheral systolic blood pressure; pPP, peripheral pulse pressure; pDBP, peripheral diastolic blood pressure.
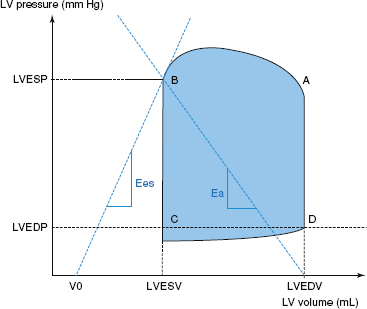
Figure 10-3. Left ventricular pressure–volume curve. Ees, LV elastance; Ea, arterial elastance; ESV, end-systolic volume; EDV, end-diastolic volume; ESP, end-systolic pressure; EDP, end-diastolic pressure; LV, left ventricle. A: aortic valve opens; B: aortic valve closes; C: mitral valve opens; D: mitral valve closes.
PA catheters determine cardiac output by thermodilution. The thermodilution technique measures temperature changes sensed by a balloon at the distal end of the catheter after a cold saline injection is performed through the proximal port. Based on the modified Stewart–Hamilton equation, which constructs a plot of temperature change against time, measurements of cardiac output can be obtained. Thermodilution technique assumes that complete mixing of the blood occurs, that there is constant blood flow in the heart, and that there is no loss in concentration of the indicator between the point of injection and the distal balloon tip. Slow injections, incorrect volumes of injectate, incorrect temperature of injectate, either isolated or in combination with anatomic and physiologic cardiac derangements can alter the accuracy of cardiac output determination.
Pulse contour analysis can also be used to measure stroke volume (and hence cardiac output). Using PAC thermodilution as the gold standard, accuracy is acceptable.
ECHO does not suffer from many of the shortcomings of CVP, PAC, or arterial line assessment with regard to the assessment of cardiac function. ECHO can determine left ventricular function (systolic and diastolic), right ventricular function, and assess wall motion abnormalities, valve defects, pericardial fluid, and provide real-time information on effectiveness of inotropic and vasopressor therapy. ECHO can provide information about heart function in a qualitative or quantitative fashion – it can be used to assess left and right heart morphology, dynamics, and size, and can determine the difference in EF and stroke volume, and perform quantitative estimates of pulmonary artery and right ventricular pressure. ECHO is unique in that it is the only tool available that can provide EF data in addition to SV (CO). Shock states may be due to impaired EF or contractility (requiring inotropy) or due to diminished volume status and stroke volume (requiring fluid), which is not discernable with a PAC. Various ECHO methodologies are available to determine and measure EF, including a purely qualitative one that is reasonably accurate compared to quantitative means.
ECHO can also discern right heart dysfunction, very common in surgical ICU patients by examining size, morphology and function of the right ventricle. Underfilling of the left heart, typically treated by volume loading, requires attention to inotropic support in the case of right heart failure. Finally, unique to ECHO is the ability to assess for diastolic dysfunction as occurs with sepsis, tamponade, and increased pleural pressure (as with pneumothorax, abdominal compartment syndrome, and massive pleural effusions).
TREATMENT OF CARDIAC ARREST AND DYSRHYTHMIAS
Dysrhythmias are extraordinarily common in both cardiac and noncardiac surgical ICU patients. Those most life-threatening can be treated by following current American Heart Association Advanced Cardiac Life Support (ACLS) guidelines.41 For patients who become pulseless in the ICU, rapid restoration of the circulation employing basic life support strategies (BLS) is vital. The most important features of the current BLS guidelines include the recognition that cardiopulmonary resuscitation (CPR), when indicated, be delivered by pushing hard and fast with complete recoil at a rate of at least 100 compressions/min to a depth of 2 in in adults. CPR providers should deliver no more than 2 minutes of therapy each (or five cycles of compressions) until a personnel switch is made. In adults, the ratio of 30 compressions to 2 breaths is maintained until ventilation can be controlled by intubation and controlled ventilation. Cricoid pressure is not recommended in current ACLS guidelines. Further, the rapid use of a defibrillator is key to improving postarrest survival. Of course, in ICU patients, cardiac arrest is often witnessed and the underlying rhythm known and may not respond to defibrillation. Sadly, cardiac arrest from a rhythm other than ventricular fibrillation, such as from bradycardia progressing to asystole or pulseless electrical activity (PEA), portends a poor prognosis, often as the result of acidosis or profound hypoxia incidental to sepsis and multiple organ failure. Another important feature of the current BLS and ACLS guidelines that may impact surgical ICU patients is the recognition of the need for postcardiac arrest care. This certainly includes fluid resuscitation and administration of pressors and inotropes as needed. However, there may also be a need to interrogate via coronary angiography and treat for acute coronary syndrome if anticoagulation can be tolerated and for consideration of postarrest hypothermia to preserve neurologic function. Although hypothermia protocols were established to address out of hospital cardiac arrest with coma, there has been increasing use of the modality for hospitalized patients as well. Current guidelines also address new technology with biphasic electrical sources that deliver shocks for dysrhythmias with a pulse and defibrillation in those with ventricular fibrillation. Another important component of the recommendations is the use of end-tidal CO2 monitoring to ensure adequacy of CPR quality.
Three dysrhythmias produce pulselessness: ventricular fibrillation, asystole, and PEA. Only ventricular fibrillation is responsive to defibrillation which is with 120 to 200 J using a biphasic device as per manufacturer’s recommendations. PEA and asystole are treated by administration of epinephrine (1 mg every 3 to 5 minutes) and/or vasopressin (40 U one-time dose). Pulseless ventricular tachycardia is treated like ventricular fibrillation with additional shocks given after five cycles of CPR (2 minutes). In addition, epinephrine and vasopressin are administered as CPR continues. Continued pulseless ventricular tachycardia and fibrillation can be treated with amiodarone (300 mg with a second dose of 150 mg if refractory) or lidocaine (1.0 to 1.5 mg/kg).
For the remainder of dysrhythmias, several key features should be noted. Is the patient, hemodynamically stable or unstable? Is the EF normal or altered? Is the dysrhythmia acute or long standing? Hemodynamic instability in association with a rhythm disturbance often renders electrical therapy more desirable, if possible. In those with a low EF, antiarrhythmics that are also negative inotropes should be avoided. Finally, even duration of as little as 48 hours can increase the risk of thrombotic complications of some dysrhythmias (e.g., atrial fibrillation) and can alter therapeutic decisions.
PULMONARY GAS EXCHANGE
Consists of the intake of oxygen by pulmonary capillaries from the alveoli and the excretion of carbon dioxide in expired breaths.
Oxygenation
Normal lung function and gas exchange require patent and dry alveoli with a narrow interface with the pulmonary capillaries. Once red blood cells become saturated with oxygen, the rest dissolves into the plasma and the measured partial pressure of oxygen (PO2) is 100 mm Hg with an oxygen saturation (SaO2) of 100%. Since a small portion of blood is diverted away from the pulmonary circulation (via bronchial vessels), a normal PaO2 is 90 mm Hg with 98% saturation. Insufficient blood oxygenation is termed hypoxemia. This is to be differentiated from hypoxia, which is abnormally low oxygen content in a tissue or organ. The alveolar to arterial (A-a) oxygen gradient is a common measure of oxygenation (“A” denotes alveolar and “a” denotes arterial oxygenation). PaO2 is measured by arterial blood gas, while PAO2 is calculated using the alveolar gas equation: PAO2 = (FiO2 × [Patm − PH2O]) − (PaCO2 ÷ R) where FiO2 is the fraction of inspired oxygen (0.21 at room air), Patm is the atmospheric pressure (760 mm Hg at sea level), PH2O is the partial pressure of water (47 mm Hg at 37°C), PaCO2 is the arterial carbon dioxide tension, and R is the respiratory quotient. The normal gradient is about 10 mm Hg. Dividing the PaO2 by the FiO2 estimates the A-a gradient, which normally approximates 500.
Perturbations causing hypoxia and hypoxemia may be the result of hypoventilation relative to perfusion (V/Q mismatch), impaired diffusion, or shunt. Hypoventilation, a result of neuromuscular dysfunction (or more typically iatrogenic due to medications) and impaired diffusion (occurring with pulmonary edema or interstitial lung disease) can be treated effectively by exogenous administration of oxygen. The A-a gradient is normal in hypoxemia due to pure hypoventilation and increased in V/Q mismatch. V/Q mismatch, the cause of most hypoxemia in the ICU, occurs with decreased airflow to the alveoli in relation to the amount of pulmonary capillary blood flow. In the normal lung, there is V/Q mismatch because perfusion and ventilation are heterogeneous. Both ventilation and perfusion are greater in the bases than in the apices. However, the difference between apical and basilar ventilation is less than the difference between apical and basilar perfusion. Therefore, the V/Q ratio is higher in the apices than in the bases. In the diseased lung, V/Q mismatch increases because heterogeneity of both ventilation and perfusion worsen resulting in hypoxemia. Common causes of hypoxemia due to V/Q mismatch include obstructive lung diseases, pulmonary vascular diseases, and interstitial diseases. Shunting occurs when there is adequate ventilation of the alveoli but decreased pulmonary capillary blood flow. Shunting may be anatomic as with intracardiac shunts and hepatopulmonary syndrome or physiologic as when nonventilated alveoli are perfused as with pneumonia. Hypoxia due to shunting with venous admixture as with severely depressed cardiac output or anemia cannot be overcome by administration of oxygen (Fig. 10-4).

Figure 10-4. West lung zones. Zone 1: Not observed in healthy lung. Alveolar pressure exceeds pulmonary blood vessel pressure leading to alveolar dead space. Zone 2: Located approximately 3 cm above heart. Pulmonary vessel pressure exceeds alveolar pressure in a pulsatile fashion and allows pulmonary blood flow and alveolar distention. Zone 3: Majority of healthy lungs with continuous blood flow and oxygenation. PA, Alveolar Pressure; Pa, arterial pressure; PV, venous pressure.
Ventilation and CO2 Removal
Ventilation refers to the exchange of air from the atmosphere to the lungs and alveoli. The rate at which alveolar ventilation occurs determines the amount of carbon dioxide (CO2) excretion, a readily diffusible substance. The amount of CO2 produced and requiring elimination is related to the respiratory quotient (RQ). RQ is the ratio of CO2 produced to O2 consumed and is normally 0.8, depending on the diet. Chemoreceptors in the medulla are responsive to pH changes and when patients become acidotic they hyperventilate to decrease PaCO2 to maintain homeostasis at 40 mm Hg. End tidal CO2 may be lower than PaCO2 if substantial lung is ventilated but not perfused (dead space).
Pulmonary Mechanics
The relationship between ventilatory volumes and pressures is referred to as pulmonary mechanics and depends on compliance. The functional lung in acute lung injury is smaller with heterogeneous disease, necessitating a protective lung strategy of ventilation that will be described below.

Figure 10-5. Flow–time scalar showing autoPEEP.
VENTILATOR MODES AND GRAPHICS
One of the initial steps in evaluating a patient with respiratory failure is to establish a patent and protected airway. The ICU team must determine if the patient has an acute issue causing the respiratory failure that can be treated without mechanical ventilation. Through the use of physical examination, bedside ultrasound and radiography, the ICU team may diagnose a pneumothorax or acute pulmonary edema that can be treated without intubation. If the patient has acute respiratory failure without an easily treatable process, intubation and mechanical ventilation may be safest. When setting up the mechanical ventilator there are several options and modalities from which to select.
Mechanical ventilation improves oxygenation and ventilation by attempting to improve V/Q mismatch by decreasing the amount of shunt. Current recommendations are for low tidal volume (Vt) settings of 6 to 8 mL/kg for the prevention of barotrauma in surgical ICU patients.42 Respiratory Rate (RR) is typically set at 12 to 16 breaths/min. RR is altered to achieve an optimal PaCO2. Positive end expiratory pressure (PEEP) is applied to prevent significant alveolar collapse during expiration and is particularly important in low lung volume ventilation strategies. PEEP is typically started at 5 cm H2O but can be titrated up to improve oxygenation. The initial setting for patients with respiratory failure is an FiO2 of 1.0. After initial check of ABG the FiO2 is weaned down to maintain a minimal PaO2 of 60 mm Hg and O2 saturation of >90% with goals of FiO2 <0.4 to prevent O2 toxicity.
Ventilatory mechanics can be displayed graphically and include scalars and loops. Scalars are plots against time – either flow, pressure, or volume. Several loops are helpful clinically and include the pressure–volume and flow–volume loops. Each graphic can be important in demonstrating a physiologic anomaly and displays a certain pattern depending on the ventilator mode. The flow versus time scalar is helpful for identifying air trapping or auto-PEEP that can accompany certain ventilator modes (Fig. 10-5). This can result in barotrauma or hemodynamic instability. Measures to decrease auto-PEEP include decreasing tidal volume, respiratory rate, or inspiratory time (depending on ventilator mode) or increasing flow rate. The pressure time scalar allows the practitioner to view and calculate compliance (Fig. 10-6). Further, one can observe elevations in peak airway pressure that may occur as a result of a large pneumothorax or kinked endotracheal tube or a sharp decrease that may represent an airway leak or disconnection. The volume versus time scalar allows one to identify an airway leak as well (Fig. 10-7). Ventilators often display all three scalars simultaneously. A spontaneously breathing patient is identified by the negative deflection in the pressure–time scalar at breath initiation (Fig. 10-8). Distinct ventilator modes have unique methods of cycling, triggering, and limitations of breaths. In controlled mandatory ventilation, breaths are volume-cycled, time-triggered, and flow-limited (Fig. 10-9). In pressure-controlled ventilation, breaths are time-cycled, time–triggered, and pressure-limited. Note the distinct difference in the flow and pressure versus time scalars compared to CMV (Fig. 10-10). Pressure supported breaths are flow-cycled, patient-triggered, and pressure-limited (Fig. 10-11). Pressure and volume controlled ventilation can be set in an assist control (AC) mode or intermittent mandatory ventilation (IMV) mode. With the AC mode the patient receives a set number of breaths delivered per minute whether with pressure or volume. Patients who initiate breaths on IMV will have tidal volumes determined by their own respiratory effort and not the ventilator. Patients who are critically ill may require AC for full support but these patients should be weaned to an IMV or PSV mode quickly to prevent respiratory muscle atrophy.43

Figure 10-6. Pressure–time scalar.
ACUTE RESPIRATORY FAILURE
Diagnosis
6 Past consensus definitions of adult respiratory distress syndrome (ARDS) and acute lung injury (ALI) categorized them by acute onset hypoxemia, bilateral infiltrates on chest radiography, and absence of left atrial hypertension (i.e., noncardiac in etiology).44 ALI and ARDS were differentiated by the degree of hypoxia, with ALI typified by a ratio of PaO2/FiO2 of less than 300 and ARDS 200. Newer definitions make an attempt at describing timing relative to a known insult and acknowledge that cardiac failure is now often diagnosed without the aid of a pulmonary artery catheter. Most importantly, ALI is now part of ARDS spectrum that is classified as mild, moderate, or severe if the PaO2/FiO2 ratio is between 200 and 300, between 100 and 200, and less than 100, respectively.45 Further, this gradation of disease is consistent with therapy, wherein less acute patients might be successfully treated with noninvasive ventilation, moderately ill patients with higher PEEP and possibly neuromuscular blockade, and severely ill patients possibly requiring prone positioning therapy and extracorporeal support.

Figure 10-7. Volume–time scalar.
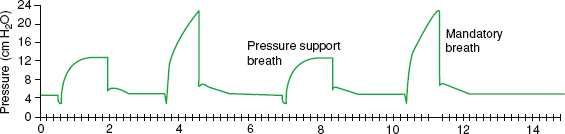
Figure 10-8. Pressure–time scalar with alternating ventilator-assisted breaths and spontaneous breaths.
Ventilator Management
Conventional Modes
The ventilatory standard of care was set forth as a result of an early study from the NIH ARDS Network. By all metrics, the patients ventilated at 6 mL/kg had better outcome than those who received 12 mL/kg. Thus, as a result, the standard of care for ventilating ARDS patients became the use of low tidal volumes, or low stretch therapy to diminish the incidence of ventilator-associated barotrauma.46
Rescue Therapies
Involving different ventilator modes share the fact that they achieve their end by raising mean airway pressure while preventing elevation of peak airway pressure. How the disparate modes of ventilation achieve this varies.
High PEEP. Ideally, to prevent atelectasis and avoid overdistension, PEEP is titrated to the safe window between the lower and upper inflection points of the respiratory pressure–volume curve (Fig. 10-12). The precise PEEP level to optimize outcome from ARDS, particularly in the face of low stretch ventilation, has been the subject of several trials. The Assessment of Low Tidal Volume and Elevated End-Expiratory Pressure to Obviate Lung Injury (ALVEOLI) trial did not demonstrate a benefit to adding high PEEP to those ventilated with lower tidal volumes.47 Two other trials (LOVS and EXPRESS) reached similar conclusions.48,49 A systematic review and meta-analysis showed no statistically significant difference in hospital mortality overall but worse in those with severe established ARDS treated with high PEEP.50

Figure 10-9. Controlled mandatory ventilation. Breaths are volume-cycled, time-triggered, and flow-limited.
Perhaps the more valuable variable to consider preventing barotrauma and atelectasis is not the PEEP level, but rather the transpulmonary pressure. Transpulmonary pressure is the difference between airway pressure and pleural pressure. As airway pressure is normally slightly positive and pleural pressure slightly negative, transpulmonary pressure is typically zero. If transpulmonary pressure were negative, it would favor atelectasis, whereas a positive value would promote barotrauma and hemodynamic compromise. In ICU patients, there are many forces extrinsic to the lung that can raise pleural pressure and promote atelectasis. These include obesity, intra-abdominal hypertension, and anasarca. Thus, in these circumstances, it might be beneficial to utilize higher PEEP levels. Although it is not possible to measure pleural pressure directly, esophageal pressure is a reasonable surrogate. Although titrating PEEP to esophageal pressure has not yet been proven clinically efficacious, it may in the future.

Figure 10-10. Pressure controlled ventilation: Breaths are time-cycled, time–triggered, and pressure-limited.

Figure 10-11. Pressure support (PS). Breaths are flow-cycled, patient–triggered, and pressure-limited. Pressure support breaths are second and fourth breaths.
High-Frequency. Modes include high-frequency jet and oscillatory ventilation. Both utilize ultrafast subtidal ventilation and can be employed for rescue or treatment of bronchopleural fistulae. In general, heavy sedation and/or paralysis are required. The ventilator decouples oxygenation ventilation such that unique settings are used to manipulate either one. The ventilatory circuit is heavy and cumbersome in this mode and secretion clearance is problematic. Importantly, two large trials failed to show improvement in ARDS patients, with one demonstrating an increased mortality in the high-frequency group.51,52
Airway Pressure Release Ventilation (APRV). takes advan-tage of spontaneous breathing (and hence the ability to keep patients more awake) with CPAP and a brief pressure release, generating a very high inspiratory to expiratory (I:E ratio). The extremely short phase time of pressure release builds up intrinsic PEEP to prevent atelectasis. There are increasing studies in the literature that demonstrate that APRV is at least equivalent to low stretch ventilation in terms of safety and outcome.53,54 As APRV may be better tolerated than low tidal volume ventilation, some would say this provides an advantage. There is also some suggestion that routine use of APRV may decrease the incidence of and mortality from ARDS.55

Figure 10-12. Pressure–volume curve with added PEEP. V, volume; P, pressure; LIP, lower inflection point; UIP, upper inflection point. Ideal PEEP is set between LIP and UIP.
Volumetric Diffusive Respiration (VDR). Is a hybrid mode that combines convective gas delivery similar to CPAP, diffusive gas delivery similar to oscillatory modes and a unique percussive mode to promote secretion removal. As such, it has been used extensively in the burn patient population. However, the technology is not widely available and large trials of use in rescue therapy of ARDS patients have not been completed.
Extracorporeal Support. via extracorporeal membrane oxygenation (ECMO) was thought to provide a beneficial effect to those patients in the European Conventional Ventilation or ECMO for Severe Adult Respiratory Failure (CESAR) trial.56 However, it was apparent on further analysis that patients with severe ARDS benefit most from transfer to a center that had ECMO capabilities, whether or not the therapy was actually used. Data from recent viral pneumonia epidemics are similarly confusing. Regardless of the effect on mortality, it is apparent that ECMO may be thought of as a last ditch effort to improve oxygenation, but should not be employed after lung fibrosis and irreversible organ failure have transpired. For sure, current technology involving smaller access catheters, more portable oxygenators and venovenous deployment has made ECMO far less morbid than initial experience with it decades ago with prior mortality rates in excess of 50%. The definitive trial without crossover treatment to validate the use of ECMO for severe ARDS has not been performed.
Ventilator Associated Events
Ventilator-associated pneumonia (VAP) is the most common life-threatening healthcare associated infection, although there is some evidence that it is less morbid in surgical than in medical patients.57 VAP is associated with increased ICU and hospital length of stay and costs, and may often be preventable. Nonetheless, it can be extraordinarily difficult to define, particularly in injured patients who may be febrile and have pulmonary infiltrates for reasons other than pneumonia. Further, if attempts are made to diagnose the entity predominantly by microbiologic criteria (using bronchoalveolar lavage to culture >105 organisms), then the incidence of VAP may be overstated. Thus, the CDC has worked with various critical care societies to define the surveillance definition of ventilator-associated events (VAE) which are publically reportable and include probable and possible VAP, which are not reportable. Briefly, VAE require patients to have a baseline period of more than 2 calendar days on the ventilator followed by a sustained decrement in oxygenation. Note there are no longer radiographic criteria for VAE or VAP. An infection-related VAE requires a change in temperature or white blood cell count and the initiation of a new antibiotic that is continued for 4 days. The differentiation between possible and probable VAP involves positive cultures as previously prescribed.58
Liberation from Ventilation
Automated, computerized liberation protocols significantly shorten time on ventilator and success rate compared to those directed by physicians. As opposed to the concept of “weaning” patients from support, it is now apparent that the need for ventilation can be approached in a more binomial, on–off approach. Thus, current practice is to complete daily spontaneous breathing trials (SBTs) of no longer than 30 minutes to assess patients’ readiness for liberation from ventilation. Of course, these trials should not be conducted in patients with hypoxia, hemodynamic instability or neurologic disease. SBTs may be accomplished using a T-piece trial or CPAP with or without low PSV (<10 mm Hg), the latter to enable ventilatory monitoring of work of breathing and respiratory effort. If patients develop tachypnea, tachycardia, hypoxia, hypercapnia, and/or use accessory muscles during the SBT they are not ready to be extubated. Typically, the parameter that predicts extubation success most accurately is the rapid shallow breathing index or the tidal volume divided by the respiratory rate with a level of less than 105 most predictive of success.59 Further, the requirement for airway support, as might be expected in those with burns, head injury, or anasarca must be considered separately from the requirement for ventilatory support. Checking for a cuff leak, although conceptually of benefit in identifying patients with airway edema, may not be an accurate metric of those with a stable airway. Trials in the medical literature suggest that a short course of steroids may benefit some to diminish airway edema; these have not been replicated in surgical patients.60 Finally, some patients, such as those with COPD, may benefit from extubation to noninvasive modes of ventilation such as bilevel positive airway pressure (BiPaP) or CPAP. Additionally, the use of high-flow nasal cannula oxygen, typically delivered at 40 L/min or greater may prevent reintubation.
Adjunctive Therapies
Inhaled Nitric Oxide and Prostaglandins. Inhaled Nitric Oxide (iNO) affords selective vasodilation of the pulmonary vasculature without systemic effect. It improves oxygenation and lowers pulmonary artery pressures. If used, methemoglobinemia can result, thus, monitoring should be conducted. Five early meta-analyses showed improved oxygenation without a mortality benefit, with three demonstrating increased renal failure.61 A more recent meta-analysis failed to show a mortality advantage for iNO use for mild, moderate, or severe ARDS.62 Inhaled and/or intravenous prostacyclins such as epoprostenol can also lower pulmonary artery pressures and improve oxygenation. A 2010 Cochrane review demonstrated no safety or outcome differences between iNO and epoprostenol; however, at present, the latter is substantially cheaper. Although neither agent improves mortality, it seems reasonable to employ prostaglandins in ARDS patients with concomitant pulmonary hypertension.63
Positional Therapy. Prone positioning therapy can be done in conjunction with many other therapies previously described. It can be accomplished on a conventional ICU bed or one specially equipped to provide this therapy. Either way, extreme caution must be taken to avoid tube and line dislodgement and development of pressure-related skin complications. The ideal amount of time to keep a patient in the prone position is of debate. Often, a patient is turned every shift or if a procedure is required. A recent large study in French ICU patients demonstrated a significant improvement in mortality in ARDS patients treating with prone positioning therapy.64 Similarly, a systematic review and meta-analysis reinforced the mortality benefit of nearly 25% by prone positioning therapy for ARDS.65
Fluid Management. Another large trial conducted by the ARDSnet group Fluid and Catheter Treatment Trial (FACTT) demonstrated that ARDS patients have better outcome if managed with conservative fluid strategy that need not be guided by a PAC.38 Of course, these findings must be reconciled with extensive data supporting improved outcome in septic patients who received more robust fluid resuscitation.66,67
Steroids. Trials regarding the use of steroids in ARDS are old and heterogeneous. At present, the use of steroids cannot be recommended, but future trials controlling for other factors may indicate otherwise.
Sedation and Paralysis. Recently released pain, agitation, and delirium guidelines underscore several features regarding the sedation of ICU patients. First, most ventilated ICU patients benefit from light sedation and continued emphasis on mobility (even if ventilated) and screening for delirium. If sedative agents are required, a strategy that employs narcotic analgesics first is preferred. If additional agents are necessary, there is substantial evidence that a strategy that relies heavily on use of benzodiazepines will result in a higher incidence of delirium, time on ventilator, and greater costs.68 Ideal sedatives should be easy to titrate, short acting with rapid onset, and without accumulation with prolonged use. These sedatives should also have minimal adverse effects, minimal metabolism, and no active metabolites. Traditionally used sedatives and analgesics morphine, propofol, and benzodiazepines have well-known adverse effects, active metabolites and tend to accumulate with prolonged use. Fentanyl is widely used in ventilated surgical ICU patients due to its excellent pain control, rapid onset, short duration of action, and lack of active metabolites. Dexmedetomidine is a sedative with alpha 2-adrenoreceptor agonist properties that is used as an alternative for analgesia and sedation in the surgical ICU. Dexmedetomidine has been shown to decrease the incidence of delirium and decreased duration of mechanical ventilation versus benzodiazepines while not being inferior to benzodiazepines and propofol in maintaining comfort and sedation.69 Using sedation scales in the ICU such as the Richmond Agitation-Sedation Scale (RASS) provide a universal numerical scale to communicate between ICU team members the target and actual sedation. Although we should not use long-term neuromuscular blockade (NMB) in those with mild ARDS, a recent French study demonstrated a significant benefit to short-term use in terms of mortality.70 A much larger propensity-matched retrospective study documented a 4.3% absolute reduction in mortality with short-term use of NMB in severe ARDS.71
VENOUS THROMBOEMBOLISM PROPHYLAXIS IN THE ICU
Much attention has been focused on the prevention of venous thromboembolism (VTE) in hospitalized patients, particularly in the United States, Canada, and the United Kingdom where national initiatives are present. VTE prophylaxis is a quality metric promoted by such endeavors as the SCIP discussed elsewhere in this text. The surgical ICU patient is a particular target for VTE and has unique features rendering prophylaxis more challenging than it may be in a ward patient. VTE is a common cause of preventable morbidity and mortality in critical care patients. A large amount of VTE complications occur following surgery and injury.12,72 Further, the risk of bleeding in the multitraumatized, immobile, and/or freshly postoperative patient may be heightened in the ICU patient. Finally, safe administration of a chemoprophylactic agent as described below must take into account drug metabolism that may be altered with renal or hepatic failure seen in ICU patients and desire to rapidly reverse the medication if frequent procedures are needed.
Table 10-7A Caprini Risk Assessment for Venous Thromboembolism (VTE) in Surgical Patients

Stay updated, free articles. Join our Telegram channel

Full access? Get Clinical Tree


