5 Common Research Designs and Issues in Epidemiology

I Functions of Research Design
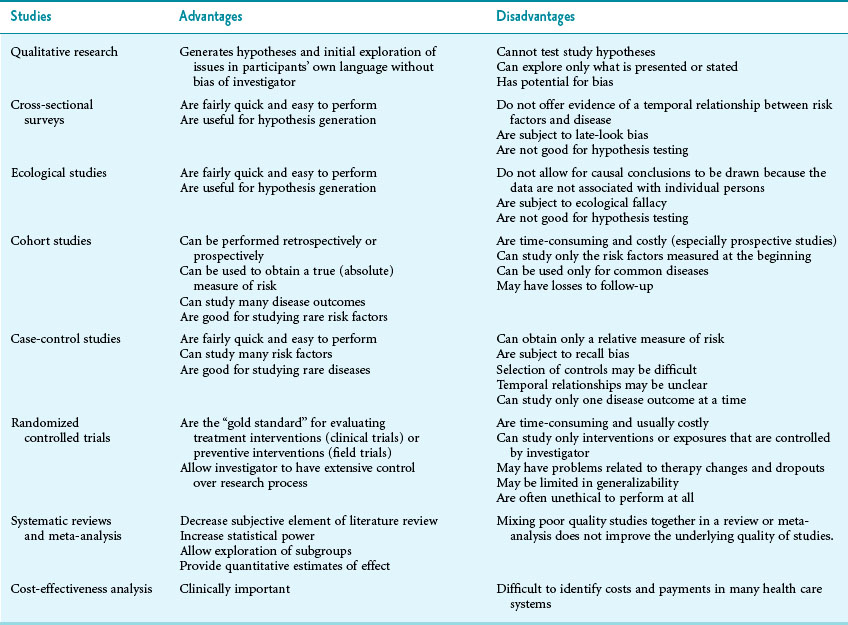
Another research question may be, “What caused this disease?” Hypothesis generation is the process of developing a list of possible candidates for the causes of the disease and obtaining initial evidence that supports one or more of these candidates. When one or more hypotheses are generated, the hypothesis must be tested (hypothesis testing) by making predictions from the hypotheses and examining new data to determine if the predictions are correct (see Chapters 6 and 10). If a hypothesis is not supported, it should be discarded or modified and tested again. Some research designs are appropriate for hypothesis generation, and some are appropriate for hypothesis testing. Some designs can be used for either, depending on the circumstances. No research design is perfect, however, because each has its advantages and disadvantages.
 Enable a comparison of a variable (e.g., disease frequency) between two or more groups at one point in time or, in some cases, within one group before and after receiving an intervention or being exposed to a risk factor.
 Allow the comparison to be quantified in absolute terms (as with a risk difference or rate difference) or in relative terms (as with a relative risk or odds ratio; see Chapter 6).

 Minimize biases, confounding, and other problems that would complicate interpretation of the data.
II Types of Research Design
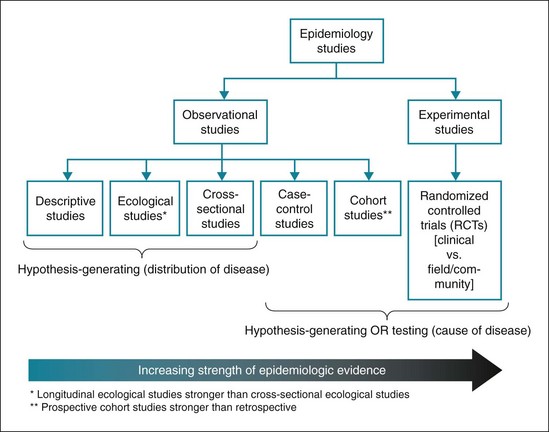
In an experimental study design the investigator has more control over the assignment of participants, often placing them in treatment and control groups (e.g., by using a randomization method before the start of any treatment). Each type of research design has advantages and disadvantages, as discussed subsequently and summarized in Table 5-1 and Figure 5-1.
A Observational Designs for Generating Hypotheses
2 Cross-Sectional Surveys
Cross-sectional surveys have the advantage of being fairly quick and easy to perform. They are useful for determining the prevalence of risk factors and the frequency of prevalent cases of certain diseases for a defined population. They also are useful for measuring current health status and planning for some health services, including setting priorities for disease control. Many surveys have been undertaken to determine the knowledge, attitudes, and health practices of various populations, with the resulting data increasingly being made available to the general public (e.g., healthyamericans.org). A major disadvantage of using cross-sectional surveys is that data on the exposure to risk factors and the presence or absence of disease are collected simultaneously, creating difficulties in determining the temporal relationship of a presumed cause and effect. Another disadvantage is that cross-sectional surveys are biased in favor of longer-lasting and more indolent (mild) cases of diseases. Such cases are more likely to be found by a survey because people live longer with mild cases, enabling larger numbers of affected people to survive and to be interviewed. Severe diseases that tend to be rapidly fatal are less likely to be found by a survey. This phenomenon is often called Neyman bias or late-look bias. It is known as length bias in screening programs, which tend to find (and select for) less aggressive illnesses because patients are more likely to be found by screening (see Chapter 16).
3 Cross-Sectional Ecological Studies
In many cases, nevertheless, important hypotheses initially suggested by cross-sectional ecological studies were later supported by other types of studies. The rate of dental caries in children was found to be much higher in areas with low levels of natural fluoridation in the water than in areas with high levels of natural fluoridation.1 Subsequent research established that this association was causal, and the introduction of water fluoridation and fluoride treatment of teeth has been followed by striking reductions in the rate of dental caries.2
4 Longitudinal Ecological Studies
For example, the introduction of the polio vaccine resulted in a precipitous decrease in the rate of paralytic poliomyelitis in the U.S. population (see Chapter 3 and Fig. 3-9). In this case, because of the large number of people involved in the immunization program and the relatively slow rate of change for other factors in the population, longitudinal ecological studies were useful for determining the impact of this public health intervention. Nevertheless, confounding with other factors can distort the conclusions drawn from ecological studies, so if time is available (i.e., it is not an epidemic situation), investigators should perform field studies, such as randomized controlled field trials (see section II.C.2), before pursuing a new, large-scale public health intervention.
Another example of longitudinal ecological research is the study of rates of malaria in the U.S. population since 1930. As shown in Figure 5-2, the peaks in malaria rates can be readily related to social events, such as wars and immigration. The use of a logarithmic scale in the figure visually minimizes the relative decrease in disease frequency, making it less impressive to the eye, but this scale enables readers to see in detail the changes occurring when rates are low.
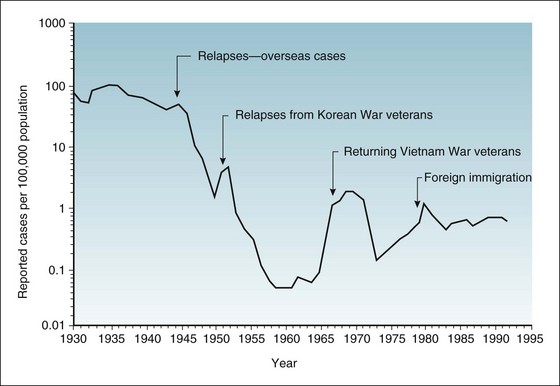
Figure 5-2 Incidence rates of malaria in the United States, by year of report, 1930-1992.
(From Centers for Disease Control and Prevention: Summary of notifiable diseases, United States, 1992. MMWR 41:38, 1992.)
B Observational Designs for Generating or Testing Hypotheses
1 Cohort Studies
A cohort is a clearly identified group of people to be studied. In cohort studies, investigators begin by assembling one or more cohorts, either by choosing persons specifically because they were or were not exposed to one or more risk factors of interest, or by taking a random sample of a given population. Participants are assessed to determine whether or not they develop the diseases of interest, and whether the risk factors predict the diseases that occur. The defining characteristic of cohort studies is that groups are typically defined on the basis of exposure and are followed for outcomes. This is in contrast to case-control studies (see section II.B.2), in which groups are assembled on the basis of outcome status and are queried for exposure status. There are two general types of cohort study, prospective and retrospective; Figure 5-3 shows the time relationships of these two types.
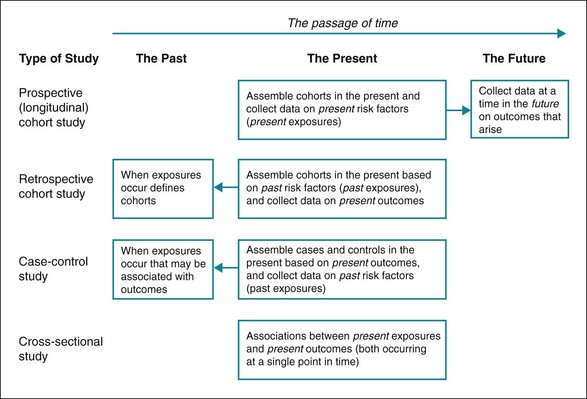
Figure 5-3 Relationship between time of assembling study participants and time of data collection.
Illustration shows prospective cohort study, retrospective cohort study, case-control study, and cross-sectional study.
Prospective Cohort Studies
1. The investigator can control and standardize data collection as the study progresses and can check the outcome events (e.g., diseases and death) carefully when these occur, ensuring the outcomes are correctly classified.
2. The estimates of risk obtained from prospective cohort studies represent true (absolute) risks for the groups studied.
3. Many different disease outcomes can be studied, including some that were not anticipated at the beginning of the study.
Stay updated, free articles. Join our Telegram channel

Full access? Get Clinical Tree


