Cardiovascular Testing
KEY CONCEPTS
![]() A careful history and physical examination are extremely important in diagnosing cardiovascular disease; they should be performed before any testing.
A careful history and physical examination are extremely important in diagnosing cardiovascular disease; they should be performed before any testing.
![]() Elevated jugular venous pressure is an important sign of heart failure and may be used to assess its severity and the response to therapy.
Elevated jugular venous pressure is an important sign of heart failure and may be used to assess its severity and the response to therapy.
![]() Heart sounds and heart murmurs are important in identifying heart valve abnormalities and other structural cardiac defects.
Heart sounds and heart murmurs are important in identifying heart valve abnormalities and other structural cardiac defects.
![]() Electrocardiography is useful for determining rhythm disturbances (tachyarrhythmias or bradyarrhythmias).
Electrocardiography is useful for determining rhythm disturbances (tachyarrhythmias or bradyarrhythmias).
![]() Exercise stress testing provides important information concerning the presence and severity of coronary artery disease; changes in heart rate, blood pressure, and the electrocardiogram are used to assess the response to exercise.
Exercise stress testing provides important information concerning the presence and severity of coronary artery disease; changes in heart rate, blood pressure, and the electrocardiogram are used to assess the response to exercise.
![]() Echocardiography is used to assess valve structure and function as well as ventricular wall motion; transesophageal echocardiography is more sensitive than transthoracic echocardiography for detecting thrombus and vegetations.
Echocardiography is used to assess valve structure and function as well as ventricular wall motion; transesophageal echocardiography is more sensitive than transthoracic echocardiography for detecting thrombus and vegetations.
![]() Radionuclides, such as technetium-99m and thallium-201, are used to assess wall motion and myocardial viability in patients with coronary artery disease and heart failure.
Radionuclides, such as technetium-99m and thallium-201, are used to assess wall motion and myocardial viability in patients with coronary artery disease and heart failure.
![]() When patients cannot exercise, pharmacologic stress testing is used to assess the likelihood of coronary artery disease.
When patients cannot exercise, pharmacologic stress testing is used to assess the likelihood of coronary artery disease.
![]() Cardiac catheterization and angiography are used to assess coronary anatomy and ventricular performance.
Cardiac catheterization and angiography are used to assess coronary anatomy and ventricular performance.
INTRODUCTION
In the United States, cardiovascular disease (CVD) afflicts an estimated 83 million people (i.e., approximately one in three adults) and accounts for 33% of all deaths. One of every six hospital stays results from CVD. In 2008, the estimated direct and indirect cost of CVD—which includes hypertension, coronary heart disease, heart failure, and stroke—was $297.7 billion.1
Atherosclerosis, the cause of most CVD events, is typically present for decades before symptoms appear. With a thorough history, comprehensive physical examination, and appropriate testing, the individual with subclinical CVD usually can be identified, and the subject with symptomatic CVD can be assessed for the risk of an adverse event and can be managed appropriately.
THE HISTORY
The elements of a comprehensive history include the chief complaint, current symptoms, past medical history, family history, social history, and review of systems.
The chief complaint is a brief statement describing the reason the patient is seeking medical attention. The patient is asked to describe his or her current symptoms, including their duration, quality, frequency, severity, progression, precipitating and relieving factors, associated symptoms, and impact on daily activities.
The past medical history may reveal previous cardiovascular problems, conditions that predispose the patient to develop CVD (i.e., hypertension, hyperlipidemia, or diabetes mellitus) (Table 1-1), or comorbid conditions that influence the identification or management of CVD. The patient should be asked about social habits that affect the cardiovascular system, including diet, amount of regular physical activity, tobacco use, alcohol intake, and illicit drug use. At present, family history of early onset CVD is the best available screening tool to identify patients with a genetic predisposition for CVD.
TABLE 1-1 Risk Factors for Cardiovascular Disease
Cardiovascular History
![]() Chest pain is a frequent symptom and may occur as a result of myocardial ischemia (angina pectoris) or infarction or a variety of noncardiac conditions, such as esophageal, pulmonary, or musculoskeletal disorders. The quality of chest pain, its location and duration, and the factors that provoke or relieve it are important in ascertaining its etiology.
Chest pain is a frequent symptom and may occur as a result of myocardial ischemia (angina pectoris) or infarction or a variety of noncardiac conditions, such as esophageal, pulmonary, or musculoskeletal disorders. The quality of chest pain, its location and duration, and the factors that provoke or relieve it are important in ascertaining its etiology.
Typically, patients with angina describe a sensation of heaviness or pressure in the retrosternal area that may radiate to the jaw, left shoulder, back, or left arm. It is precipitated by exertion, emotional stress, eating, smoking a cigarette, or exposure to cold, and it is usually relieved within minutes with rest or a sublingual nitroglycerin, although the latter also is effective in relieving chest pain due to esophageal spasm. Angina that is increasing in severity, longer in duration, or occurring at rest is called unstable angina; it should prompt the patient to seek medical attention expeditiously.
The patient with congestive heart failure and pulmonary vascular congestion may complain of shortness of breath (dyspnea) with exertion or even at rest, orthopnea, paroxysmal nocturnal dyspnea, and nocturia. The patient with congestive heart failure and peripheral venous congestion may report abdominal swelling (from hepatic congestion or ascites), nausea, vomiting, lower extremity edema, fatigue, and dyspnea.
The New York Heart Association (NYHA) grading system is used to indicate whether a patient has angina or symptoms of congestive heart failure with vigorous (class I), moderate (class II), mild (class III), or minimal/no (class IV) exertion.
PHYSICAL EXAMINATION
The patient with suspected heart disease should undergo a comprehensive physical examination, with particular attention to the cardiovascular system. This should include an assessment of the jugular venous pulse (JVP), carotid and peripheral arterial pulses, examination of the heart and lungs (i.e., palpation, percussion, and auscultation), and inspection of the abdomen and extremities.
Jugular Venous Pressure
![]() The JVP is an indirect assessment of right atrial pressure. With the patient lying supine at 30° and his/her head rotated slightly to the left, the height of the fluid wave in the right internal jugular vein is determined relative to the sternal angle. The normal JVP is 1 to 2 cm above the sternal angle. The JVP typically is elevated in the patient with heart failure. The extent of elevation can be used to assess the severity of peripheral venous congestion, and its diminution can be used to assess the response to therapy.
The JVP is an indirect assessment of right atrial pressure. With the patient lying supine at 30° and his/her head rotated slightly to the left, the height of the fluid wave in the right internal jugular vein is determined relative to the sternal angle. The normal JVP is 1 to 2 cm above the sternal angle. The JVP typically is elevated in the patient with heart failure. The extent of elevation can be used to assess the severity of peripheral venous congestion, and its diminution can be used to assess the response to therapy.
Arterial Pulses
The carotid arterial pulse is examined for its intensity and, concurrently with the apical impulse, for concordance within the cardiac cycle. Diminished carotid arterial pulsations may be the result of a reduced stroke volume, atherosclerotic narrowing of the carotidartery, or obstruction to left ventricular outflow due to aortic valve stenosis or hypertrophic obstructive cardiomyopathy. Conversely, very forceful, hyperdynamic “bounding” carotid arterial pulsations may be palpated in the patient with an increased stroke volume and suggest the presence of chronic aortic valve regurgitation or a high cardiac output due, for example, to hyperthyroidism, an arteriovenous shunt, or marked anemia.
The pulses in the arms and legs also are examined. Diminished peripheral pulses suggest the presence of a reduced stroke volume or atherosclerotic peripheral arterial disease (PAD). Concomitant pallor, skin atrophy, hair loss, or ulcerations are consistent with PAD, which often coexists with coronary artery disease (CAD). To quantify the severity of PAD, systolic arterial pressure is measured in all four extremities. Normally, the systolic arterial pressure in the feet should be similar or even slightly higher than the pressure in the arms. Thus, the ratio of the systolic arterial pressures in the foot and arm (the so-called ankle-brachial index [ABI]) is normally greater than 1. An ABI less than 0.9 suggests PAD.2
Chest
In the patient with chest pain, a thorough lung examination should be performed to exclude a pulmonary cause. The anterior chest wall is palpated to assess for the presence of tenderness in the sternal area, which may indicate that the patient has costochondritis. Percussion of the posterior chest is done to determine if a pleural effusion is present. Auscultation of the anterior and posterior lung fields is performed to assess for the presence of findings suggestive of pneumonia, airway obstruction, pneumothorax, pleural effusion, or pulmonary edema.
Heart Sounds
![]() The typical “lub-dub” sound of the normal heart consists of the first heart sound (S1), which precedes ventricular contraction and is due to closure of the mitral and tricuspid valves, and the second heart sound (S2), which follows ventricular contraction and is due to closure of the aortic and pulmonic valves. Other heart sounds, which are normally not present (i.e., a third heart sound [S3], fourth heart sound [S4], or murmur), may indicate the presence of underlying heart disease (Fig. 1-1).
The typical “lub-dub” sound of the normal heart consists of the first heart sound (S1), which precedes ventricular contraction and is due to closure of the mitral and tricuspid valves, and the second heart sound (S2), which follows ventricular contraction and is due to closure of the aortic and pulmonic valves. Other heart sounds, which are normally not present (i.e., a third heart sound [S3], fourth heart sound [S4], or murmur), may indicate the presence of underlying heart disease (Fig. 1-1).
FIGURE 1-1 Correlation of the electrocardiogram (ECG) with an aortic pressure tracing and heart sounds. Normal heart sounds are S1 (mitral and tricuspid valve closure) and S2 (aortic and pulmonic valve closure). The S3 and S4 “gallops” are usually abnormal. The S3 occurs in early diastole as blood rapidly rushes into a volume-loaded ventricle (e.g., with decompensated congestive heart failure). The S4 occurs in late diastole and is caused by atrial contraction into a stiff, noncompliant ventricle (e.g., hypertrophy due to hypertension).
The S3, a so-called ventricular gallop, is a low-pitched sound usually heard at the cardiac apex in early diastole (i.e., immediately after S2). It is caused by the vibrations that occur when blood rapidly rushes from the atrium into a volume-loaded ventricle. Thus, it is usually associated with decompensated congestive heart failure or intravascular volume overload. A so-called “physiologic” S3 is heard commonly in healthy children (who often have an increased cardiac output) and may persist into young adulthood.
The S4 is a dull, low-pitched sound that is caused by the vibrations that occur when atrial contraction forces blood into a stiff, noncompliant ventricle. It is audible at the cardiac apex just before ventricular contraction (i.e., just before S1); it is not present in the subject with a normal heart. An S4 may be present in the patient with aorticstenosis, systemic arterial hypertension, hypertrophic cardiomyopathy, or CAD.
Murmurs are auditory vibrations resulting from turbulent blood flow within the heart chambers or across the valves. They are classified by their timing and duration within the cardiac cycle (systolic, diastolic, or continuous), location on the chest wall, intensity (grade 1 to 6, from softest to loudest), pitch (high or low frequency), and radiation (Fig. 1-2 and Table 1-2). Some murmurs are said to be “innocent” or “physiologic” and result from rapid, turbulent blood flow in the absence of cardiac disease. Fever, anxiety, anemia, hyperthyroidism, and pregnancy increase the intensity of a physiologic murmur.
FIGURE 1-2 Schematic illustrations of topographic areas on the precordium for cardiac auscultation. Auscultatory areas do not correspond to anatomic locations of the valves but to the sites at which particular valvular sounds are heard best. (Redrawn from Kinney MR, Packa DR, eds. Andreoli’s Comprehensive Cardiac Care, 8th ed. St. Louis, MO: Mosby, 1996, with permission.)
TABLE 1-2 Characteristic Murmurs
Systolic murmurs occur during ventricular contraction. They begin with or after S1 and end at or before S2, depending on the origin of the murmur. They are classified based on time of onset and termination within systole: midsystolic or holosystolic (pansystolic). Examples of midsystolic murmurs include pulmonic stenosis, aortic stenosis, and hypertrophic obstructive cardiomyopathy. Holosystolic murmurs occur when blood flows from a chamber of higher pressure to one of lower pressure throughout systole, such as occurs with mitral or tricuspid valve regurgitation or a ventricular septal defect.
Diastolic murmurs occur during ventricular filling. They begin with or after S2, depending on the origin of the murmur. Aortic or pulmonic valve regurgitation causes a high-pitched diastolic murmur that begins with S2, whereas stenosis of the mitral or tricuspid valves causes a low-pitched, “rumbling” diastolic murmur.
Continuous murmurs begin in systole and continue without interruption into all or part of diastole. Such murmurs are mainly a result of aortopulmonary connections (e.g., patent ductus arteriosus) or arteriovenous connections (e.g., arteriovenous fistula, coronary artery fistula, or arteriovenous malformation).
When a murmur is heard, the cardiac abnormality underlying it usually can be confirmed and assessed with echocardiography or other imaging modalities, such as cardiac angiography or magnetic resonance imaging (MRI) (see below).
PRACTICE GUIDELINES FOR DIAGNOSTIC AND PROGNOSTIC TESTING IN CARDIOVASCULAR DISEASE TESTING
The American Heart Association (AHA) and American College of Cardiology (ACC) Task Force on Practice Guidelines provide the indications and utility of various diagnostic cardiac tests (Fig. 1-3). Class I indications have unequivocal evidence or agreement that the specific procedure is useful and effective. Class II indications are those for which a divergence of opinion concerning the usefulness of the test is present: class IIa indications are those for which evidence or opinion in favor of the test exists, whereas class IIb indications are those for which less evidence favoring the test is present. Class III indications are those for which evidence or agreement exists that a diagnostic test is not useful.
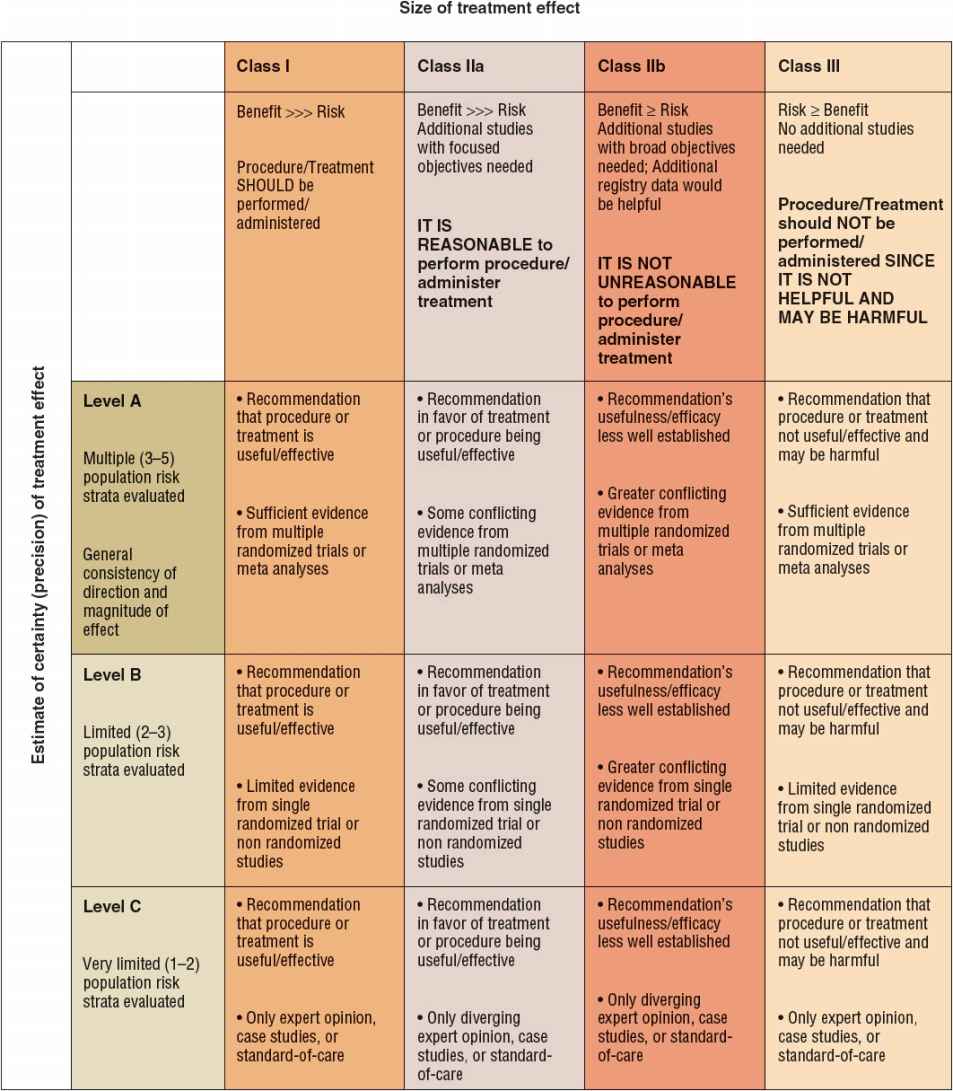
FIGURE 1-3 Classification of recommendations and level of evidence.
For a specific clinical scenario, the guidelines also indicate the level of evidence for the recommendation. Level A evidence is said to be present if the recommendation is based on the results of multiple randomized clinical trials. Level B evidence is said to exist if only a single randomized trial or multiple nonrandomized trials exist. Level C evidence is said to be present if the recommendation is made solely on expert opinion.
TESTING MODALITIES
Biomarkers
Blood tests are available for several substances that suggest the presence of myonecrosis (i.e., recent death of myocardial cells), inflammation, or hemodynamic stress (Fig. 1-4).3–5
FIGURE 1-4 Cardiac biomarkers classified according to the different pathologic processes they indicate.
Markers of Myonecrosis
When myocardial infarction (myonecrosis) occurs, proteins from the recently necrotic myocytes are released into the peripheral blood, where they can be detected using specific biochemical assays. These biomarkers of myonecrosis (a) aid in the diagnosis (or exclusion) of myocardial infarction as the cause of chest pain; (b) facilitate triage and risk stratification of patients with chest discomfort; and (c) identify patients who are appropriate candidates for specific therapeutic strategies or interventions. Cardiac troponin (cTn) is the preferred biomarker for the diagnosis of myonecrosis.5 Other available biomarkers of necrosis include creatine kinase-MB (CK-MB) and myoglobin.
Troponin (Tn) I and T are contractile proteins found only in cardiac myocytes. In the patient with myocardial infarction, cTn is detectable in the blood 2 to 4 hours after the onset of symptoms and remains detectable for 5 to 10 days (Fig. 1-5). cTn is the preferred marker for evaluating the patient suspected of having a myocardial infarction, since it is the most sensitive and tissue-specific biomarker available. In the patient with ischemic chest pain and electrocardiographic (e.g., ST segment) abnormalities, the presence of an elevated serum cTn concentration establishes the diagnosis of myocardial infarction, and the absence of such an elevation excludes it. The use of high-sensitive cTn assays improves the early diagnosis of patients with suspected myocardial infarction, particularly the early exclusion of it.6
FIGURE 1-5 Time course of the appearance of various markers in the blood after acute myocardial infarction. (Reprinted from Jaffe AS, Babuin L, Apple FS. Biomarkers in acute cardiac disease—The present and the future. J Am Coll Cardiol 2006;48:4. Copyright © 2006, with permission from Elsevier.)
In the patient with an acute coronary syndrome, detection and quantitation of cTn in the blood provide prognostic information and guide management. Acute coronary syndrome patients with an elevated serum cTn concentration have a roughly fourfold higher risk of death and recurrent MI in the coming months when compared with those with normal cTn concentrations. They benefit (i.e., have a reduced incidence of death, recurrent myocardial infarction, and recurrent ischemia) from more intensive antiplatelet and antithrombotic therapy as well as prompt coronary angiography and revascularization, whereas those with a normal serum cTn obtain no benefit from such intensive therapy.7,8 Thus, serum cTn concentrations are used for diagnostic, prognostic, and therapeutic purposes in the patient with suspected or proven CAD.
On occasion, the serum cTn concentration may be elevated in a patient without CAD in whom myonecrosis occurs because myocardial oxygen demands markedly exceed oxygen supply (caused, e.g., by tachycardia or severe systemic arterial hypertension) or nonischemic cardiac injury occurs (i.e., myocardial contusion caused by blunt trauma to the chest) (Table 1-3). In the patient with an elevated serum cTn concentration, the clinician must decide if the observed abnormal serum cTn concentration is the result of CAD or another condition.
TABLE 1-3 Conditions Associated with an Increased Serum Troponin Concentration
When serum cTn measurements are not available, the best alternative is the MB isoenzyme of creatine kinase (CK-MB), which is a cytosolic carrier protein for high-energy phosphates that is released into the blood when myonecrosis occurs. Although it was initially thought to be cardiac specific, CK-MB is now known to be present in small amounts in skeletal muscle; as a result, it may be detectable in the blood of patients with massive muscle injury, as occurs with rhabdomyolysis or myositis.
In the patient with a myocardial infarction, CK-MB can be detected in the blood 2 to 4 hours after symptom onset; its serum concentration peaks within 24 hours, and it remains detectable in the blood for 48 to 72 hours. To document the characteristic rise and fall of CK-MB concentrations, blood samples should be obtained every 4 to 8 hours. Although CK-MB is not as sensitive or cardiac-specific a biomarker as cTn, its blood concentration declines more rapidly than cTn, which makes it the preferred biomarker for evaluating suspected recurrent infarction in the patient who experiences recurrent chest pain within several days of myocardial infarction. With recurrent infarction, the typical rise and fall of the serum CK-MB concentration is interrupted by a second elevation. Conversely, serum cTn concentrations decline slowly following myocardial infarction; hence, they are not as sensitive as CK-MB for diagnosing recurrent infarction.
The serum myoglobin concentration is elevated in the patient with myonecrosis, but it has a low specificity for myocardial infarction because of its high concentration in skeletal muscle. Because of its small molecular size and consequent rapid release (within 1 hour) following the onset of myonecrosis, it is utilized as a very early marker of myocardial infarction. When it is combined with a more specific marker of myonecrosis, such as cTn or CK-MB, myoglobin is useful for the early exclusion of myocardial infarction.
Markers of Inflammation
Inflammatory processes participate in the development of atherosclerosis and contribute to the destabilization of atherosclerotic plaques, which may ultimately lead to an acute coronary syndrome. Several mediators of the inflammatory response, including acute-phase proteins, cytokines, and cellular adhesion molecules, have been evaluated as potential indicators of underlying atherosclerosis and as predictors of acute cardiovascular events.
C-reactive protein (CRP) is an acute-phase reactant protein produced by the liver.9 Although a receptor for CRP is present on endothelial cells, controversy exists regarding whether CRP is simply a marker for systemic inflammation or participates actively in atheroma formation.10, 11 In the absence of acute illness or myocar-dial infarction, serum concentrations of CRP are relatively stable, although they are influenced by gender and ethnicity.
Epidemiologic studies have shown that the relative risk of future vascular events increases as the serum high-sensitive CRP (hs-CRP) concentration increases.9 Values greater than 3 mg/L are associated with an increased risk for developing CVD; conversely, values less than 1 mg/L are associated with a low risk. Those between 1 and 3 mg/L are considered to be at intermediate risk. To measure serum CRP concentrations accurately, a hs-CRP assay is required. In an individual with an elevated serum hs-CRP concentration, the measurement should be repeated several weeks later to exclude the possibility that an acute illness was responsible for the elevation. Measurements should not be taken when subjects are acutely ill (e.g., with any acute febrile illness) or have a known autoimmune or rheumatologic disorder. Serum CRP concentrations above 10 mg/L are likely caused by an acute or chronic systemic illness.
Although the relative risk of future vascular events increases as the serum concentration of hs-CRP increases, controversy continues as to whether hs-CRP concentrations provide sufficient incremental information above traditional risk factors to warrant routine testing in subjects without known CVD in an attempt to prevent an adverse event (so-called primary prevention).9,12,13 Recent guidelines have suggested that CRP is useful in patients who are considered (on the basis of traditional risk factors) to be at intermediate risk for CAD in an attempt to guide the intensity with which their risk factors are modified.9,12 Only limited data have suggested that interventions that lower CRP concentrations (i.e., aspirin and statins) are beneficial.14–16
Clinical Controversy…
Multiple studies17,18 of patients with acute coronary syndromes have demonstrated the capacity of hs-CRP concentrations—measured at the time of hospitalization or hospital discharge—to help to predict cardiovascular outcomes during the hospitalization or during long-term followup. This prognostic information appears to be independent of and complementary to data obtained from the history and electrocardiogram (ECG). hs-CRP concentrations may be useful for monitoring the response to statin therapy, in that those with low hs-CRP concentrations after statin therapy have better clinical outcomes than those in whom these concentrations are high.14,16 Based on these data, the measurement of serum hs-CRP concentrations in patients with acute coronary syndromes is recommended as reasonable (class IIa) for risk stratification when additional prognostic information is desired.5 In contrast, its routine use is not recommended in the absence of compelling data identifying its role in guiding specific therapy.
Other novel markers of inflammation and/or plaque stabilization that have been shown to provide prognostic information in patients with an acute coronary syndrome are myeloperoxidase, CD40 ligand, P-selectin, pregnancy-associated plasma protein A, interleukin 6, matrix metalloproteinase-9, soluble intercellular adhesion molecule 1, and fibrinogen.3,5,19
Markers of Hemodynamic Stress
B-type natriuretic peptide (BNP) and its precursor, N-terminal pro-brain natriuretic protein (NT-proBNP), are released from ventricular myocytes in response to increases in wall stress. As a result, their serum concentrations typically are increased in patients with congestive heart failure. They may also be elevated in patients with an acute coronary syndrome as a result of left ventricular systolic dysfunction, impairment of ventricular relaxation, and myocardial stunning.5,20
Since serum BNP and NT-proBNP concentrations manifest substantial biologic variability, their serum concentrations in an individual subject must increase or decrease at least twofold to provide assurance that a “real” change has occurred. In addition, when considering the normal range for an individual, one must be aware that considerable variation in serum concentrations exists according to age, gender, weight, and renal function. Women and older patients have a higher normal range, whereas obese patients have lower values than the nonobese. Patients with renal failure often have substantially higher values.
Elevated BNP and NT-proBNP concentrations support a suspected diagnosis of heart failure or lead to a suspicion of heart failure when a diagnosis is unclear. Conversely, a normal value (BNP less than 100 pg/mL [100 ng/L; 28.9 pmol/L] or NT-proBNP less than 300 pg/mL [300 ng/L; 35.4 pmol/L]) in an untreated patient strongly suggests that heart failure is not present.20,21 In a study of 1,568 patients seeking medical attention after the abrupt onset of dyspnea, plasma BNP was significantly higher in those with clinically diagnosed heart failure than in those without (mean value, 675 pg/mL [675 ng/L; 195.1 pmol/L] compared with 110 pg/mL [110 ng/L; 31.8 pmol/L], respectively); those with known heart failure but with a noncardiac cause of dyspnea had intermediate values (mean, 346 pg/mL [346 ng/L; 100 pmol/L]).22
Plasma BNP concentrations provide prognostic information in patients with acute decompensated heart failure: in-hospital mortality is threefold higher in those in the highest BNP quartile when compared with the lowest quartile.23 Similarly, in patients with compensated CHF, plasma BNP concentrations provide valuable prognostic information, in that each 100 pg/mL (100 ng/L; 28.9 pmol/L) increase in plasma BNP in these subjects is associated with a 35% increase in the relative risk of death.24 Although the measurement of BNP can be used for prognostic purposes in patients with CHF, its role in assessing treatment efficacy and modifying drug therapy is not clearly established.
Elevated plasma concentrations of BNP and NT-proBNP have been observed in subjects with heart failure with depressed left ventricular systolic function, heart failure with preserved left ventricular systolic function, elevated left ventricular filling pressures, left ventricular hypertrophy, atrial fibrillation, and myocardial ischemia. They may be elevated in certain noncardiac conditions, including pulmonary embolism, chronic obstructive pulmonary disease, hypoxemia, sepsis, cirrhosis, and renal failure. As a result, values of BNP or NT-proBNP should not be used in isolation either to confirm or to refute a diagnosis of heart failure.
Elevated serum concentrations of BNP and NT-proBNP may be detected in patients with an acute coronary syndrome. Data from more than 30 studies have indicated that BNP and NT-proBNP are among the most robust predictors of death and heart failure in patients hospitalized with an acute coronary syndrome.5,25–27 Nonetheless, data regarding the potential for these substances to guide specific therapeutic decisions, such as whether to perform coronary angiography and revascularization, have been mixed. At present, therefore, the use of BNP and NT-proBNP in patients with an acute coronary syndrome is limited to risk stratification, for which they can be used to help in the assessment of prognosis.
Chest Radiography
The chest x-ray provides supplemental information to the physical examination. Although it does not provide detailed information about internal cardiac structures, it can provide information about the position and size of the heart and its chambers as well as adjacent structures. The standard chest x-rays for evaluation of the lungs and heart are standing posteroanterior and lateral views taken with maximal inspiration; portable chest x-rays usually are less helpful. When possible, previous x-rays should be obtained for comparison.
The posteroanterior chest x-ray outlines the superior vena cava, right atrium, aortic knob, main pulmonary artery, left atrial appendage (especially if enlarged), and left ventricle. The lateral chest x-ray allows one to assess the right ventricle, inferior vena cava, and left ventricle. These structures are visualized as shadows of differing density rather than as discrete entities.
Cardiac enlargement is determined by the cardiothoracic ratio (CTR), which is the maximal transverse diameter of the heart divided by the maximal transverse diameter of the thorax on the posteroanterior view. The CTR normally is less than or equal to 0.45, but it may be higher (i.e., less than or equal to 0.55) in subjects with a large stroke volume (e.g., highly conditioned athletes). Certain cardiac conditions, such as heart failure and hypertension, may cause cardiac enlargement, with a resultant high CTR. Individual chamber enlargement can be seen on the chest x-ray. Left atrial enlargement is suspected if the left bronchus is elevated or the atrial appendage is enlarged. Left ventricular enlargement is the most common feature identified on chest x-ray and is seen as a lateral and downward displacement of the cardiac apex. Right ventricular enlargement is best seen on the lateral film, on which the heart appears to occupy the retrosternal space. A large pericardial effusion may appear as a large heart on a chest x-ray, but, in contrast to heart failure, pulmonary vascular congestion is not present (see below).
The pulmonary vessels are examined for size and filling. With diminished pulmonary blood flow, as would be present in the patient with tetralogy of Fallot or pulmonic valvular stenosis, the peripheral pulmonary vessels are small in caliber and underfilled. Increased pulmonary blood flow, as occurs with a high cardiac output or left-to-right intracardiac shunting, may lead to enlargement and tortuosity of the central and peripheral pulmonary vessels. Pulmonary arterial hypertension (increased pulmonary resistance) is identified by enlargement of the central pulmonary arteries and diminished peripheral perfusion. Elevated pulmonary venous pressure—usually the result of an elevated left atrial pressure—is characterized by dilation of vessels in the upper lung zones (e.g., cephalization of flow), owing to recruitment of upper lung vessels when blood is diverted from the constricted vessels in the lower lung zones.
Congestive heart failure causes Kerley B lines (edema of inter-lobular septae), which appear as thin, horizontal reticular lines in the costophrenic angles. As pulmonary venous pressure increases, alveolar edema becomes evident, and pleural effusions may appear as blunting of the costophrenic angles.
Electrocardiography
![]() The ECG is a graphic recording of the electrical potentials generated by the heart. The signals are detected by using electrodes attached to the extremities and chest wall (Figs. 1-6 and 1-7), which are then amplified and recorded (Fig. 1-8). The ECG leads display the instantaneous differences in potential between electrodes. As electrical activity approaches the positive electrode of the lead, it registers a positive (upright) deflection on the ECG, whereas electrical activity in the opposite direction of the positive electrode of the lead registers a negative (downward) deflection.
The ECG is a graphic recording of the electrical potentials generated by the heart. The signals are detected by using electrodes attached to the extremities and chest wall (Figs. 1-6 and 1-7), which are then amplified and recorded (Fig. 1-8). The ECG leads display the instantaneous differences in potential between electrodes. As electrical activity approaches the positive electrode of the lead, it registers a positive (upright) deflection on the ECG, whereas electrical activity in the opposite direction of the positive electrode of the lead registers a negative (downward) deflection.
FIGURE 1-6 With electrodes (depicted as dots) attached to each arm and leg, electrical activity on the torso (i.e., frontal plane) is recorded from six different directions. These are known as the limb leads: leads I, II, III, aVF, aVL, and aVR. (Source: Longo DL, Fauci AS, Kasper DL, Hauser SL, Jameson JL, Loscalzo J. Harrison’s Principles of Internal Medicine, 18th ed. Figure 245-2, www.accessmedicine.com. Copyright © The McGraw-Hill Companies, Inc. All rights reserved.)
FIGURE 1-7 A. Electrode positions of the precordial leads. (MCL, midclavicular line; V1, fourth intercostal space at the right sternal border; V2, fourth intercostal space at the left sternal border; V3, halfway between V2 and V4; V4, fifth intercostal space at the midclavicular line; V5, anterior axillary line directly lateral to V4; V6, anterior axillary space directly lateral to V5.) B. The precordial reference figure. Leads V1 and V2 are called right-sided precordial leads; leads V3 and V4, midprecordial leads; and leads V5 and V6, left-sided precordial leads. (Redrawn from Kinney MR, Packa DR, eds. Andreoli’s Comprehensive Cardiac Care, 8th ed. St. Louis, MO: Mosby, 1996, with permission.)
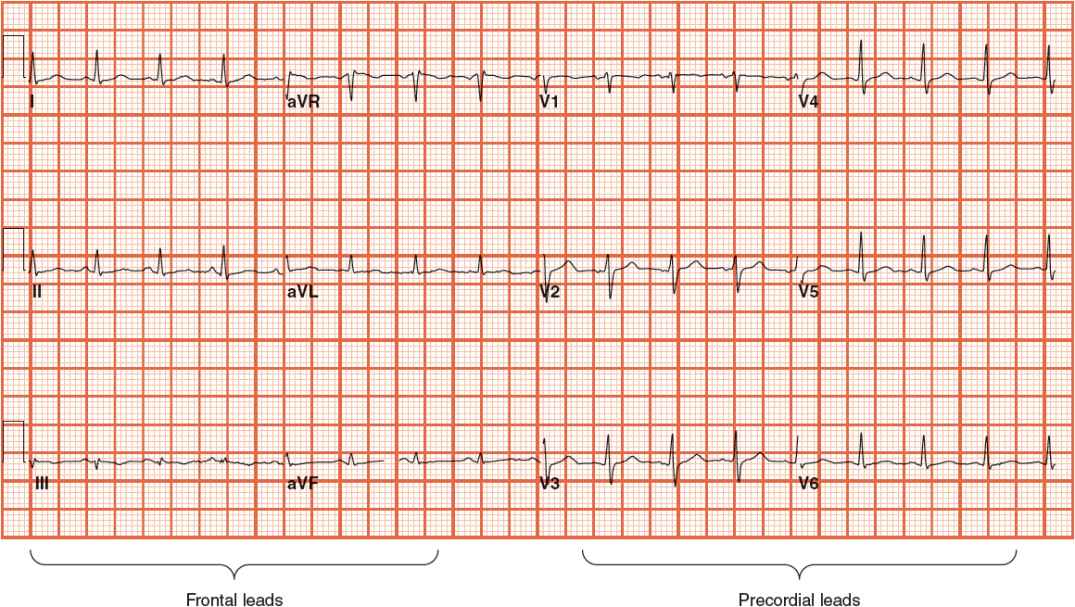
FIGURE 1-8 Standard 12-lead electrocardiogram, with six frontal and six precordial leads.
The ECG can be used to detect arrhythmias, conduction disturbances, myocardial ischemia or infarction, metabolic disturbances that may result in lethal arrhythmias (e.g., hyperkalemia), and increased susceptibility to sudden cardiac death (e.g., prolonged QT interval). It is simple to perform, noninvasive, and inexpensive.
Depolarization of the heart initiates cardiac contraction. The electrical current that depolarizes the heart originates in special cardiac pacemaker cells located in the sinoatrial (SA) node, or sinus node, which is located in the upper right atrium near the insertion of the superior vena cava (Fig. 1-9). The depolarization wave is transmitted through the atria, which initiates atrial contraction. Subsequently, the impulse is transmitted through specialized conduction tissues in (a) the atrioventricular (AV) node, which is located in the inferior right atrium near the tricuspid valve; (b) the bundle of His, which is located in the interventricular septum; and (c) the right and left bundles, which rapidly conduct the electrical impulse to the right and left ventricular myocardium via (d) the Purkinje fibers. The depolarization wave front then spreads through the ventricular muscle, from endocardium to epicardium, triggering ventricular contraction.
FIGURE 1-9 Schematic representation of the cardiac conduction system. (AV, atrioventricular; SA, sinoatrial.) (From Vijayaraman P, Ellenbogen KA. Bradyarrhythmias and pacemakers. In: Fuster V, O’Rourke RA, Walsh RA, Poole-Wilson P, eds. Hurst’s the Heart, 12th ed. New York: McGraw-Hill, 2004:1021.)
The ECG waveforms (Fig. 1-10), which are recorded during electrical depolarization of the heart, are labeled alphabetically and are read from left to right, beginning with the P wave, which represents depolarization of the atria. The normal duration of the P wave is up to 0.12 second. The PR segment, created by passage of the impulse through the AV node and the bundle of His and its branches, has a duration of 0.12 to 0.20 second. The QRS complex represents electrical depolarization of the ventricles. Initially, a negative deflection (the Q wave) appears, followed by a positive deflection, the R wave, and finally a negative deflection, the S wave. The normal duration of the QRS complex is less than 0.12 second. Since the left ventricle is much thicker than the right ventricle, most of the electrical wave front is directed toward the former. Accordingly, the precordial leads positioned over the left ventricle (leads V 5 and V 6) demonstrate a positive (upright) QRS complex, whereas those positioned over the right ventricle (V 1 and V 2) record a negative (downward) QRS complex.
FIGURE 1-10 ECG waveforms are labeled alphabetically and are read from left to right. The P wave represents depolarization of the atria. The PR segment is created by passage of the impulse through the atrioventricular node and the bundle of His and its branches. The QRS complex represents electrical repolarization of the ventricles. The T wave results from ventricular depolarization. A plateau phase called the ST segment extends from the end of the QRS complex to the beginning of the T wave. The ST segment elevates with transmural (full thickness) ischemia and depresses with ischemia. The QT interval—measured from the beginning of the QRS complex to the end of the T wave—includes the time required for ventricular depolarization and repolarization.
Following the QRS complex is a plateau phase called the ST segment, which extends from the end of the QRS complex (called the J point) to the beginning of the T wave. When ischemia occurs, one may observe depression of the ST segment (Fig. 1-11A). When infarction from total obstruction of a coronary artery occurs, ST segment elevation may be observed (Fig. 1-11B). Repolarization of the ventricle leads to the T wave. The T wave usually goes in the same direction as the QRS complex.
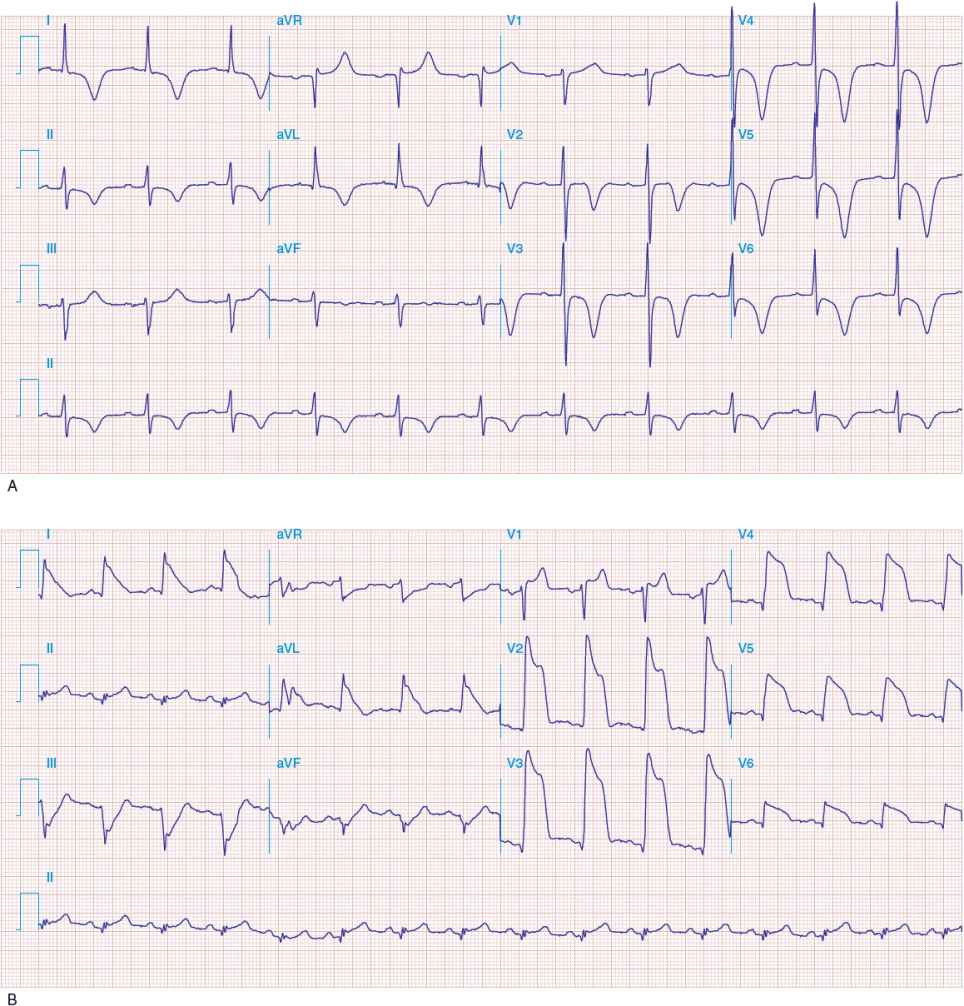
FIGURE 1-11 A. Anterior wall ischemia with deep T-wave inversions and ST segment depressions in leads I, aVL, and V 3 to V 6. (Source: Longo DL, Fauci AS, Kasper DL, Hauser SL, Jameson JL, Loscalzo J. Harrison’s Principles of internal Medicine, 18th ed. Figure e28-1, www.accessmedicine.com. Copyright © The McGraw-Hill Companies, Inc. All rights reserved.) B. Extensive anterior MI with marked ST elevations in leads I, aVL, V 1 to V 6, and small pathologic Q waves in V 3 to V 6. Marked reciprocal ST segment depressions in leads III and aVF. (Source: Longo DL, Fauci AS, Kasper DL, Hauser SL, Jameson JL, Loscalzo J. Harrison’s Principles of Internal Medicine, 18th ed. Figure e28-5, www.accessmedicine.com. Copyright © The McGraw-Hill Companies, Inc. All rights reserved.)
The QT interval—measured from the beginning of the QRS complex to the end of the T wave—includes the time required for ventricular depolarization and repolarization, and it varies inversely with heart rate. A rate-related (“corrected”) QT interval (QTc) can be calculated as ![]() interval; it should be less than 0.44 second. A prolonged QTc interval is caused by abnormalities in depolarization or repolarization that are associated with sudden cardiac death. QTc prolongation may be due to genetic defects in action potential ion channels (e.g., congenital long QT syndrome), drugs (Table 1-4), or electrolyte disturbances (i.e., hypokalemia, hypocalcemia, hypomagnesemia). Regardless of the cause, QT prolongation increases susceptibility to a potentially lethal arrhythmia, torsades de pointes (a type of ventricular tachycardia).
interval; it should be less than 0.44 second. A prolonged QTc interval is caused by abnormalities in depolarization or repolarization that are associated with sudden cardiac death. QTc prolongation may be due to genetic defects in action potential ion channels (e.g., congenital long QT syndrome), drugs (Table 1-4), or electrolyte disturbances (i.e., hypokalemia, hypocalcemia, hypomagnesemia). Regardless of the cause, QT prolongation increases susceptibility to a potentially lethal arrhythmia, torsades de pointes (a type of ventricular tachycardia).
TABLE 1-4 Drugs with Known Risk of QT Interval Prolongation and Potentially Lethal Arrhythmia (Torsades de Pointes)

The 12 conventional ECG leads record the electrical potential difference between electrodes placed on the surface of the body (Fig. 1-9). The six frontal plane and the six horizontal plane leads provide a three-dimensional (3D) representation of cardiac electrical activity. Each lead provides the opportunity to view atrial and ventricular depolarization from a different angle, much the same way that multiple video cameras positioned in different locations can view an event from different perspectives.
The six frontal leads can be subdivided into those that view electrical potentials directed inferiorly (leads II, III, aVF), laterally (leads I, aVL), or rightward (aVR). Likewise, the six precordial leads can be subdivided into those that view electrical potentials directed toward the septal (leads V 1, V 2), apical (leads V 3, V 4), or lateral (leads V 5, V 6) regions of the heart. Thus, when ischemia or infarction-related ECG changes occur, the region of the heart affected can be localized by determining which leads manifest abnormalities.
The mean orientation of the QRS vector with reference to the six frontal plane leads is known as the QRS axis. It describes the “major” direction of QRS depolarization, which is typically toward the apex of the heart (i.e., toward the left side of the chest and downward). An abnormality in the direction of QRS depolarization (so-called axis deviation) may occur with hypertrophy or enlargement of one or more cardiac chambers or with remote myocardial infarction, since electrical depolarization does not occur in dead tissue. Hypertrophy or enlargement of the atria or ventricles may also affect the size of the P wave or QRS complex, respectively. Although specific ECG criteria have been developed for diagnosing hypertrophy, the ECG is neither sensitive nor specific for establishing the presence of atrial dilation or ventricular hypertrophy. Other noninvasive modalities (i.e., echocardiography or MRI) are superior to the ECG for evaluating these conditions.
The origin of the electrical impulses (the so-called cardiac rhythm) and integrity of the conduction system can be assessed with a 12-lead ECG. If the SA node is diseased and unable to initiate cardiac depolarization, specialized cardiac pacemaker cells in the AV node or ventricle may initiate cardiac depolarization instead, albeit at a slower rate than the SA node. Alternatively, the SA node may initiate the electrical impulse, but its transmission through the specialized conduction system may be slowed or interrupted in the AV node or bundle of His, resulting in first-degree or advanced (i.e., second- or third-degree) AV block, respectively. Finally, disease in the left or right bundle may slow conduction of the electrical impulse, resulting in a left or right bundle-branch block, respectively.
The ECG provides an assessment of the heart rate, which is normally 60 to 100 beats per minute (beats/min) at rest. Tachycardia is present when the heart rate exceeds 100 beats/min, and bradycardia is present when it is less than 60 beats/min. Tachycardia may originate in the SA node (sinus tachycardia), atrium (atrial flutter or fibrillation, ectopic atrial tachycardia, or multifocal atrial tachycardia), or AV node (junctional tachycardia or AV nodal reentry tachycardia). Collectively, these are termed supraventricular tachycardias. Alternatively, a tachycardia may have its origin in the right or left ventricle (ventricular tachycardia, ventricular fibrillation, and right ventricular outflow tract tachycardia).
Many drugs can affect the specialized cardiac pacemaker cells—causing tachycardia or bradycardia—or the conduction system, which may lead to AV block or sudden cardiac death. A resting ECG should be performed before and after the administration of such drugs, with examination of the rhythm, heart rate, and various intervals (i.e., PR, QRS, and QT) to determine if substantial changes have occurred.
In the patient with chest pain, the resting ECG is examined for ST segment abnormalities that may indicate myocardial ischemia or infarction (i.e., ST segment depression or elevation). In addition, the resting ECG may indicate if the patient has had a remote myocardial infarction.
The ECG is used often in conjunction with other diagnostic tests to provide additional data, monitor the patient, or determine if symptoms correlate with what is observed on the ECG. For example, the patient suspected of having CAD may undergo stress testing with ECG monitoring to assess the presence of provocable ischemia.
Signal-Averaged ECG
Survivors of myocardial infarction may be at risk for life-threatening arrhythmias. In these individuals, myocardial scar tissue creates zones of slow conduction that appear as low-amplitude, high-frequency signals that are continuous with the QRS complex. These small electrical currents (so-called late potentials) are not detectable on a routine, traditional ECG. By using computer programs that amplify and enhance the electrical signal, signal-averaged electro-cardiography (SAECG) provides a high-resolution ECG that measures ventricular late potentials, thereby identifying patients at risk of sustained ventricular tachycardia after myocardial infarction.28
Patients with ischemic heart disease and unexplained syncope who are at risk for sustained ventricular tachycardia may be candidates for a SAECG. A SAECG may be useful in the patient with nonischemic cardiomyopathy and sustained ventricular tachycardia, detection of acute rejection following heart transplant, and assessment of the proarrhythmic potential of antiarrhythmic drugs.
Ambulatory Electrocardiographic Monitoring
Ambulatory electrocardiography (AECG), so-called Holter monitoring, can be used to detect, document, and characterize cardiac rhythm or ECG abnormalities during ordinary daily activities. Current continuous AECG equipment is capable of providing an analysis of cardiac electrical activity, including arrhythmias, ST segment abnormalities, and heart rate variability. An AECG can be obtained with continuous recorders (Holter monitors) or intermittent recorders.
During continuous Holter monitoring, the patient wears a portable ECG recorder (weighing 8 to 16 oz), which is attached to two to four leads placed on the chest wall. During monitoring, the patient maintains a diary, in which he/she records the occurrence, duration, and severity of symptoms (e.g., light-headedness, chest pain, palpitations, etc.). The device is typically worn for 24 to 48 hours, after which the continuous ECG recording is scanned by computer to detect arrhythmias or ST segment abnormalities to determine if they are responsible for the patient’s symptoms.
Intermittent recorders (also known as event monitors or loop recorders) are worn for longer periods of time (weeks to months). Although they continuously monitor the ECG, only brief (minutes) segments of it are recorded when the patient activates the device (i.e., when symptoms occur) or a preprogrammed abnormal ECG event occurs. Some intermittent event recorders incorporate a memory loop that permits capture of a rhythm recording during fleeting symptoms, tachycardia onset, and, in some cases, syncope that occurs infrequently. When the patient activates a looping monitor, it records several minutes of the preceding rhythm as well as the subsequent rhythm.
When monitoring is performed to evaluate the cause of intermittent symptoms, the frequency of symptoms dictates the type of recording. Continuous recordings are indicated for the assessment of frequent (at least once a day) symptoms that may be related to disturbances of heart rhythm, for the assessment of syncope or near syncope, and for patients with recurrent unexplained palpitations. In contrast, for patients whose symptoms are infrequent, intermittent event recorders may be more cost-effective in attempting to determine the cause of symptoms. For patients receiving antiarrhythmic drug therapy, continuous monitoring is indicated to assess drug response and to exclude proarrhythmia.
Exercise Stress Testing
![]() Exercise stress testing, a well-established, relatively low-cost procedure, has been in widespread use for decades. It may be performed (a) to evaluate an individual’s exercise capacity; (b) to assess the presence of myocardial ischemia in the patient with symptoms suggestive of CAD; (c) to obtain prognostic information in the patient with known CAD or recent myocardial infarction; (d) to evaluate the severity of valvular abnormalities; or (e) to assess the presence of arrhythmias or conduction abnormalities in the patient with exercise-induced cardiac symptoms (i.e., palpitations, light-headedness, or syncope).
Exercise stress testing, a well-established, relatively low-cost procedure, has been in widespread use for decades. It may be performed (a) to evaluate an individual’s exercise capacity; (b) to assess the presence of myocardial ischemia in the patient with symptoms suggestive of CAD; (c) to obtain prognostic information in the patient with known CAD or recent myocardial infarction; (d) to evaluate the severity of valvular abnormalities; or (e) to assess the presence of arrhythmias or conduction abnormalities in the patient with exercise-induced cardiac symptoms (i.e., palpitations, light-headedness, or syncope).
The patient who is to undergo an exercise stress test should fast for several hours beforehand and dress appropriately for exercise. Before exercise begins, a limited cardiac examination is performed (i.e., auscultation of the lungs and heart), blood pressure and heart rate are recorded, and a standard 12-lead ECG is recorded. Exercise is then initiated, and the ECG, heart rate, and blood pressure are monitored carefully and recorded as the intensity of exercise increases incrementally. The patient is monitored for the development of symptoms (i.e., chest pain, dyspnea, light-headedness, etc.), transient rhythm disturbances, ST segment abnormalities, and other electrocardiographic manifestations of myocardial ischemia. Exercise is terminated with the onset of limiting symptoms, diagnostic electrocardiographic (e.g., ST segment) changes, arrhythmias, or a decrease in blood pressure greater than 10 mm Hg. Otherwise, exercise is continued until the patient achieves 85% of his or her maximal predicted heart rate or is unable to exercise further.
Both treadmill and cycle ergometer devices are available for exercise testing. Although cycle ergometers are less expensive, smaller, and quieter than treadmills, quadricep muscle fatigue is a major limitation in patients who are not experienced cyclists, and subjects usually stop cycling before reaching their maximal oxygen uptake. As a result, treadmills are much more commonly used for exercise stress testing, particularly in the United States.
With treadmill testing, the incline and/or speed of the treadmill is increased incrementally every 2 to 3 minutes. Several treadmill exercise protocols have been developed to accommodate the variations in fitness, age, and mobility of individuals. Accordingly, if the exercise capacity is reported in minutes, the details of the protocol should be specified. Alternatively, the translation of exercise duration or workload into metabolic equivalents (METs) (oxygen uptake expressed in multiples of basal oxygen uptake, 3.5 mL O2/kg/min) has the advantage of providing a common measure of performance regardless of the type of exercise test or protocol used. Most domestic chores and activities require less than 5 METs, whereas participation in strenuous sports, such as swimming, singles tennis, football, basketball, or skiing, requires greater than 10 METs.
Interpretation of the results of exercise testing should include exercise capacity as well as the clinical, hemodynamic, and electrocardiographic responses. The occurrence of chest pain consistent with angina is important, particularly if it results in termination of the test. Abnormalities in exercise capacity, the response of systolic blood pressure to exercise, and the response of heart rate to exercise and recovery may provide valuable information. The most important electrocardiographic findings are ST segment depression and elevation. A positive exercise test is said to have occurred if the ECG shows at least 1 mm of horizontal or downsloping ST segment depression or elevation for at least 60 to 80 milliseconds after the end of the QRS complex.
ST segment changes suggestive of myocardial ischemia that occur at a low level of exercise (less than 6 minutes of exercise or less than 5 METs) are associated with more severe CAD and a worse prognosis than those that occur at a higher workload. An estimate of myocardial oxygen demands can be obtained by calculating the so-called “rate–pressure product” (double product) (i.e., heart rate × systolic arterial pressure).
Most treadmill exercise testing is performed in adults with symptoms of known or suspected ischemic heart disease. In patients for whom the diagnosis of CAD is certain, stress testing is often used for risk stratification or prognostic assessment to determine the need for possible coronary angiography or revascularization. Patients who are candidates for exercise testing may (a) have stable chest pain; (b) be stabilized with medical therapy following an episode of unstable chest pain; or (c) be post–myocardial infarction or post-revascularization.
The ability of the exercise stress test to identify (or to exclude) individuals with CAD is influenced by (a) their exercise capacity (i.e., can the individual perform maximal or nearly maximal exercise?); (b) the presence of baseline electrocardiographic abnormalities (i.e., bundle-branch block or ST segment depression); (c) medications that affect the ECG or the hemodynamic response to exercise (i.e., digoxin and β-adrenergic blocking agents, respectively); and (d) concomitant cardiac conditions that are associated with electrocardiographic abnormalities (i.e., left ventricular hypertrophy, paced rhythm, preexcitation) (Table 1-5). Thus, patients who are unable to exercise or who have baseline ECG abnormalities require imaging (i.e., radionuclide or echocardiographic) stress testing to detect (or to exclude) CAD, since routine stress testing is unreliable in these individuals.
TABLE 1-5 Meta-Analyses of Exercise Testing