Modern humans began consuming domesticated grains approximately 10,000 years ago as agrarian societies emerged. Before this time, humans were hunter-gatherers, and their diets consisted mainly of meats and wild plants. Relative to the history of Homo sapiens, consumption of diets high in grains is a fairly recent event in human evolution. Rice grown in the Near East is the oldest domesticated grain, and the cultivation of oats in Europe occurred about 3000 years ago. The origin of sugar cane is thought to be Papua New Guinea, where it was likely cultivated from wild plants, also at the time of the global Neolithic agricultural revolution. The slow diffusion of migrants brought sugar cane to India, Southeast Asia, and China. After the Arabs defeated the Romans, they brought sugar cane from Persia to Europe and the Mediterranean, where it failed to thrive, apart from the Moroccan coast. The returning crusaders brought sugar to the European courts, where it became an important and desirable luxury dietary constituent. Sugar cane was introduced to the Caribbean by Christopher Columbus on his second voyage in 1493. These plants thrived and were dispersed to Central and South America and throughout the Caribbean. By the early seventeenth century, raw sugar was being handled by refineries in England and France.
The chemistry of carbohydrates was launched in 1812 when Kirchoff, a Russian chemist, reported that starch, when boiled with dilute acid, produced a free sugar known to be contained in grapes (glucose). Schmidt, in 1844, designated carbohydrates as compounds that contained carbon, hydrogen, and oxygen and showed that sugar was found in the blood. Glycogen, the animal storage form of carbohydrate in liver and muscle, was discovered by the accomplished French physiologist Claude Bernard in 1856.
Today, sugar is produced and consumed worldwide, along with eight major cereal grains: wheat, rye, barley, oats, corn, rice, sorghum, and millet. Wheat and corn are the two major grains consumed in the Western countries. Technologic advances in harvesting techniques and plant breeding to produce disease-resistant plants since the early 1960s have yielded plants that are very different genetically from their ancient counterparts. Further, the refinement of grains to produce palatable, inexpensive foods coincided with a 48% increase in grain consumption (wheat and corn) from the 1970s to the new millennium. As awareness around the inverse relationship between whole grain consumption and chronic disease grows, there has been a resurgence of efforts to increase consumption of whole grains. Better accessibility to products and information through technology has spurred increased public demand for whole grains such as high-fiber wheat products, gluten-free products (quinoa, rice, amaranth), and other diverse grains (bulgur, Kamut [Khorasan wheat], rye).
DEFINITION
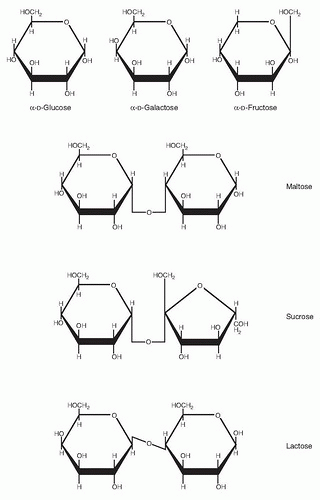
What are carbohydrates? The formal definition is a class of compounds having the formula Cn(H2O)n; that is, the molar ratio of carbon to hydrogen to oxygen is 1:2:1. Simple carbohydrates include the hexose monosaccharides (e.g., glucose, galactose, and fructose) and the disaccharides: maltose (glucose-glucose), sucrose (glucose-fructose), and lactose (glucose-galactose). Complex carbohydrates include the oligosaccharides that yield 3 to 10 monosaccharides on hydrolysis; examples include trioses (glycerose, C3H6O3), tetroses (erythrose, C4H8O4), and pentoses (ribose, C5H10O5). Pentoses are important constituents of nucleic acids. Polysaccharides are larger complex carbohydrates containing more than 10 monosaccharide units. Common polysaccharides include starch, glycogen, pectins, cellulose, and gums. The polysaccharides serve both energy storage and structural functions. Chitin is a modified polysaccharide containing nitrogen as N-acetylglucosamine that forms the exoskeleton of arthropods such as insects and crustaceans. Starch is the storage form carbohydrate of plants, whereas animals store carbohydrate as glycogen (liver contains up to 6% and muscle ˜1% glycogen by weight). Many different types of starch exist depending on the plant source. Inulin, for example, is a starch found in the tubers and roots of dahlias, artichokes, and dandelions and, when hydrolyzed, yields only fructose; hence it is a fructosan. Cellulose consists of glucose units linked by β (l-4) bonds to form long, straight chains strengthened by hydrogen bonding. It is the chief structural framework of plants and cannot be digested by humans because we do not produce an intestinal carbohydrase that hydrolyzes the β (1, 2, 3, 4) linkage. Thus, cellulose is considered to be a dietary fiber that provides bulk to plant-based foods. Bacterial enzymes, however, can break down cellulose. A small amount of fiber or cellulose is hydrolyzed by this process in the human colon, although microbial digestion of cellulose provides only negligible amounts of energy for humans.
DIETARY CARBOHYDRATES
As discussed earlier, carbohydrates represent a large family of naturally occurring compounds and derivatives of these compounds (Fig. 2.1). Only relatively small numbers of carbohydrates are produced commercially and used in the food industry or are of significant metabolic importance, however. Dietary carbohydrate is a major macronutrient for both humans and omnivorous animals. Human adults in the Western countries obtain approximately half their daily caloric requirements from dietary carbohydrate; in other countries, carbohydrate has been the major source of energy, at least until the more recent introduction of Western foods—with higher proportions of fat and protein—to many developing countries. Of ingested carbohydrate, approximately 60% is in the form of polysaccharides, mainly starch; but the disaccharides sucrose and lactose contribute 30% and 10%, respectively (Table 2.1). Monosaccharides (glucose and fructose) are naturally present in fruits and also are found in manufactured foods and drinks, primarily in the form of high-fructose corn syrup (HFCS). Some oligosaccharides, such as raffinose and stachyose, are found in small amounts in various legumes. They cannot be digested by pancreatic and intestinal enzymes (Table 2.2), but they are digested by bacterial enzymes, especially in the colon.
Digestible polysaccharides need to be broken down into their constituent monosaccharides before they can be absorbed and metabolized. This breakdown is initiated during mastication and gastric passage by the carbohydrase α-amylase secreted by the salivary glands, continued by pancreatic amylase in the duodenum, and completed by disaccharidases located in the brush-border membrane of the enterocytes in the small intestine (see Table 2.2 for the major intestinal glycosidases) (1).
Starch
Starch, the predominant dietary polysaccharide, consists only of glucose units and is thus a homopolysaccharide and is designated a glucosan or glucan. It is actually composed of two such homopolymers (Fig. 2.2): amylose, which has linear (1, 2, 3, 4) linked α-D-glucose, and amylopectin, a highly branched form containing both (1, 2, 3, 4) and (1, 2, 3, 4, 5, 6) linkages at the branch points. Plants contain both forms as insoluble, semicrystalline granules and differing ratios of amylopectin and amylose, depending on the plant source (Table 2.3). The salivary and pancreatic amylases act on the interior (1, 2, 3, 4) linkages but cannot break the outer glucose-glucose links. Thus, the final breakdown products formed by the amylases are α-(l-4)-linked disaccharides (maltose) and trisaccharides (maltotriose).
Fig. 2.1. Structures of the common dietary monosaccharides and disaccharides in perspective. Haworth representation.
Starch Breakdown
The breakdown of starch begins in the mouth with salivary amylase. It is often assumed that as this enzyme is swallowed into an acid stomach, the enzymatic carbohydrate breakdown is stopped (although acid hydrolysis may still occur) because salivary amylase is inhibited by a pH lower than 4. Starch and its end products and the proteins and amino acids present in a mixed meal all buffer the acid of the stomach and allow some amount of hydrolysis to continue, however. Thus, the quantitative involvement of salivary amylase in the breakdown of starch may be underestimated. Pancreatic α-amylase added to the emptying gastric contents (chyme) in the duodenum cannot hydrolyze the (1, 2, 3, 4, 5, 6) branching links and has little specificity for the (1, 2, 3, 4) links adjacent to the branching points. Amylase action produces large oligosaccharides (α-limit dextrins) containing on average approximately eight glucose units with one or more (1, 2, 3, 4, 5, 6) links. These α-limit dextrins are split by the enzymatic action of glucoamylase (α-limit dextrinase), which sequentially removes a single glucose unit from the nonreducing end of a linear α-(l-4)-glucosyl oligosaccharide. Maltose and maltotriose are then broken down by secreted and brush-border disaccharidases, especially sucrase-isomaltase, into free glucose, which is then transported into and across the enterocytes by hexose transporters (Table 2.4).
TABLE 2.1 PRINCIPAL DIETARY CARBOHYDRATES
FOOD SOURCE
GRAINS
STARCHY VEGETABLES
LEGUMES
FRUITS
SUGARS AND SWEETENERS
MILK
Rice
Yam
Soybeans
Apple
Cane sugar
Wheat
Potato
Dried peas
Orange
Beet sugar
Oats
Sweet corn
Lima beans
Grapes
Sorghum
Barley
Cassava
Peach Honey
Rye
Pineapple
Corn syrup
Maize Banana
Polysaccharide
Starch
Starch
Starch
Oligosaccharide
Raffinose, stachyose
Disaccharide
Maltose
Sucrose
Sucrose
Lactose
Monosaccharide
Fructose
Fructose
Glucose
Glucose
The initial breakdown of starch into α-limit dextrins, the intraluminal or cavital digestion phase, occurs mainly in the bulk fluid phase of the intestinal contents. In humans, there appears to be little of the so-called contact or membrane digestion in which adsorption of amylase onto the brush-border surface of enterocytes facilitates its enzymatic activity (2).
Normally, α-amylase is not a limiting factor in the assimilation of starches in humans; but newborn babies, and especially premature ones, cannot assimilate starch because the pancreas secretes insufficient α-amylase to digest it. Within a month, however, the secretion of α-amylase is usually sufficient for full digestion (3).
Resistant Starch
Starch is most frequently eaten after cooking. The heat of cooking gelatinizes the starch granules and thus increases their susceptibility to enzymatic (α-amylase) digestion. A proportion of the starch, however, known as resistant starch (RS), is indigestible even after prolonged incubation with amylase. In cereals, RS represents 0.4% to 2% of the dry matter; in potatoes, it is 1% to 3.5%; and in legumes, it is 3.5% to 5.7%. RS has been categorized as the sum of the starch and degradation products not absorbed in the small intestine of a healthy person (4). Three main categories are recognized: RS1, physically enclosed starch (partially milled grains and seeds); RS2, ungelatinized crystalline granules of the B-type x-ray pattern (as found in bananas and potatoes); and RS3, retrograded amylose (formed during the cooling of starch gelatinized by moist heating). The RSs escape digestion in the small intestine, but then they enter the colon where they can be fermented by the local resident bacteria (>400 different types). In this respect, RS is somewhat similar to dietary fiber. Estimates of the RS and unabsorbed starch represent approximately 2% to 5% of the total starch ingested in the average Western diet, approximately 10 g/day (5). The end products of the fermentation of the RS in the colon are short-chain fatty acids (e.g., acetate, butyrate, propionate), carbon dioxide, hydrogen, and methane (released as flatus).
TABLE 2.2 MAJOR GLYCOSIDASES OF THE MAMMALIAN ENTEROCYTE BRUSH BORDER
GLYCOSIDASE
ENZYME COMPLEX
ENZYME ACTIVITY
Maltase-sucrase
Sucrase-isomaltase
80% of maltase; some α-limit dextrinase; all of sucrase; most of isomaltase
All glucoamylase; most of α-limit dextrinase; 20% maltase; small percentage of isomaltase
Trehalase
All trehalase
Lactase
β-glycosidase
All neutral lactase and cellobiose
Glycosyl-ceramidase (phlorizin hydrolase)
Most of aryl-β-glycosidase
Adapted with permission from Dahlquist A, Semenza G. Disaccharidases of small-intestinal mucosa. J Pediatr Gastroenterol 1988;4:857-65.
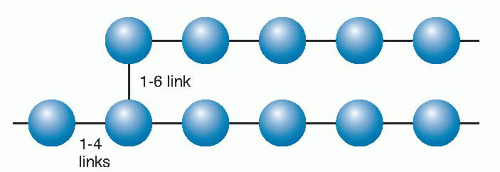
Fig. 2.2. Starch is composed of amylose (15% to 20%) and amylopectin (80% to 85%). Amylose is a nonbranching helical chain structure of glucose residues, whereas amylopectin (a portion shown here) has branched chains of 24 to 30 glucose residues (blue) joined by (1→4) glucosidic linkages with (1–6) linkages creating the branching points.
RSs stimulate bacterial growth in the colon. Shortchain fatty acids stimulate crypt cell mitosis in animals and humans (6). If the human colon is bypassed surgically, however, colonocytes lose their absorptive function, and ionic absorption is reduced. Luminal short-chain fatty acids from bacterial fermentation are used by colonocytes as metabolic substrates and appear to be required for normal colonic function (7). The volatile fatty acids such as butyrate and propionate produced by the microbial digestion of RSs and oligosaccharides (such as inulin and oligofructose) and dietary fiber (see later) can stimulate the expression and production of hormones produced by the distal gastrointestinal tract, including glucagonlike peptide-1 (GLP-1) and peptide-YY (PYY). GLP-1 and PYY can contribute to satiety in part by inhibiting gastric emptying, and GLP-1 in particular has beneficial effects on insulin secretion and carbohydrate and lipid metabolism (8, 9).
Dietary Fiber
Dietary fiber was originally defined as “the remnants of plant cell walls not hydrolyzed by the alimentary enzymes of man,” but the definition was subsequently modified to include “all plant polysaccharides and lignins, which are resistant to hydrolysis by the digestive enzymes of man” (10). Soluble dietary fiber includes pectin and hydrocolloids, and insoluble fiber includes cellulose and hemicellulose (11). Soluble and insoluble fibers are fermented by the luminal bacteria of the colon. High-fiber diets maintained for the long term reduce the incidence of colon cancer, but the mechanisms involved are not well understood. Investigators have suggested that the bulk action of fiber speeds colonic transit and reduces the absorption of luminal chemicals or that fiber absorbs the carcinogenic agents (6) (see also the chapter on fiber).
TABLE 2.3 AMYLOSE AND AMYLOPECTIN CONTENT OF VARIOUS PLANT STARCHES
PLANT
AMYLOSE (%)
AMYLOPECTIN (%)
Maize (standard)
24
76
Potato
20
80
Rice
18.5
81.5
Tapioca
16.7
83.3
Wheat
25
75
Sugars: Functions and Properties
Sugars, unlike starch, have an obvious impact on human taste because they are sweet. Sweet is one of five distinct tastes linked to specific receptors, and all other taste sensations are considered mixtures of these. The prevailing thought is that sweetness is not a unitary quality, and individual variation exists in the ability to “taste” different sweetness qualities for different sweeteners. Human neonates recognize and like sweetness—a finding that is not surprising because the lactose in their major food, human milk, gives it a sweet taste. Estimates of relative sweetness of various carbohydrates by humans are usually made against the standard, sucrose (100%). On this scale, glucose is less sweet (sweetness rating = 61 to 70), whereas fructose is sweeter, with a fruity taste (sweetness rating = 130 to 180). The sweetness of maltose is 43 to 50 and that of lactose is between 15 and 40. The sweetness ratings of the HFCS sweeteners are 128 for HFCS-55 (55% fructose) and 116 for HFCS-42 (42% fructose). Investigators have speculated that during human evolution, the quest for foods containing maximal energy caused primitive humans to acquire the ability to recognize that sweetness indicated safety and energy.
TABLE 2.4 HUMAN FACILITATED-DIFFUSION GLUCOSE TRANSPORTER FAMILY (GLUT1 TO GLUT5)
a The approximate Km values refer to the uptake of glucose (fructose in the case of GLUT5) in the designated tissue or cells in parentheses and are shown to give an approximate index of the affinity of the transporter for glucose.
Today, sugars (primarily sucrose, glucose, and fructose) are used extensively in foods to provide sweetness, energy, texture, and bulk and also for appearance, preservation (by raising the osmotic pressure), and fermentation (in bread, alcoholic beverages). The palatability, appearance, and shelf life of a huge variety of foods and drinks are enhanced by adding sucrose; examples are as follows: breads, cakes, and biscuits; preserves and jellies; confectionery; dairy products; cured, dried, and preserved meats; breakfast cereals; and frozen and canned vegetables. As a result of the addition of sugars to so many food products, sugar consumption has increased by 20% overall since the 1970s, and corn-based sweetener use has increased by 277% (12). In certain Western countries, soft drinks, “juice” drinks, and other beverages—sweetened with sucrose or HFCS—are major sources of dietary sugar. Incorporation of sweeteners into beverages and many other commonly consumed foods makes accurate assessment of dietary sugar intake difficult.
GETTING GLUCOSE INTO CELLS: THE TRANSPORTERS
A major source of metabolic energy for most, if not all, mammalian cells is the oxidation of D-glucose. The lipid-rich membranes of such cells, however, are relatively impermeable to hydrophilic polar molecules such as glucose. Specific transport processes have evolved to allow the cellular entry and exit of glucose. Carrier proteins located in the plasma membranes of cells can bind glucose and allow it to traverse the lipid membrane barrier, thus releasing the hexose into the cellular cytoplasm or body fluids.
Two distinct classes have been described: (a) a family of facilitative glucose transporters (see Table 2.4) and (b) sodium (Na+)-glucose cotransporters (symporters). The former class consists of membrane integral proteins found on the surface of all cells. They transport D-glucose down its concentration gradient (from high to low), a process described as facilitative diffusion. The energy for the transfer is derived from the concentration gradient of glucose across plasma membranes. Glucose transporters allow glucose to enter cells readily, but they can also allow it to exit from cells according to the prevailing concentration gradient. In contrast, the Na+-glucose cotransporters participate in the “uphill” movement of D-glucose against its concentration gradient; that is, they perform active transport. They are especially expressed in the specialized brush borders of the enterocytes of the small intestine and the epithelial cells of the kidney (proximal) tubule. They occur at lower levels in the epithelial cells lining the lung and in the liver (13). Cooperation between the two classes of glucose transporters, together with the hormones involved in carbohydrate metabolism, allows fine control of glucose concentration in the plasma and thus maintains a continuous supply of the body’s main source of cellular energy.
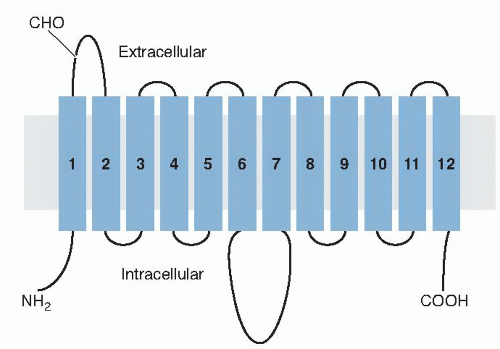
Fig. 2.3. Highly schematic diagram illustrating the predicted secondary structure model of the glucose transporter molecule (GLUT1) in the cell membrane (gray shaded). The putative membrane-spanning α-helices are shown as rectangles numbered 1 to 12 connected by chains (lines) of linked amino acids. (Adapted with permission from Mueckler M, Caruso C, Baldwin SA et al. Sequence and structure of a human glucose transporter. Science 1985;229:941-5.)
Human Facilitative-Diffusion Glucose Transporter Family
Several major hexose transporters have been identified and cloned since the characterization of the first, glucose transporter 1 (GLUT1), by molecular cloning (14). The classical glucose transporters, GLUT1 to GLUT4, are well-characterized proteins with similar molecular structures containing between 492 and 524 amino acid residues. Mueckler et al (14), using hydropathic and secondary structure predictions, proposed a two-dimensional orientation model of GLUT1 in the plasma membrane (Fig. 2.3). The molecule has three major domains: (a) 12 α-spanning the membrane with the N and C termini of the protein on the cytoplasmic side of the cell membrane, (b) an intracellular domain of 65 hydrophilic amino acids (between membrane [M] regions 6 and M7 of Fig. 2.3), and (c) an extracellular 33-amino acid segment (between Ml and M2) containing the site for an asparagine-linked oligosaccharide at asparagine 45.
The prediction was that the polypeptide backbone of the molecule traverses or spans the plasma membrane 12 times. Both the amino- and carboxy-terminal ends of the molecule are on the cytoplasmic side of the membrane, whereas an N-glycosylation site is present on the first extracytoplasmic loop (Ml and M2). These basic topologic features have been confirmed by studies using proteolytic digestion and sequence-specific antibodies. GLUT1, purified from human red blood cells and reconstituted in liposomes, appears to be predominant in the α-helical form, and the transmembrane segments form α-helices at right angles to the plane of the lipid membrane (15). The molecular structure of GLUT1, shown in Figure 2.3, is, of course, a two-dimensional model. Studies using radiation inactivation of the carrier in intact red blood cells have indicated that GLUT1 probably exists as homotetramer (16). The structures, properties, expression sites, and roles of each of the five facilitative glucose transporter isoforms are briefly described here and are summarized in Table 2.4. Because of the recognized importance of these transporters in health and disease, numerous reviews have been published (17, 18, 19, 20, 21), and they should be consulted for greater detail.
GLUT1 (Erythroid-Brain Carrier)
GLUT1 is the glucose transporter in the human red blood cell. The first to be characterized by molecular cloning (14), it consists of 492 amino acid residues (see Table 2.4). The gene for its expression is located on chromosome 1. GLUT1 is widely distributed in many other tissues including heart, kidney, adipose cells, fibroblasts, placenta, retina, and brain, but little is expressed in muscle or liver. There is particularly high expression in the endothelial cells of the microvessels of the brain, where GLUT1 forms part of the blood-brain barrier (22). The transport process for D-glucose in the red blood cell is asymmetric, because the affinity (Michaelis-Menten constant [Km]) for D-glucose uptake is approximately 1 to 2 mmol/L, whereas the Km for the exit of glucose is 20 to 30 mmol/L. This asymmetry appears to be allosterically regulated by the binding of intracellular metabolites and inhibited by adenosine triphosphate (ATP) (23). The asymmetry allows the transporter to be effective when the extracellular glucose is low and the intracellular demand is high.
GLUT2 (Hepatic Glucose Transporter)
Many biochemical studies indicated that the glucose transporter in liver cells was distinct from that of the red blood cells. Moreover, adult liver cells had only very low levels of GLUT1 mRNA. Cloning of the second glucose carrier, GLUT2, was accomplished by screening rat and human cDNA libraries with a cDNA probe for GLUT1. GLUT2 has 55% identity in amino acid sequence with GLUT1, and it displays the same topologic organization in the cell membrane as predicted for GLUT1. Human GLUT2 contains 524 amino acids (see Table 2.4) compared with rat GLUT1 of 522 residues, and they show 82% identity in amino acid sequences—an excellent example of conservation of structure among species. GLUT2 is preferentially expressed in liver (sinusoidal membranes), kidney (tubule cells), small intestine (enterocytes), and the insulin-secreting β cells of the pancreas.
In the liver cell, GLUT2 has a low affinity for glucose (Km = 17 mmol/L) and shows symmetric transport, that is, a similar Km for influx and efflux. This high-capacity, low-affinity transporter is useful for rapid glucose efflux following gluconeogenesis. GLUT2 can also transport galactose, mannose, and fructose (24).
GLUT3 (Brain Glucose Transporter)
GLUT3 was originally cloned from a human fetal muscle cDNA library (25). It contains 496 amino acid residues (see Table 2.4) and shows 64% identity with GLUT1 and 52% identity with GLUT2. Its amino acid sequence again suggests that its membrane topology is similar to that of GLUT1 (see Fig. 2.3). GLUT3 mRNA appears to be present in all tissues, but its highest expression is in adult brain, kidney, and placenta. Adult muscle, however, shows only very low levels. In the brain, it is mainly expressed in neurons. GLUT3 mRNA is found in fibroblasts and in smooth muscle. Because both these cell types are found in practically all tissues, the ubiquitous expression of GLUT3 is understandable. Its affinity for glucose transport is relatively low (Km ≈ 10 mmol/L) but significantly higher than that of GLUT1 (17 mmol/L). GLUT3 is also found in spermatozoa. Such cells undertake glycolysis in the male genital tract and take up glucose from epididymal fluid.
GLUT4 (Insulin-Responsive Glucose Transporter)
Glucose is transported across the cell membranes of adipocytes (fat cells), and its rate of transport can be speeded up 20- to 30-fold within 2 or 3 minutes by addition of insulin, without evidence of protein synthesis. Studies showed that this stimulation of glucose transport resulted in part from translocation of GLUT1 from an intracellular pool into the membrane. Careful quantitative measurements showed, however, that this could account for only a 12- to 15-fold increase in glucose transport. It became obvious that another transporter would have to be involved to account for the much larger insulin-stimulated transport. This new transporter, GLUT4, was first identified in rat adipocytes by use of a monoclonal antibody. Subsequently, GLUT4 has been cloned from rat, mouse, and human DNA (24). It is a protein with 509 amino acid residues (see Table 2.4), with 65% identity with GLUT1, 54% identity with GLUT2, and 58% identity with GLUT3. Rat and mouse GLUT4s have 95% and 96% identity, respectively, with human
GLUT4. As with the previous GLUT transporters, the twodimensional orientation of the structure in the cell membrane is similar to that proposed for GLUT1 (see Fig. 2.3). GLUT4 is the major glucose transporter of the insulinsensitive tissues, brown and white fat, and skeletal and cardiac muscle. It occurs primarily in intracellular vesicles in the cells of these tissues. Insulin stimulation causes a rapid increase in the number of glucose transporters on the membranes of these cells because the vesicles are translocated toward the membrane and then fuse with it, thereby releasing the molecule. This process ensures a high density of glucose transporters and enhances the ability to move glucose from the surrounding cellular fluid into the interior of the cell, that is, increased maximal velocity for glucose uptake. Because of this mechanism, the position of GLUT4 and its regulation are important components of glucose homeostasis, and the role of GLUT4 in diabetes has been and continues to be the subject of intense investigation.
GLUT5 (The Fructose Transporter)
GLUT5 was isolated from human (26), rat, and rabbit enterocyte cDNA libraries. It consists of 501 amino acid residues (see Table 2.4), and it has only 42%, 40%, 39%, and 42% identity with GLUTs 1, 2, 3, and 4, respectively. It is said to be primarily expressed in the jejunum (both in the brush border and basolateral membrane); but its mRNA has been detected, albeit at low levels, in human kidney, skeletal muscle and adipocytes, microglial cells, and the blood-brain barrier. GLUT5 appears to transport glucose poorly and is really the transporter for fructose. It is found in high concentrations in mature human spermatozoa (27), which are known to use fructose as an energy source (human seminal fluid contains high concentrations of fructose, which is manufactured by the seminal vesicles). The Km for fructose uptake by expressed GLUT5 was 6 to 11 mmol/L. With importance to the regulation of energy homeostasis, the expression of GLUT5 in pancreatic β cells is very low (28), and consequently fructose has little if any effect on stimulation of insulin secretion (29).
Only gold members can continue reading. Log In or Register to continue