Carbohydrate Metabolism: Synthesis and Oxidation


Carbohydrate Metabolism


Synthesis and Oxidation


Mary M. McGrane, PhD


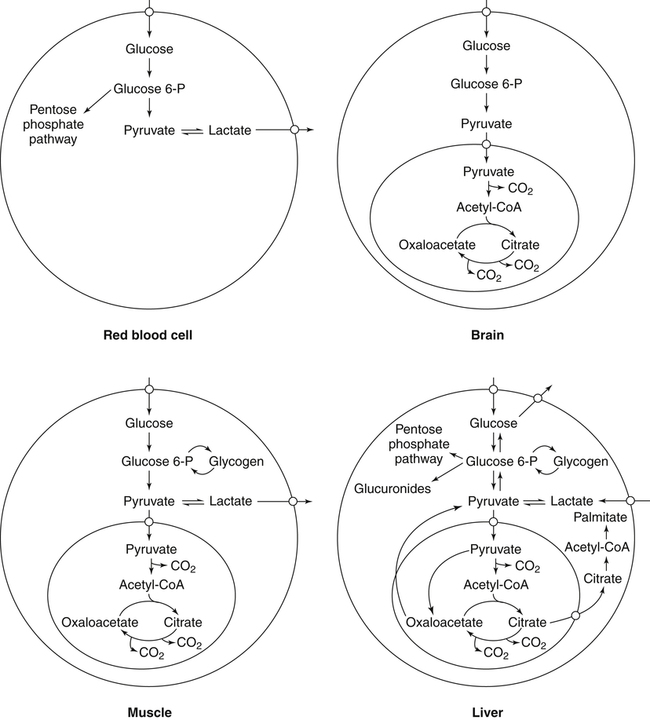
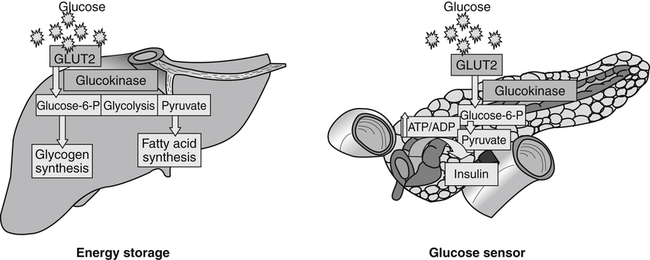
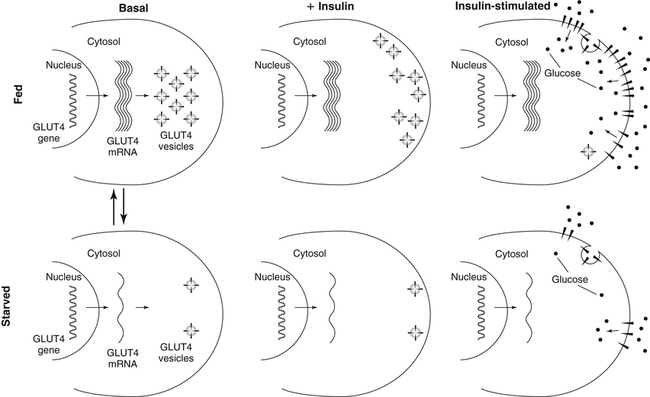
Carbohydrates present in food provide an average of 50% (range of about 32% to 70%) of the energy in the American diet, and the recommended intake range, or Acceptable Macronutrient Distribution Range (AMDR), is 45% to 65% of calories (Institute of Medicine [IOM], 2002). Carbohydrates, consumed as disaccharides, oligosaccharides, and polysaccharides, are digested, absorbed, and transported through the body primarily as glucose, although fructose and galactose are present as well. Glucose is the primary metabolic fuel in humans in the postprandial state due to the abundance of carbohydrate in the diet, the capacity of all tissues to catabolize it, and the limited capacity for glucose storage in the body.


Some specialized cell types such as red blood cells are completely dependent on glucose for their energy needs, and it is critical for the body to maintain a glucose supply for these tissues. To maintain blood glucose within its strictly regulated concentration range (4 to 6 mmol/L) during periods in which glucose is not being absorbed from the gastrointestinal tract, the body is able to produce glucose by breakdown of body glycogen stores and by endogenous biosynthesis of glucose from nonhexose precursors. The balance among glucose oxidation, glucose biosynthesis, and glucose storage is dependent upon the hormonal and nutritional state of the cell, the tissue, and the whole organism.


Aspects of carbohydrate metabolism considered in this chapter include glucose transport, catabolism of glucose by glycolysis to pyruvate, the oxidative decarboxylation of pyruvate to acetyl-CoA by the pyruvate dehydrogenase complex, the further metabolism of acetyl-CoA by the citric acid cycle, glucose production by gluconeogenesis, glycogen metabolism, and more specialized pathways such as the pentose phosphate pathway and oligosaccharide chain synthesis. Some processes occurs in all cells, whereas others predominantly occur in specific tissues.


Overview of Tissue-Specific Glucose Metabolism


Tissue-specific differences in the pathways of glucose oxidation, glucose storage, glucose biosynthesis, and the utilization of glucose for the synthesis of other biomolecules are summarized in Figure 12-1 for liver, muscle, brain, and red blood cells. Pathways in the various tissues are coordinated to meet the metabolic challenges of the whole body.


Liver


The liver plays the central role in glucose homeostasis in the body, because it can both remove and produce blood glucose. In liver parenchymal cells (hepatocytes), glucose can be oxidized for energy, stored as glycogen, or partially catabolized to provide carbons for the biosynthesis of fatty acids or amino acids. When glucose supply is low, the liver can produce glucose by glycogen degradation or by de novo synthesis and release this glucose into the bloodstream. The liver plays an important role in cycling carbon from glycolysis in muscle or other tissues back to glucose by taking up lactate, pyruvate, and alanine and using these carbon chains for gluconeogenesis. The hepatocyte also has the ability to utilize glucose for NADPH and ribose 5-phosphate production via the pentose phosphate pathway. Production of NADPH by the pentose phosphate pathway provides a necessary source of energy for synthesis of fatty acids and cholesterol from glucose. Other tissues, such as adipose tissue, skeletal and cardiac muscle, and brain, respond to blood glucose changes by altering their internal usage, but they do not contribute to whole-body glucose homeostasis by releasing glucose to the blood as the liver does.


Muscle


In skeletal muscle and heart, glucose can be completely oxidized or it can be stored in the form of glycogen. Although glycogen is degraded in muscle and cardiac cells, the glucose 6-phosphate produced is oxidized without leaving the cell. Glucose is not released to the circulating blood from either skeletal or cardiac muscle.


The metabolic needs of cardiac tissue differ from those of skeletal tissue. The heart has a continuous need for energy to conduct regular contractions, and glucose metabolism in cardiac tissue is aerobic at all times. In contrast, skeletal muscle can function metabolically with insufficient oxygen, or anaerobically, for limited periods. When functioning anaerobically or partially anaerobically, skeletal muscle converts glucose to lactate and releases it into the bloodstream.


Adipose Tissue


Adipose tissue presents another metabolic paradigm. In adipose cells, glucose can be partially degraded by glycolysis to provide glycerol for triacylglycerol synthesis. It can also be completely oxidized for energy. Under conditions of high carbohydrate intake, the acetyl-CoA produced during glucose oxidation can be channeled to de novo fatty acid synthesis for storage of fat. In humans, however, liver is much more active in de novo fatty acid synthesis than is adipose tissue. Under conditions of energy need, adipose cells release metabolic fuel in the form of free fatty acids to the circulating blood supply. Additionally, under these conditions, adipocytes conduct an abbreviated gluconeogenesis, referred to as glyceroneogenesis, to produce glycerol for triacylglycerol synthesis. This allows fine-tuned regulation of free fatty acid release because some free fatty acids from lipolysis are reesterified to triacylglycerols and are not released from the adipocyte. This cycle ensures that excess free fatty acids do not go into the circulation.


Brain and Other Glycolytic Tissues


The brain, which is completely dependent upon glucose for its energy needs under normal dietary conditions, is capable of completely oxidizing glucose to CO2 and H2O via glycolysis and the citric acid cycle. The brain requires a continuous supply of glucose from the blood, because there is little storage of glucose in the form of glycogen in the brain. Red blood cells, on the other hand, have a limited ability to metabolize glucose because they lack mitochondria. In red blood cells, glucose is metabolized to lactate, and lactate is released to the circulation. Other specialized cells are also primarily glycolytic because of a relative lack of mitochondria or limited blood or oxygen supply relative to their rates of metabolism; these include leukocytes, white muscle fibers, cells of the testis, the renal medulla, and some cells of the cornea, lens, and retina of the eye.


Transport of Glucose Across Cell Membranes


Glucose is taken up into cells by glucose transporters. Most tissues contain facilitated glucose transporters, whereas the small intestinal absorptive cells (enterocytes) couple glucose and Na+ uptake.


Facilitated Transport of Glucose: the GLUT Transporters


Cellular uptake of blood glucose occurs by a facilitated transport process. Facilitated glucose uptake is mediated by a family of structurally related glucose transport proteins that have specific tissue distributions. Five isoforms of the glucose transporter have been well studied: glucose transporter type 1 (GLUT1) in red blood cells and brain, GLUT2 in liver and pancreas, GLUT3 in brain, GLUT4 (insulin-responsive) in skeletal and cardiac muscles and adipose tissue, and GLUT5 in the small intestine. Although different glucose transporters predominate in specific tissues, most tissues contain more than one isoform. These glucose transporters are encoded by genes in the SLC2A family of solute carriers. The demands of glucose uptake vary depending on the tissue involved and the physiological environment of the cell. The glucose transporter isoforms serve different functions to meet these variable demands. Glucose is taken up by cells in an insulin-independent manner in liver and certain extrahepatic tissues, such as brain and red blood cells, and in an insulin-dependent manner by cells in muscle and adipose tissue.


GLUT2


GLUT2 is a low-affinity glucose transporter that is localized primarily in the liver and the beta cells of the pancreas. To a lesser extent, it is found in the small intestine and kidneys. GLUT2 has a high Km for glucose and is a key transport protein involved in responding to elevated blood glucose in humans. In liver, because of the expression of GLUT2, maximal glucose uptake occurs when blood glucose levels are high, such as after a carbohydrate-containing meal. In the pancreatic beta cell, glucose uptake via GLUT2 signals that the blood glucose concentration has increased and begins the process by which the beta cell responds to elevated blood glucose with secretion of insulin into the bloodstream. In the pancreas, glucose is transported into the beta cell where it is rapidly phosphorylated to glucose 6-phosphate by a high Km glucokinase. The increase in glycolysis and oxidative metabolism of glucose increases the ATP/ADP ratio leading to a series of intracellular changes that result in the fusion of insulin-containing storage vesicles with the cell membrane and the release of insulin to the bloodstream (Figure 12-2). The combined action of GLUT2 and glucokinase allows the pancreatic beta cell to “sense” the blood glucose concentration and respond by increased secretion of insulin (Postic et al., 2001). In the small intestine and kidney tubules, GLUT2 is involved in glucose absorption and reabsorption, respectively, across the basolateral membranes of the epithelial cell barriers of these two tissues.


Expression of the gene for GLUT2, SLC2A2, is regulated in a tissue-specific manner. In liver, SLC2A2 expression does not appear to be regulated by dietary carbohydrate or insulin, and GLUT2 levels in liver have not been found to change consistently in response to altered metabolic states. However, SCL2A2 gene expression in pancreatic beta cells is decreased when blood glucose levels are low. Conversely, a rise in blood glucose levels increases SCL2A2 messenger RNA (mRNA) and protein levels in pancreatic beta cells. SCL2A2 knockout mice are unable to sense glucose concentrations in the blood and exhibit impaired insulin secretion. This was rescued by reexpression of the SCL2A2 gene in pancreatic cells, which restored insulin secretion by the pancreas (Thorens, 2002).


GLUT4


GLUT4 is present primarily in skeletal and cardiac muscle and in white and brown adipose tissue and is the only insulin-responsive glucose transporter. GLUT4 is encoded by the SLC2A4 gene. GLUT4 has a unique physiological role in whole-body glucose homeostasis. In effect, GLUT4 mediates the second-tier response to elevated blood glucose. In skeletal and cardiac muscle and adipose tissue, insulin stimulates a rapid translocation of preformed GLUT4 from intracellular vesicles in the cytosol to the plasma membrane of the cell surface (Czech, 1995). By increasing the concentration of glucose transporters at the cell surface, insulin increases the capacity for glucose uptake. Insulin signaling is known to activate AS160 (Akt substrate of 160 kDa), which is a Rab GTPase-activating protein, and TC10, which is a GTP-binding protein, both of which are required for insulin-stimulated GLUT4 translocation (Miinea et al., 2005). When insulin levels fall, GLUT4 is returned to the intracellular vesicular system by endocytosis. In unstimulated muscle and adipose cells, approximately 90% of GLUT4 is intracellular (Ishiki and Klip, 2005). Upregulation of GLUT4 translocation is disrupted in individuals with insulin resistance due to accumulation of intramyocellular lipid that interferes with insulin signaling (Petersen and Shulman, 2006).


Exercise can also stimulate GLUT4 translocation to the plasma membrane in skeletal muscle, but this involves a different signaling pathway than that initiated by insulin (Uldry and Thorens, 2004). Exercise induces the cumulative effects of numerous inputs, including adenosine monophosphate (AMP)-activated protein kinase (AMPK) and increased cytosolic calcium (Ca2+) levels as major factors. There may be distal convergence between the insulin and exercise signaling pathways regulating GLUT4 translocation in skeletal muscle (Cartee and Funai, 2009).


In addition to affecting the translocation of existing GLUT4 molecules to the plasma membrane, fasting, refeeding, and insulin level can also affect the expression of new GLUT4 molecules. Fasting or type 2 diabetes leads to a significant decrease in SLC2A4 mRNA and GLUT4 protein in adipocytes. This decrease can be reversed by carbohydrate refeeding or insulin treatment. A depletion in SLC2A4 mRNA and protein results in a decrease in the vesicular GLUT4 pool that is available for translocation to the plasma membrane. The decrease in SLC2A4 gene expression and the decrease in insulin-stimulated GLUT4 translocation both contribute to the decrease in glucose uptake in adipocytes with insulin deprivation (Figure 12-3).


Expression of the SLC2A4 gene has also been investigated in skeletal muscle. Because the red and white muscle fiber types have different insulin sensitivities and GLUT4 concentrations, it has been difficult to determine the hormonal responsiveness of the SLC2A4 gene in skeletal muscle. Most studies indicate that SLC2A4 expression in muscle is not decreased in patients with insulin resistance/type 2 diabetes. This is surprising because skeletal muscle is responsible for at least 50% of glucose uptake from the blood after a carbohydrate-containing meal, whereas adipose tissue is responsible for much less. Studies in mice in which the SLC2A4 gene was selectively ablated in specific tissues, such as skeletal muscle and adipose tissue, indicated that there is “cross talk” between these two tissues, such that a decrease in adipose GLUT4 level (and therefore glucose uptake) decreases glucose uptake in skeletal muscle (Minokoshi et al., 2003).


GLUT1 and GLUT3


GLUT1 and GLUT3 are both high-affinity glucose transporters. GLUT1 is abundant in the brain, placenta, and fetal tissues. In these tissues, GLUT1 mediates glucose uptake across a blood–tissue barrier (e.g., the blood–brain barrier). GLUT1 is also found at low levels in erythrocytes and most other tissues and may be involved in the underlying constitutive glucose uptake of the whole organism. Under fasting conditions, GLUT1 is present at the plasma membrane of cells in muscle and adipose tissue at a higher relative abundance than that for GLUT4. Because GLUT1 cell surface abundance is not affected by insulin, however, GLUT4 becomes the dominant glucose transporter present on the cell membrane of muscle cells and adipocytes during insulin-stimulated states. GLUT3 is present at high levels in brain and placenta and is also found in skeletal muscle (mainly slow twitch fibers) and sperm. Because both GLUT1 and GLUT 3 have a low Km for glucose and transport glucose even when circulating levels are low, these two glucose transporters appear to be responsible for basal glucose transport in most tissues of the body.


Glycolysis


At the cellular level, the breakdown of glucose for energy can be divided into two major pathways based on the intracellular location of the enzymatic machinery involved and on the ability of different cell types to perform the enzymatic reactions. The first of these pathways is glycolysis, the anaerobic breakdown of glucose to pyruvate. The enzymes involved in glycolysis are present in the cytosol of all cell types. The second pathway is the citric acid cycle, in which acetyl-CoA is completely oxidized to CO2 and H2O. Flux through the citric acid cycle and most of the ATP production from aerobic metabolism of glucose requires donation of electrons to the mitochondrial electron transport chain and ultimately to molecular oxygen as the terminal electron acceptor. Because the citric acid cycle and electron transport both occur in mitochondria, the aerobic oxidation of glucose only occurs in cells that possess mitochondria. Glycolysis and the citric acid cycle are linked by the pyruvate dehydrogenase reaction, which also takes place in the mitochondria of the cell. As a result of glycolysis, the pyruvate dehydrogenase reaction, and the citric acid cycle, energy is conserved in the chemical form of ATP, with ATP synthesis occurring both by substrate-level phosphorylation and by electron transport linked to oxidative phosphorylation.


The series of enzymatic reactions that together constitute the glycolytic pathway convert one 6-carbon molecule of glucose to two 3-carbon molecules of pyruvate. All cells of the human body can catabolize glucose to this extent. The metabolic fate of pyruvate, however, is variable and depends on the cell type and the availability of oxygen. When pyruvate cannot be oxidized due to lack of mitochondria or oxygen, pyruvae is reduced to lactate. Some tissues such as red blood cells produce lactate from glucose even under aerobic conditions because of their lack of mitochondria. White or glycolytic muscle fibers have a limited blood supply and a low abundance of mitochondria and are dependent on anaerobic glycolysis for ATP production during intense work. However, most tissues, under aerobic conditions, can oxidize pyruvate to acetyl-CoA and CO2 via the pyruvate dehydrogenase reaction in the mitochondria, followed by complete oxidation of acetyl-CoA to CO2 and H2O via the citric acid cycle coupled to electron transport/oxidative phosphorylation.


The series of enzymatic reactions that make up the glycolytic pathway are subdivided into two stages, as shown in Figure 12-4: (1) the priming of glucose, which requires ATP expenditure to generate phosphorylated intermediates; and (2) the production of reducing equivalents and the synthesis of ATP. The enzymes that catalyze the reactions of glycolysis are present in the cell cytosol, organized into multienzyme complexes that function together to channel the intermediates from one enzyme to another so that they do not become diluted in the cytosol. The glycolytic enzymes are associated with cellular structures such as actin filaments, microtubules, or the outer membranes of mitochondria (Lehninger et al., 1993).


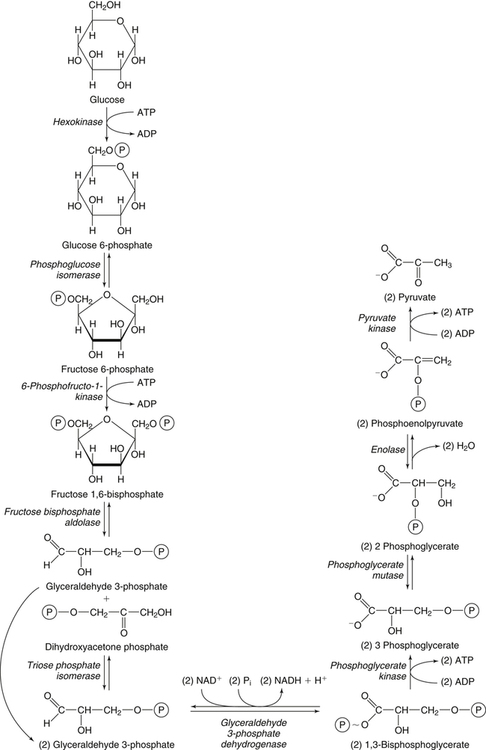
Initial Steps of Glycolysis: The Priming of Glucose


The series of enzymatic reactions that make up glycolysis begins with the substrate glucose, which enters the cell by carrier-mediated transport, or with glucose 6-phosphate, which is generated from glycogen degradation. For glucose that is transported into the cell, glucose is rapidly phosphorylated to glucose 6-phosphate in the following reaction:


Glucose+ATP Mg2+Glucose 6Phosphate+ADP


image

It should be noted that glucose 6-phosphate from glycogen does not require the hexokinase reaction. In skeletal muscle, glucose 6-phosphate from glycogen breakdown is a major substrate for glycolysis.


The mechanism of glucose phosphorylation involves the transfer of the γ phosphate from ATP to the C6 of glucose. This essentially irreversible reaction sequesters glucose within the cell because the phosphorylated form of glucose does not readily cross the plasma membrane. This phosphorylation reaction is catalyzed by hexokinase in most cell types and by glucokinase (hexokinase IV) in liver cells and pancreatic beta cells. In all cells, the product of this reaction, glucose 6-phosphate, can be broken down in the subsequent enzymatic steps of the glycolytic pathway. However, under anabolic conditions the production of glucose 6-phosphate is also the first step in the addition of glucose to the glucose polymer, glycogen, which is synthesized and stored mainly in liver and muscle tissue. In addition to glycolysis and glycogen synthesis, glucose 6-phosphate is also metabolized by the pentose phosphate pathway. This pathway provides cells with reducing equivalents in the form of NADPH and with ribose 5-phosphate for nucleotide synthesis.


Hexokinase, which catalyzes the initial phosphorylation of glucose when it enters the cell, has different tissue-specific isoenzyme forms. Isoenzymes are different molecular forms of an enzyme that catalyze the same reaction but differ in kinetics, regulatory mechanisms, and/or tissue localization. In humans, hexokinase I predominates in skeletal muscle and other extrahepatic tissues. Hexokinase I has a low Km for glucose (less than 0.1 mmol/L) relative to blood glucose concentrations (4 to 6 mmol/L). (The Km is the concentration of substrate at which the enzymatic reaction occurs at half-maximal velocity or, in other words, the concentration of substrate at which the enzyme is half-saturated with substrate.) In skeletal muscle, the activity of hexokinase I is coordinated with that of the low Km glucose carrier GLUT4, which specifically transports glucose in the direction of its concentration gradient in response to insulin stimulation. Conversion of glucose to glucose 6-phosphate by hexokinase I maintains low intracellular glucose levels to favor glucose entry. However, hexokinase I is allosterically inhibited by its product, glucose 6-phosphate. This negative feedback ensures that glucose 6-phosphate does not build up in the cell. Thus the combined actions of GLUT4 and hexokinase I maintain a balance between glucose uptake and glucose phosphorylation.


Glucokinase (hexokinase IV), on the other hand, is the major hexokinase isoform in liver parenchymal cells and in the pancreatic beta cells. In contrast to hexokinase I, glucokinase has a low affinity for glucose, with a Km of approximately 10 mM. In addition, glucokinase is not inhibited by glucose 6-phosphate. The activity of glucokinase is linked to that of the high Km glucose transporter GLUT2, which is the major glucose carrier in liver cells and pancreatic beta cells. Because GLUT2 and glucokinase are not saturated at physiological glucose concentrations and because glucokinase is not inhibited by its product glucose 6-phosphate, they are able to respond to marked changes in blood glucose concentration. Thus GLUT2 and glucokinase in liver and the pancreatic beta cells allow uptake of glucose in proportion to its plasma concentration and the rapid conversion of this glucose to glucose 6-phosphate when blood glucose concentrations are elevated (e.g., after a carbohydrate-containing meal). Hepatocytes and pancreatic beta cells differentially regulate expression of the glucokinase gene by use of different promoters, different transcription start sites, and alternative splicing to generate glucokinase isoforms that have different N-terminal sequences (Magnuson and Jetton, 1993; Postic et al., 2001). Use of different gene promoters allows regulation of liver glucokinase in response to insulin and glucagon while pancreatic glucokinase is regulated in response to blood glucose concentration. This allows the liver to maintain blood glucose levels in the normal physiological range and the pancreas to sense elevations in blood glucose concentrations and respond with insulin secretion


The second enzymatic reaction in glycolysis is the isomerization of glucose 6-phosphate (an aldose) to fructose 6-phosphate (a ketose), catalyzed by phosphoglucose isomerase.


Glucose 6PhosphateMg2+Fructose 6Phosphate


image

In this reaction, there is an intramolecular shift of a hydrogen atom, changing the location of the double bond. Phosphoglucose isomerase functions close to equilibrium, and therefore the reaction is reversible under intracellular conditions.


6-Phosphofructo-1-kinase catalyzes the next irreversible step in the glycolytic pathway, the phosphorylation of fructose 6-phosphate to fructose 1,6-bisphosphate:


Fructose 6Phosphate+ATPMg2+Fructose 1,6Bisphosphate+ADP


image

The 6-phosphofructo-1-kinase reaction utilizes a second molecule of ATP and is the first committed step in glycolysis. Unlike glucose 6-phosphate, fructose 1,6-bisphosphate cannot be used directly as substrate for alternative pathways such as glycogen synthesis. The 6-phosphofructo-1-kinase reaction is highly regulated by allosteric modifiers and is one of the major determinants of the rate of glycolytic conversion of glucose to pyruvate. It is also regulated by changes in gene expression. In humans, there are three isoenzymes of 6-phosphofructo-1-kinase, each encoded by a separate gene. Hepatic mRNA levels of the 6-phosphofructo-1-kinase gene (PFK) are increased in response to carbohydrate refeeding after a fast (Granner and Pilkis, 1990), but in skeletal muscle there are no changes in expression of the PFK gene with either diabetes, insulin treatment, or exercise (Vestergaard, 1999).


The next reaction involves the division of the 6-carbon sugar diphosphate, fructose 1,6-bisphosphate, to two 3-carbon phosphorylated intermediates. The aldol cleavage reaction is catalyzed by aldolase as follows:


Fructose 1,6bisphosphateDihydroxyacetone phosphate+Glyceraldehyde-3phosphate


image

Glyceraldehyde 3-phosphate is in the direct path of glycolysis, but dihydroxyacetone phosphate is not. Dihydroxyacetone phosphate is isomerized to glyceraldehyde 3-phosphate via the action of triose-phosphate isomerase. The net result of the aldolase and triose-phosphate isomerase reactions is the production of two molecules of glyceraldehyde 3-phosphate. The series of reactions that converts one molecule of glucose to two molecules of glyceraldehyde 3-phosphate constitutes the first phase of glycolysis in which the chemical energy of ATP is used to generate phosphorylated intermediates. The dihydroxyacetone phosphate produced by the aldolase reaction may also be reduced to glycerol 3-phosphate and used for synthesis of glycerolipids; this is a particularly important source of glycerol 3-phosphate for triacylglycerol synthesis in small intestinal enterocytes and in adipocytes.


Generation of Reducing Equivalents and Substrate-Level Synthesis of ATP


The second stage of glycolysis generates reducing equivalents and ATP. Reducing equivalents in the form NADH are produced by the reaction catalyzed by glyceraldehyde 3-phosphate dehydrogenase:


Glyceraldehyde 3phosphate+NAD++Pi1,3Bisphosphoglycerate+NADH+H+


image

This reaction incorporates inorganic phosphate (Pi) to produce a high-energy phosphate bond in 1,3-bisphosphoglycerate. The second product of the reaction, NADH, provides reducing equivalents for the energy conversion of electron transport and production of ATP by oxidative phosphorylation. This is the only glycolytic reaction that generates reducing equivalents for electron transport. It is important to note that the coenzyme NAD+ is present in limited amounts in the cytosol. For this reason, the NAD+ used in the glyceraldehyde 3-phosphate reaction needs to be regenerated in the cytosolic compartment so that NAD+ availability does not limit glycolysis.


The acyl-phosphate bond of 1,3-bisphosphoglycerate has a high-energy phosphoryl transfer potential that is used to generate ATP in the next reaction of glycolysis. This is the conversion of 1,3-bisphosphoglycerate to 3-phosphoglycerate:


1,3Bisphosphoglycerate+ADP3Phosphoglycerate+ATP


image

The enzyme that catalyzes this reaction is phosphoglycerate kinase. This is the first reaction in glycolysis that generates ATP. The formation of ATP by transfer of the phosphate group from 1,3-bisphosphoglycerate to ADP is a substrate-level phosphorylation.


The next step in the glycolytic pathway is the conversion of 3-phosphoglycerate to 2-phosphoglycerate, catalyzed by phosphoglycerate mutase. The mechanism of this enzymatic reaction is complex and involves a phosphoenzyme intermediate. The end products of this reaction are 2-phosphoglycerate and the regenerated phosphoenzyme. The overall series of reactions can be summarized as follows:


Enzymephosphate+3PhosphoglycerateEnzyme+ 2,3Bisphosphoglycerate


image

Enzyme+2,3-BisphosphoglycerateEnzyme-phosphate+2-Phosphoglycerate


image

A second glycolytic intermediate with a high-energy phosphate bond is generated when 2-phosphoglycerate is converted to phosphoenolpyruvate via a dehydration reaction catalyzed by enolase.


2-PhosphoglyceratePhosphoenolpyruvate+H2O


image

The phosphoenolpyruvate generated by the enolase reaction is substrate for the last reaction of glycolysis, the conversion of phosphoenolpyruvate to pyruvate with the generation of ATP.


Phosphoenolpyruvate+ADPMg 2+, K+Pyruvate+ATP


image

This reaction is catalyzed by pyruvate kinase and is the second substrate-level phosphorylation step that occurs in glycolysis. The pyruvate kinase reaction is essentially irreversible under intracellular conditions. This enzyme is highly regulated by allosteric and covalent modification, much like 6-phosphofructose-1-kinase, as is discussed in subsequent text of this chapter.


Further Metabolism of Pyruvate


Pyruvate produced by glycolysis can be metabolized in different ways, depending upon the availability of oxygen and the metabolic state of the cell. Pyruvate may enter the mitochondrion where it is converted to acetyl-CoA in a complex series of reactions catalyzed by the multienzyme pyruvate dehydrogenase complex. Acetyl-CoA so produced can enter the citric acid cycle for complete oxidation to CO2 and H2O, or it can exit the mitochondria as citrate and be used for fatty acid or sterol synthesis in certain cell types (see Chapter 16 for a discussion of de novo lipogenesis from glucose). In the absence of sufficient oxygen or in cells lacking mitochondria, pyruvate has a different fate; it is reduced to lactate by the cytosolic enzyme lactate dehydrogenase.


Pyruvate+NADH+H+Lactate+NAD+


image

Metabolism of glucose by this anaerobic pathway may occur in active skeletal muscle, and lactate can build up when molecular oxygen becomes insufficient to meet the metabolic need for aerobic metabolism. Pyruvate is also reduced to lactate in red blood cells, which do not have mitochondria. The reduction of pyruvate to lactate generates NAD+ from NADH. This replaces the NAD+ that was reduced in the glyceraldehyde 3-phosphate dehydrogenase reaction of glycolysis. Therefore these two reactions balance the utilization and regeneration of NAD+ so that glycolysis can continue. Per glucose molecule, two molecules of NAD+ are reduced in the glyceraldehyde 3-phosphate dehydrogenase reaction, and two molecules of NAD+ are regenerated in the reduction of pyruvate to lactate. The lactate formed in this process can be recycled to the liver to regenerate glucose via gluconeogenesis. Heart muscle is also able to take up lactate and use it as a fuel for ATP production. Under conditions of heavy physical activity, the heart may take up lactate released by exercising skeletal muscle and use it as a fuel.


In the presence of sufficient molecular oxygen and in cells with mitochondria, reducing equivalents (NADH + H+) produced by the glyceraldehyde 3-phosphate dehydrogenase reaction can be shuttled to the mitochondria by the reduction of metabolic intermediates in the cytosol, regenerating NAD+ in this compartment. The reduced intermediate is shuttled across the inner mitochondrial membrane with subsequent oxidation, thereby regenerating NADH + H+ from NAD+ in the mitochondria. NADH in the mitochondria is an electron donor, transferring reducing equivalents to Complex I (NADH dehydrogenase complex) in the series of oxidation–reduction reactions of electron transport (see Chapter 21, Figure 21-4). Under these conditions, the reduction of pyruvate to lactate is not required for the regeneration of NAD+ in the cytosol.


ATP Equivalents Produced by Glycolysis


The total ATP produced from the reactions of glycolysis can be calculated. In this pathway, one molecule of glucose is converted to two molecules of pyruvate. Two molecules of ATP are used to prime glucose; however, four molecules of ATP are produced by substrate-level phosphorylation in the second phase, yielding a net increase of two molecules of ATP. Because one less ATP is consumed when glucose 6-phosphate from glycogen breakdown is the initial substrate for glycolysis, a net of three molecules of ATP are produced per glucose moiety from glycogen that undergoes glycolysis. In addition, two molecules of NADH are produced in the glyceraldehyde 3-phosphate dehydrogenase reaction in the cytosol of the cell. The energy gain can be summarized as follows:


Glucose+2 ATP+2 NAD++4 ADP+2 Pi2 Pyruvate+2 ADP+2 NADH+2 H++4 ATP+2 H2O


image

Stay updated, free articles. Join our Telegram channel

Feb 26, 2017 | Posted by in PHARMACY | Comments Off on Carbohydrate Metabolism: Synthesis and Oxidation

Full access? Get Clinical Tree

Get Clinical Tree app for offline access