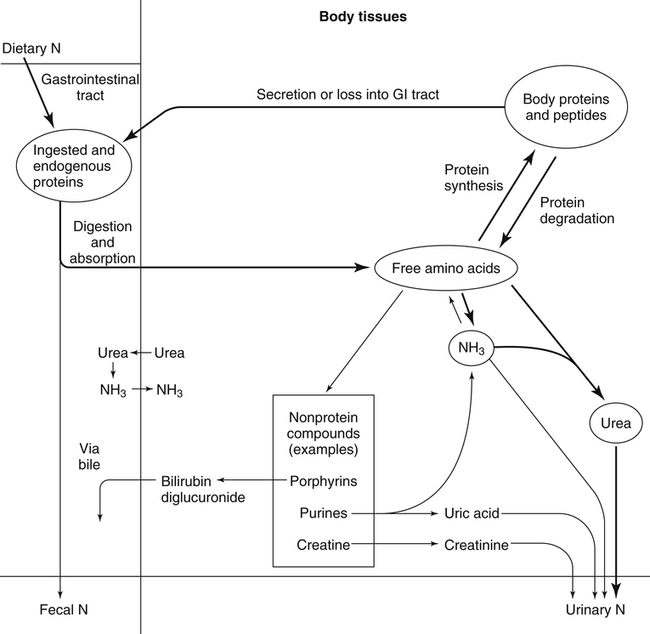
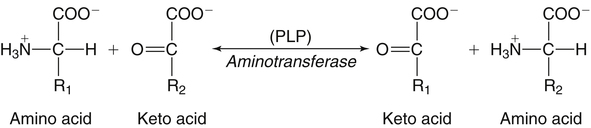
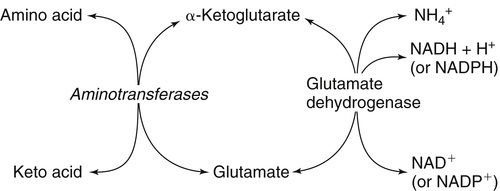
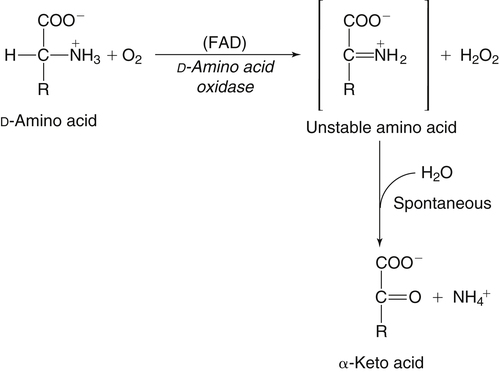
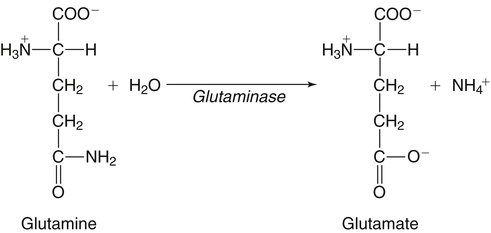
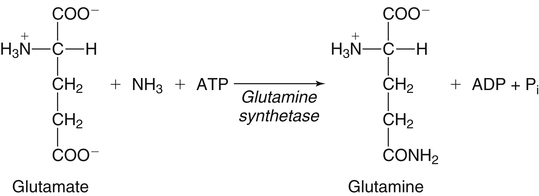
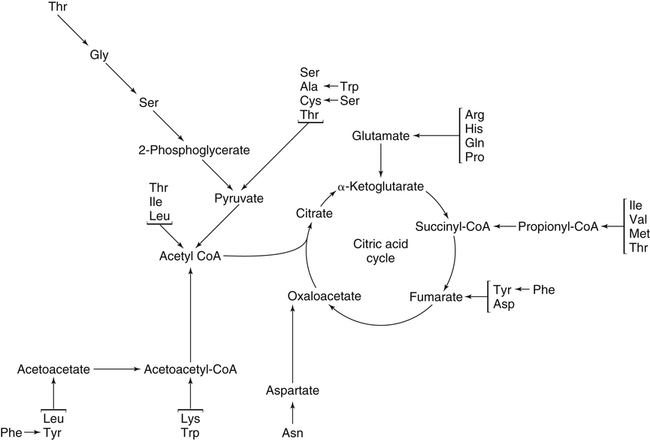
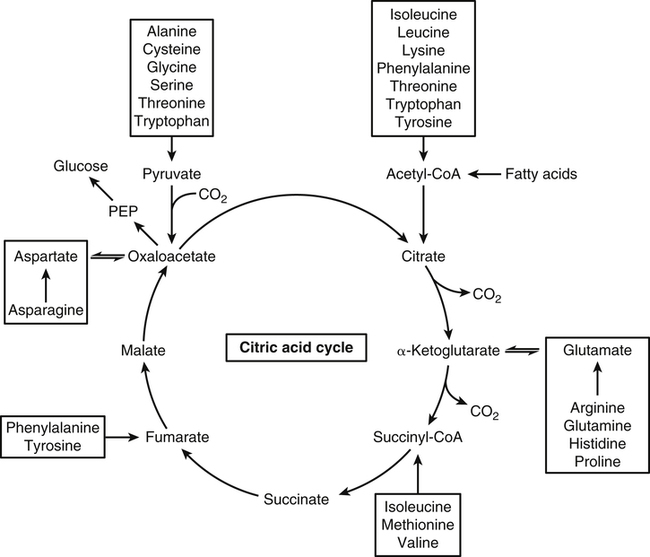
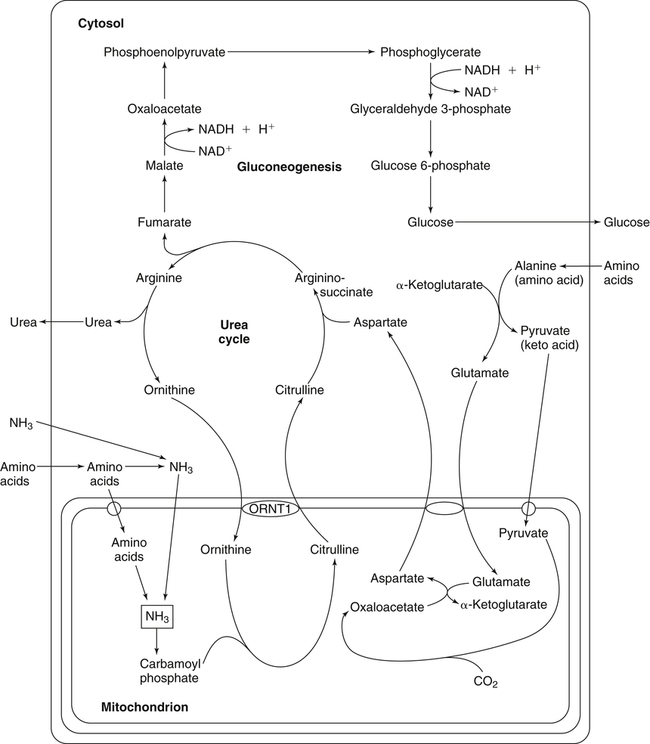
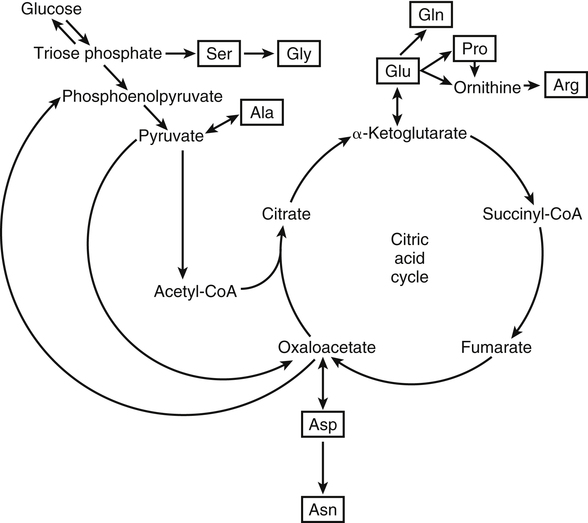
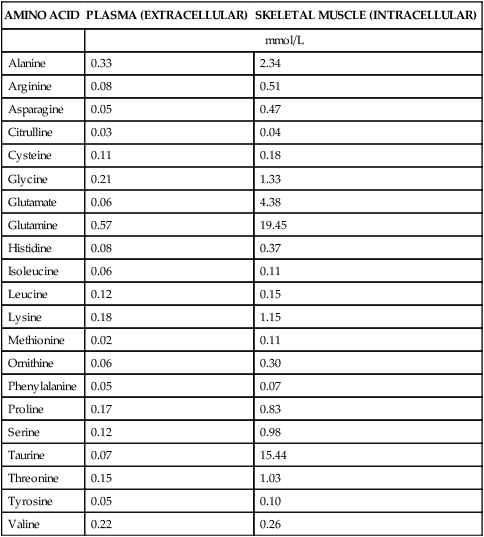
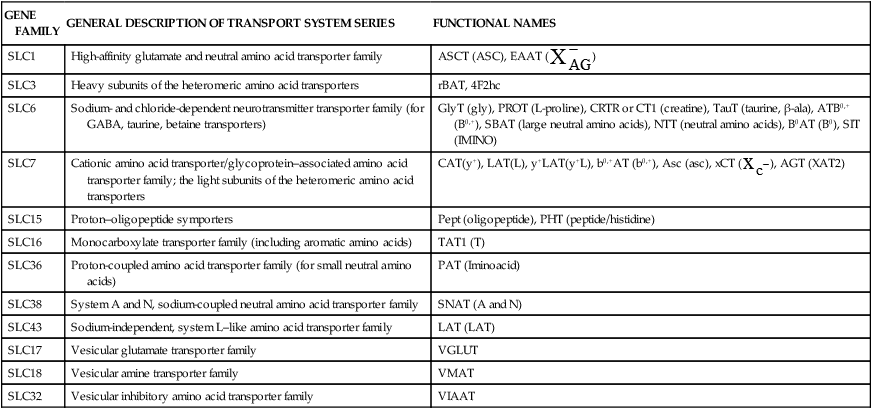
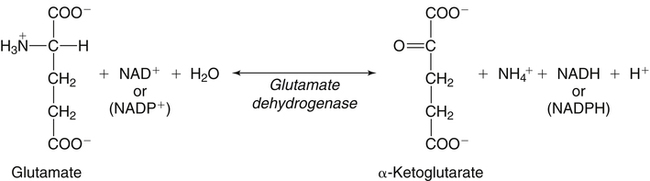
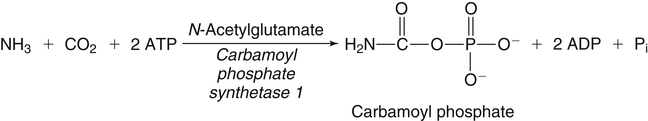
The 20 amino acids required for protein synthesis include some for which the carbon chains cannot be synthesized in the body (essential, or indispensable, amino acids) and others for which the carbon skeletons can be made from common intermediates in metabolism (nonessential, or dispensable, amino acids). The nutritional requirement for protein is actually a requirement for the indispensable (essential) amino acids and a source of nitrogen for synthesis of dispensable (nonessential) amino acids, as is discussed in more detail in Chapter 15. Most of the nitrogen for the synthesis of dispensable amino acids must be provided by α-amino groups of amino acids, because the body has a limited ability to incorporate inorganic nitrogen (i.e., NH3, or NH4+) into amino acids. The indispensable amino acids for humans include leucine, isoleucine, valine, lysine, threonine, tryptophan, phenylalanine, methionine, and histidine. Tyrosine and cysteine are termed semiessential because they can be synthesized only if their indispensable amino acid precursors (phenylalanine and methionine, respectively) are provided. Many, but not all, of these indispensable amino acids can be made from their keto acid or hydroxy acid analogs if these are fed instead of the amino acids; this is possible because of widespread transamination reactions in mammalian tissues that convert keto acids to the respective amino acids. In practice, food proteins provide all 20 amino acids, but the body can adjust the proportions by transferring nitrogen to nonessential carbon skeletons and by catabolizing excess amino acids. The reactions involved in moving amino groups among carbon skeletons, removing amino groups for nitrogen excretion and using the carbon skeleton for gluconeogenesis and other functions, and using amino acids for synthesis of essential compounds such as neurotransmitters are described in this chapter. An overview of amino acid metabolism is shown in Figure 14-1. The free amino acid pool is shown in the center of this figure; free amino acid pool is the term used to describe the amino acids that exist in the body in free form at any moment and to distinguish these free amino acids from those that exist in peptide or polypeptide/protein form. The size of this free amino acid pool in human adults is approximately 150 g, and the flux of amino acids through this pool typically amounts to 400 to 500 g per day (Jungas et al., 1992; Bergstrom et al., 1974). As can be seen by arrows leading toward the free amino acid pool (see Figure 14-1), there are three major sources of amino acids, as follows: 1. Digestion of endogenous proteins and peptides secreted or sloughed off into the gastrointestinal tract and absorption of the resulting amino acids into the circulation (~75 g/day) 2. Dietary protein which is digested in the gastrointestinal tract and absorption of the resulting amino acids into the circulation (~100 g/day depending on diet) 3. Intracellular protein turnover or degradation (~230 g/day) These processes are discussed in Chapters 9 and 13. The utilization of amino acids for protein synthesis was discussed in Chapter 13. Catabolism of amino acids with the use of their carbon chains as fuels is described in the present chapter. These two fates of amino acids account for most of the amino acids that move through the amino acid pool. Although only small quantities of amino acids are involved, the very important role of amino acids in the synthesis of some other nonprotein compounds with specialized functions is also described in this chapter. The considerable chemical diversity of amino acid side chains affords much greater metabolic versatility than exists for the other macronutrients. It is hardly surprising that amino acids or their metabolic derivatives play such an important role in the regulation of cell function (e.g., as neurotransmitters). Similarly, it may be noted that three of the four known gaseous signaling molecules (ethylene in plants, nitric oxide, and hydrogen sulfide, but not carbon dioxide) are derived from amino acids or their derivatives. Synthesis of dispensable amino acids, a process that is often simply the reverse of their catabolism and that involves catabolism of another amino acid to provide the α-amino group, is also described. Free amino acids are found, at varying concentrations, in extracellular fluids (e.g., plasma, interstitial fluid, and cerebrospinal fluid) and inside cells. Within cells, amino acids are compartmentalized and concentrations vary between different compartments (e.g., cytosol, mitochondria, lysosomes). Table 14-1 shows amino acid concentrations in human muscle and plasma. It is evident there is considerable variability between the concentrations of individual amino acids. For example, glutamine concentration in muscle is almost 20 mmol/L, whereas that of tyrosine is only 0.1 mmol/L. In addition, the intracellular/extracellular concentration gradient can be quite high for some amino acids; for example, the difference is about seventyfold for glutamate. Finally, it should be noted that taurine, a nonprotein amino acid, is among those with the highest intracellular concentration, and it displays a more than 200-fold concentration gradient between muscle and plasma. Establishment and maintenance of such intracellular pools and gradients require amino acid transporters, both at the plasma membrane and in intracellular membranes. Indeed, Christensen (1990) has pointed out that, in addition to the tissue-specific expression of metabolic enzymes, interorgan fluxes of amino acids require the tissue-specific expression of amino acid transporters. TABLE 14-1 Concentrations of Free Amino Acids in Human Muscle and Plasma Values are mean values for 21 healthy subjects who were studied after an overnight fast. Data from Bergstrom, J., Furst, P., Noree, L.-O., & Vinnars, E. (1974). Intracellular free amino acid concentration in human muscle tissue. Journal of Applied Physiology, 36, 693–697. As discussed in Chapter 9, amino acids taken up from the gastrointestinal tract are released by intestinal mucosal cells into the portal circulation. Distinct transport proteins with overlapping specificities are responsible for the uptake and release of amino acids from cells. A number of transport systems for amino acids have been categorized in mammalian cells (Hyde et al., 2003; Christensen, 1990) as summarized in Table 14-2. The Human Genome Project has classified 298 known solute carrier (SLC) systems into 43 families of proteins, and amino acid carriers fall into a number of these different families (see Table 14-2) (Hediger et al., 2004). Major systems for the transport of small aliphatic amino acids include Na+-dependent system A (SLC38A1, SLC38A2, and SLC38A3) and ASC (SLC7A10), and the Na+-independent system L (SLC7A5 and SLC7A8). Other, more restricted systems transport glutamine, acidic amino acids, basic amino acids, and imino acids. In general, the amino acid transport systems carry several amino acids across the cell membrane, and the transport of a particular amino acid is subject to competitive inhibition by other amino acids that share the same transport system. TABLE 14-2 HUGO, Human Genome Organization; SLC, solute carrier. Data from Hediger, M. A., Romero, M. F., Peng, J.-B., Rolfs, A., Takanaga, H., & Bruford, E. A. (2004). The ABCs of solute carriers: Physiological, pathological and therapeutic implications of human membrane transport proteins. Pflügers Archive: European Journal of Physiology, 447, 465–468; Hyde R., Taylor, P. M., & Hundal, H. S. (2003). Amino acid transporters: Roles in amino acid sensing and signaling in animal cells. The Biochemical Journal, 373, 1–18. A complete list is available at www.bioparadigms.org/slc/menu.asp. Amino acid transport is subject to short- and long-term regulation. Although many of the amino acid transporters have now been identified (Hyde et al., 2003), relatively little is known about their regulation. System A has been studied most extensively, particularly in hepatocytes and hepatoma cells, in which it is subject to a variety of regulatory signals. System A activity is rapidly increased in response to glucagon or epidermal growth factor (EGF) by mechanisms that involve hyperpolarization of the cell membrane by changes in Na+/H+ exchange. In addition, system A is sensitive to pH changes. In response to acidosis, there is evidence that amino acid transport into the liver may be decreased, with a resultant decrease in urea synthesis (Boon et al., 1994). Dipeptides and tripeptides are transported into cells by two proton-linked carriers: Pept1 (SLC15A1), found in the intestine and possibly the kidney, and Pept2 (SLC15A2), expressed in kidney, brain, mammary gland, and lung (Pinsonneault et al., 2004; Adibi, 2003). In addition, urea is transported by two distinct urea transporters, UT1 (SLC14A1) and UT2 (SLC14A2), which are found in many tissues and highly expressed in the kidney, where they play an important role in concentrating urine. Several genes coding for amino acid transporters have been shown to contain amino acid response elements (AAREs), which are responsible for transcriptional upregulation of the expression of these genes under conditions of amino acid starvation (Palii et al., 2004; Fernandez et al., 2003). These include the sodium-coupled neutral amino acid transporter system A gene (SNAT2, or SLC38A2), the arginine/lysine transporter (y+) gene (CAT-1, or SLC7A1), and the cystine/glutamate transporter ( Potential Role of the Microbiome in the Nitrogen Economy of the Body The human gastrointestinal tract is home to some 1014 microorganisms, ten times the number of somatic cells in our bodies. The composite bacterial genome, the microbiome, contains at least 100 times as many genes as the human genome. Many of the genes are involved in bacterial housekeeping, whereas others are specific to life in the gut (e.g., adhesion to the mucosal layer). The microbiota and their human host form what is referred to as a superorganism because their metabolic functions are integrated. It has proved difficult to study the various functions of individual members of the microbiota, because some 80% of its members cannot easily be cultured, separately or in combination. Many of the bacteria, especially those in the colon, are located in the lumen and can be sampled in the feces. Some, however, are associated with the mucus layer, especially in the small intestine, and cannot be easily sampled in humans (Wikoff et al., 2009). Although many species found in the gastrointestinal tract have not been identified elsewhere, these unique species belong to well-known phyla, mainly Bacteroidetes and Firmicutes. Within these phyla, the composition of the microbiota can vary depending on host genetics, sex, age, diet, and antibiotic treatment. For example, obese people or animals tend to have higher levels of Firmicutes and lower levels of Bacteroidetes compared with their lean counterparts (Bäckhed, 2009). It is known that germ-free animals need a higher energy content in their diet than conventional animals because some members of the microbiota can catabolize normally unusable energy sources (e.g., various fibers and resistant starch) to produce short-chain fatty acids that can be absorbed from the colon. The microbiota also appears to be involved in maturation of the gastrointestinal tract and immune function early in life. It is also well established that urea synthesized in the liver can reach the intestine where it can be catabolized by the microbiota. Some of the ammonia that results is absorbed and returned to the liver by the portal circulation; some of this ammonia can be incorporated into amino acids (via the glutamate dehydrogenase and glutamine synthetase reactions) or back into urea in the liver (Jackson, 1995). Whether the microbiota can mitigate changes in dietary amino acid intake (e.g., catabolizing some of the excess amino acids in a high-protein diet or synthesizing and releasing amino acids when protein intake is low) is not known. The question of whether changes in microbiota composition and function may explain differences in the nitrogen economy of different people remains to be answered. Clearly, bacteria can respond to changes in amino acid availability to induce degradative or synthetic enzymes; but whether these are used solely by the bacteria themselves for their growth and proliferation, with eventual excretion as bacterial mass in the feces, or whether synthesis or degradation of amino acids by the microbiota affects the pool of amino acids entering the host’s circulation is not known (Metges et al., 2006). urea cycle and gluconeogenesis, pathways that occur partly in the mitochondria and partly in the cytosol. The mitochondrial ornithine/citrulline transporter (ORNT1, encoded by SLC25A15) is required for transport of citrulline out of the mitochondria in exchange for transport of ornithine into the mitochondria as a fundamental part of the urea cycle. Another example of transport of amino acids across membranes of intracellular organelles is the transport of amino acids produced by proteolysis out of lysosomes. Mutations of the genes encoding the subunits of the Circulating branched-chain amino acid levels increase markedly after a protein-rich meal. It appears that this postprandial increase in the levels of the branched-chain amino acids, especially leucine, is an anabolic signal, increasing net protein synthesis. Both an increase in protein synthesis and a decrease in intracellular proteolysis appear to result from activation of the mammalian target of rapamycin complex 1 (mTORC1), a serine/threonine protein kinase that is known to be activated by insulin and IGF-1 as well as by amino acids. Although the receptors and signaling pathways for insulin and growth factors have been reasonably well elucidated, the precise mechanism or protein involved in sensing leucine (and certain other amino acids) has not been identified. The effect of leucine on protein synthesis has been best studied in skeletal muscle. Leucine activates mTORC1 and, as a consequence, the downstream targets of mTORC1, S6K1 (ribosomal protein S6 kinase) and 4E-BP (eukaryotic initiation factor 4E binding protein), are phosphorylated. The phosphorylation of these and other mTORC1 targets facilitates the assembly of the initiation complex and also stimulates other aspects of protein synthesis (Proud, 2007). An important feature of this regulatory mechanism is that it is not limited to a single messenger RNA (mRNA); rather, it enhances the synthesis of a broad range of proteins and therefore plays an important role in whole-body protein metabolism (Kimball and Jefferson, 2006). Leucine and other amino acids also act, via mTOR, to decrease intracellular proteolysis. This has been best studied for autophagic hepatic proteolysis, where a mixture of leucine, phenylalanine, and tyrosine are most effective in reducing protein degradation by autophagy (Meijer, 2008). Two Inheritable Diseases of Cystine Transport Children born with cystinosis appear normal at birth, but signs of the renal tubular Fanconi syndrome (e.g., failure of the kidney to reabsorb small molecules properly) develop, usually when the child is between 6 and 12 months of age. The renal glomerular damage progresses and children typically require dialysis or transplantation by 6 to 12 years of age. Plasma cystine concentrations and the intestinal absorption of cystine are normal in individuals with cystinosis, unlike in the disorder known as cystinuria (see later and Chapter 9). Urinary cystine levels are slightly elevated due to the renal damage, but the cystine levels are no more elevated than those of other amino acids. Damage to the cornea and the thyroid gland occur at a later age than the renal damage. The effects of leucine on protein synthesis and degradation are attenuated by rapamycin, an inhibitor of mTORC1. Cells also display a coordinated response to intracellular amino acid deprivation, the GCN2 (general control nonderepressible) pathway. The physiologically appropriate response to amino acid limitation is to suppress global mRNA translation while permitting translation of a specific subset of genes that are required for ameliorating the amino acid depletion. In this case the intracellular detection of amino acid deprivation is indirect, via the levels of uncharged transfer RNAs (tRNAs) that increase with amino acid limitation. The accumulation of uncharged tRNAs activates GCN2, a protein kinase that in turn phosphorylates and inactivates the α subunit of eukaryotic initiation factor 2 (eIF2α). This in turn suppresses global mRNA translation but permits translation of a specific transcription factor, ATF4 (activating transcription factor 4), which acts in the nucleus to increase expression of genes for amino acid transport and aminoacyl tRNA synthesis. In this way global mRNA translation is suppressed while there is increased expression of genes that may increase cellular amino acid levels and permit synthesis of essential proteins (Kilberg et al., 2005). Recent work has clearly established that the umami taste is one of the fundamental tastes, in addition to the sweet, sour, salty, and bitter tastes. Full activation of umami taste receptors requires the interaction of two coagonists with the umami receptor, glutamate (in the form of its sodium salt) and a nucleotide monophosphate (GMP or IMP). The umami taste brought about by either of these agonists alone is rather weak, but there is a remarkable synergy between them, which may be accounted for by the finding that GMP greatly enhances glutamate binding to the taste receptor. Many protein-rich foods are rich in both glutamate and these nucleotides and it has been proposed that the umami taste permits animals to recognize protein food sources. However, this attractive hypothesis has not been definitively established (Beauchamp, 2009). Some general types of reactions that are involved in the movement of amino groups and fixation of inorganic nitrogen (NH3 or NH4+) are described first, followed by a summary of the fate of the carbon skeletons released by amino acid catabolism. This is followed by a discussion of specific metabolic pathways for each amino acid or related group of amino acids. Finally, the pathways for excretion of nitrogen from the body are summarized. The reader should also refer to Chapter 25 for a discussion of the roles vitamin B6, vitamin B12, and folate coenzymes play in many of the reactions of amino acid metabolism. The α-amino group may be moved from one carbon chain to another by transamination reactions to form the respective amino and keto acids. Transamination is the most general route for removing nitrogen from an amino acid and transferring it to another carbon skeleton. The transfer of the amino group from an amino acid to a keto acid to form another amino acid is catalyzed by aminotransferases, which are pyridoxal 5′-phosphate (PLP)–dependent enzymes. The general reaction catalyzed by an aminotransferase is shown in Figure 14-2. Most physiologically important aminotransferases have a preferred amino acid/keto acid substrate and use α-ketoglutarate/glutamate as the counter keto acid/amino acid; an example is aspartate aminotransferase, which accepts aspartate or oxaloacetate as substrate and uses glutamate or α-ketoglutarate as cosubstrate. Alanine, aspartate, glutamate, tyrosine, serine, valine, isoleucine, and leucine are actively transaminated in human tissues. Histidine, phenylalanine, methionine, cysteine, glutamine, asparagine, threonine, and glycine also may undergo transamination in human tissues, but these amino acids are metabolized primarily by other types of reactions under normal physiological conditions. In contrast, lysine, proline, tryptophan, and arginine do not participate directly in transamination reactions in mammalian tissues; intermediates in the degradation pathways of lysine, proline, tryptophan, and arginine may, however, undergo transamination for transfer of the amino group. Because α-ketoglutarate is used widely as the acceptor of amino groups in transamination reactions, the α-amino groups of numerous amino acids are funneled through glutamate in the process of amino acid catabolism. Aspartate aminotransferase and alanine aminotransferase are widespread in tissues, and these enzymes allow the movement of amino groups between glutamate/α-ketoglutarate and aspartate/oxaloacetate or alanine/pyruvate. A limited number of reactions in the body are capable of direct deamination of amino acids to release ammonia and form a keto acid. The major reaction in the body in which α-amino groups are released as ammonia is catalyzed by glutamate dehydrogenase. As shown in Figure 14-3, glutamate dehydrogenase brings about the interconversion of glutamate with α-ketoglutarate and ammonia. Glutamate dehydrogenase is mitochondrial and exhibits high activity in liver, kidney cortex, and brain. The fates of the products released by glutamate dehydrogenase are tissue-specific. In liver, the ammonia is mainly incorporated into urea; in the kidney, it can be excreted as urinary ammonium; in the brain, the reaction favors glutamate formation in some cells and ammonia production in others; the ammonia is then incorporated into glutamine. Figure 14-4 shows the effect of combining an aminotransferase with glutamate dehydrogenase. Specific reactions in the metabolism of individual amino acids also give rise to free ammonia from the α-amino nitrogen. In particular, ammonia is released from histidine by histidine ammonia lyase (commonly called histidase), from methionine in the process of transsulfuration (in the reaction catalyzed by cystathionine γ-lyase, commonly called cystathionase), from glycine by the glycine cleavage system, and from serine or threonine by serine–threonine dehydratase. In some tissues that lack significant glutamate dehydrogenase activity, such as skeletal muscle, the purine nucleotide cycle can function to release ammonia from adenosine via adenosine deaminase, with the subsequent resynthesis of adenosine using nitrogen obtained from aspartate (Lowenstein, 1972). The net effect of this purine nucleotide cycle is the release of the amino group from aspartate (or indirectly from glutamate following transamination of glutamate with oxaloacetate to form aspartate) as ammonia and with salvage of the aspartate (or glutamate) carbon chain. L-Amino acid oxidase activity is very low in mammals and is likely of little importance in amino acid catabolism in humans. However, some foodstuffs contain small amounts of D-amino acids, and these appear to be degraded mainly by D-amino acid oxidase, which is expressed at high levels in the kidney (D’Aniello et al., 1993). The overall reaction catalyzed by amino acid oxidase is shown in Figure 14-5. D-Amino acid oxidase is located in peroxisomes; the occurrence of catalase in these organelles provides a means of detoxifying the hydrogen peroxide produced by D-amino acid oxidase. Once a keto acid is formed from a D-amino acid, the keto acid can be transaminated by an L-amino acid aminotransferase to form an L-amino acid, allowing some use of D-amino acid carbon chains. Glutamine and asparagine contain carboxamide groups, from which the amide nitrogen can be released by glutaminase or asparaginase. The reaction catalyzed by glutaminase is shown in Figure 14-6. The hydrolysis of glutamine to glutamate and ammonia occurs in many tissues and is catalyzed by phosphate-activated glutaminase, which is located in the mitochondria. In most cells, the liberated ammonia is released from the cell without further modification. The glutaminase of liver is a different isozyme from that found in most other tissues; in the liver, the ammonia generated by this reaction may be used by the carbamoyl phosphate synthetase 1 reaction and incorporated into urea. In a similar reaction catalyzed by asparaginase, asparagine is deamidated to yield aspartate plus ammonia. Transfer of the amide group from glutamine also plays an important role in synthetic reactions, including the synthesis of purine and pyrimidine nucleotides, NAD+, and amino sugars, as is discussed later in this chapter. Although most of the interconversions and metabolism of amino acids and other nitrogenous compounds within the body occur with organic forms of nitrogen, primarily amino and amide groups, some reactions can use ammonia. Glutamate dehydrogenase (see Figure 14-3), which was discussed as the mitochondrial enzyme responsible for release of α-amino nitrogen as ammonia, can also function in the reverse direction to incorporate ammonia into glutamate and hence into Functional Roles for D-Amino Acids The NMDA subtype of glutamate receptors plays a crucial role in synaptic plasticity and memory. The NMDA receptor is unique in that it requires glutamate and glycine as coagonists for activation. It is now appreciated that D-serine can activate at the glycine site, and it is thought that either glycine or D-serine may act as the coagonist in different situations (Boehning and Snyder, 2003). Mammalian brain, including human brain, contains a PLP-containing serine racemase that can convert L-serine to D-serine; this enzyme is found in astrocytes. The release of D-serine from these cells together with glutamate from presynaptic neurons results in the activation of NMDA receptors on postsynaptic neurons (Boehning and Snyder, 2003). It has been suggested that D-serine may be an effective therapy for patients suffering from schizophrenia (Yang and Svensson, 2008). D-Aspartate has also been found to occur at significant concentrations in a number of endocrine tissues, in particular the adrenal gland, although no function has yet been definitively ascribed to it (Furuchi and Homma, 2005). Clearly, the occurrence and possible physiological functions of D-amino acids represents a revolution in our thinking on amino acid metabolism as well as an intriguing research front. Could there be other D-amino acids that exert physiological functions but whose roles have not yet been uncovered? The recent identification of D-alanine in beta cells of the rat pancreas raises the possibility of a role for this amino acid in insulin secretion (Morikawa et al., 2007). Further research will be required to answer this and other questions regarding the physiological roles played by D-amino acids. the α-amino nitrogen pool. This enzyme catalyzes a near-equilibrium reaction in tissues with high activity (particularly the liver) and can operate to either incorporate ammonia into or release it from the α-amino acid pool. The direction of flux depends on the provision and removal of reactants. A second major ammonia-fixing reaction in the body is the synthesis of glutamine from glutamate and ammonia; this ATP-requiring reaction is catalyzed by glutamine synthetase and involves the addition of ammonia to form a carboxamide group from the γ-carboxyl group of glutamate (Figure 14-7). Glutamine, which has two nitrogenous groups, plays an important role in the transfer of nitrogen between cells and tissues, and glutamine synthetase activity is particularly high in muscle, adipose tissue, lung, brain, and the perivenous parenchymal cells of the liver (i.e., the cells closest to the terminal hepatic venules by which blood exits the liver; see Chapter 12, Figure 12-11). Although it does not result in incorporation of inorganic nitrogen into the amino acid pool (other than into the guanidinium group of arginine), carbamoyl phosphate synthetase 1 incorporates ammonia into carbamoyl phosphate for addition to ornithine for citrulline production (Figure 14-8). Carbamoyl phosphate synthetase 1 is found in the Glutamate Dehydrogenase and the Hyperinsulinism/Hyperammonemia Syndrome The importance of beta cell GDH in insulin secretion was highlighted by the discovery of the hyperinsulinism/hyperammonemia (HI/HA) syndrome, the second most common form of congenital hypoglycemia. GTP is an allosteric inhibitor of GDH. However, children with the HI/HA syndrome have a GDH mutation in which GTP is a much weaker inhibitor. The result is a gain-of-function mutation (i.e., one that results in a marked increase in GDH activity) (Stanley, 2009). Oxidation of both glutamate and glutamine is increased, because decreased glutamate levels will diminish the end-product inhibition of glutaminase and allow the glutaminase reaction to feed additional glutamate to GDH. The resulting increase in ATP/ADP causes hypersecretion of insulin with consequent hypoglycemia. This mechanism is entirely consistent with the clinical observations that ingestion of a protein-rich meal or an oral leucine challenge can provoke hypoglycemia in these patients. mitochondria of liver and small intestinal cells. N-Acetylglutamate is an obligatory activator for carbamoyl phosphate synthetase 1. Within the liver, this citrulline is produced as an integral part of the urea cycle, but in the intestine the citrulline may be released into the circulation for further metabolism to arginine in the kidney. The urea cycle is discussed more completely in a later section, “Nitrogen Excretion.” The points at which the carbon skeletons of various amino acids enter central pathways of catabolism are shown in Figure 14-9. The carbon skeletons of most amino acids are metabolized to glycolytic or citric acid cycle intermediates. Once the carbon skeleton of an amino acid enters central pathways of fuel metabolism, it may be further oxidized for energy or used for synthesis of other compounds, such as dispensable amino acids, glucose and glycogen, cholesterol, or triacylglycerols. It is often stated that amino acids are oxidized in the liver, which is the major site of amino acid catabolism and urea production. In addition, similar statements are made about amino acid catabolism in other tissues, such as glutamine oxidation in the small intestine or branched-chain amino acid oxidation in the muscle. Such statements seem to imply that the amino acids are completely oxidized to CO2 and H2O. Jungas and colleagues (1992) calculated that the amount of energy that would be produced by complete catabolism of amino acids at a rate equivalent to their net uptake by the liver would exceed the total energy used by the liver. Thus amino acids not used for protein or peptide synthesis in the liver are only partially oxidized within the liver, and the carbon skeletons are converted to glucose, glycogen, carbon chains of dispensable amino acids, lipids, and small amounts of ketone bodies for use by various tissues. Like the liver, many other tissues that utilize amino acids for energy do not completely catabolize them. Amino acids are quantitatively important as a fuel for the liver, small intestine, and other specialized cells, such as reticulocytes and cells of the immune system. It has been estimated that liver derives at least half of its ATP requirement from the partial oxidation of amino acids, and that the small intestinal jejunum may derive up to 80% of its fuel needs from amino acids. The intestinal jejunum uses glutamine, glutamate, and aspartate taken up from the luminal contents (digesta), as well as arterial glutamine (Reeds and Burrin, 2001). Although branched-chain amino acid oxidation occurs, at least partially, in muscle, nonprotein fuels are quantitatively much more important for muscle; muscle releases nitrogen primarily as glutamine and alanine (Darmaun and Dechelotte, 1991; Elia and Livesey, 1983). The kidneys consume large amounts of glutamine and significant but lesser amounts of glycine (Tizianello et al., 1982). The kidneys also release serine. The net uptake of amino acids by the liver (from the arterial and portal circulation) differs substantially from the dietary input. In particular, the uptakes of alanine and serine are high, whereas net uptakes of aspartate, glutamate, and the branched-chain amino acids are very low, and the liver may actually exhibit net glutamate release. Although the gastrointestinal tract extracts large amounts of glutamine from the circulation and also metabolizes dietary glutamine (and glutamate), there is evidence that human liver also takes up considerable amounts of glutamine (Watford, 2000; Elia, 1993; Felig et al., 1973). In the liver, amino acid catabolism is accompanied by both ureagenesis and gluconeogenesis, which is the synthesis of glucose from nonglucose precursors. Amino acids are an important source of carbon skeletons for gluconeogenesis. Although gluconeogenesis in the liver has traditionally been considered to operate predominantly during fasting or starvation in response to hypoglycemia and breakdown of muscle protein, it is now apparent that gluconeogenesis also functions postprandially while amino acids are being absorbed and processed. Estimates of glucose synthesis from amino acid carbon in the fed human are 50 to 60 g of glucose per 100 g of protein partially oxidized (Jungas et al., 1992). Therefore ureagenesis and gluconeogenesis can be viewed as operating together to produce glucose (or glycogen), urea, and CO2 from amino acids whenever the liver is processing amino acids. It is important to understand why many amino acids are glucogenic whereas others (i.e., leucine and lysine) are not. Although gluconeogenesis is a critical metabolic pathway, in some ways it may be regarded as a threat to the citric acid cycle. This is because gluconeogenesis withdraws a molecule of oxaloacetate from the cycle. If this continued to take place without any compensation, it is evident that the citric acid cycle would cease to function, with lethal consequences. Gluconeogenesis may occur only from those amino acids that, in their metabolism, produce intermediates of the cycle that may be converted to oxaloacetate, thus providing an additional cycle intermediate and permitting the withdrawal of a molecule for gluconeogenesis. The provision of new cycle intermediates is referred to as “anaplerosis.” The metabolism of leucine or lysine does not have an anaplerotic effect. Although carbon from these amino acids enters the citric acid cycle as acetyl-CoA, which reacts with oxaloacetate to produce citrate, this reaction does not expand the pool of cycle intermediates. One intermediate (oxaloacetate) is used up to produce another (citrate); it does not provide an additional molecule of cycle intermediate (Figure 14-10). A general overview of the processes by which the liver converts amino acid carbon chains to the “universal fuel” glucose and simultaneously incorporates the nitrogen groups into urea for excretion is shown in Figure 14-11. This scheme demonstrates that when a balanced mixture of amino acids is being oxidized, most of the glucogenic carbon will be carried out of the mitochondria as aspartate, which is also the immediate donor of one of the two nitrogens for urea synthesis. Jungas and colleagues (1992) detailed the processes involved in amino acid oxidation in liver and calculated that the partial oxidation of dietary amino acids provides sufficient energy to support the ATP requirements for synthesis of both glucose and urea; hence the liver does not depend on oxidation of fuels other than amino acids to provide ATP to support these processes. On the basis of the detailed calculations of Jungas and colleagues (1992), complete oxidation of 1 g of meat protein by the body yields a net gain of approximately 195 mmol of ATP (an average of 21.5 moles of ATP per mole of amino acids). They also estimated that on a whole-body basis, approximately 35% of this net ATP production results from amino acid oxidation in muscle and small intestine, 60% from oxidation of the glucose generated by hepatic gluconeogenesis, and 5% from oxidation of acetoacetate generated from amino acid carbon chains. In the fed state, dietary glutamine, glutamate, and aspartate (which together account for ∼20% of dietary protein) are metabolized within the enterocyte with the resultant production of alanine. In addition, the portal-drained viscera also extract glutamine from the arterial circulation, even during protein feeding, and metabolize this to alanine. Therefore the portal blood contains higher amounts of alanine but lower amounts of glutamine, glutamate, and aspartate when compared with the amino acid pattern of dietary protein. Because the intestine catabolizes glutamine, glutamate, and aspartate to alanine, which is subsequently released and taken up by the liver, the gluconeogenic potential of amino acid carbon chains is largely conserved despite the intestine’s use of these amino acids as fuels (Watford, 1994). Uptake of alanine by the liver exceeds gut release (with additional alanine originating from the muscle and other tissues), whereas hepatic uptake of branched-chain amino acids is substantially less than gut output, such that the systemic blood levels of valine, leucine, and isoleucine rise in response to protein ingestion. There is a net uptake of these branched-chain amino acids by extrahepatic tissues (muscle, brain) during the absorptive period. Metabolic acidosis results in an increased release of glutamine from skeletal muscle. Within the kidney, the actions of mitochondrial glutamate dehydrogenase and glutaminase are primarily responsible for an increase in NH3 production from glutamine. Glutamine contains two amine groups that can be released as ammonia. In acute acidosis, flux through the α-ketoglutarate dehydrogenase reaction is stimulated by the lower pH, resulting in a decrease in the α-ketoglutarate concentration which in turn promotes operation of the glutamate dehydrogenase reaction in the direction of glutamate conversion to α-ketoglutarate plus NH3. The glutamate/glutamine carbon skeleton is then further metabolized to bicarbonate and, in some species, glucose. Longer-term regulation during metabolic acidosis involves increased synthesis of the key kidney enzymes, such as glutaminase and phosphoenolpyruvate carboxykinase, and key transporters, such as the SNAT3 (SLC38A3) glutamine transporter (Ibrahim et al., 2008; Busque and Wagner, 2009). The increased expression of these proteins appears to be mediated mainly by an increase in mRNA stability through the presence of pH-response elements in their mRNAs. During acidosis, the association of RNA-binding proteins with these pH-responsive elements serves to stabilize the mRNAs, leading to increased levels of expression. For the synthesis of the carbon chains of dispensable amino acids, glucose or glucogenic substrates (such as the carbon skeletons of most amino acids) are required. Pyruvate or other three-carbon glycolytic intermediates serve as substrates for synthesis of alanine, serine, and glycine. Oxaloacetate, a 4-carbon α-keto acid, is the carbon skeleton of aspartate and asparagine. The 5-carbon α-keto acid, α-ketoglutarate, or its metabolites, provides the carbon skeleton for glutamate, glutamine, proline, and arginine (Figure 14-12). Nitrogenous groups are added to these carbon chains by direct transamination of pyruvate, 3-phosphohydroxypyruvate, oxaloacetate, and α-ketoglutarate with other amino acids; by amidation of glutamate and aspartate; and by the formation of metabolites of pyrroline 5-carboxylate (Figure 14-13), as is discussed in more detail in the section on proline and arginine. The synthesis of dispensable amino acids frequently involves the cooperation of a number of tissues. This is referred to as interorgan amino acid metabolism.
Amino Acid Metabolism
Overview of Amino Acid Metabolism
Amino Acid Pools and Transport
AMINO ACID
PLASMA (EXTRACELLULAR)
SKELETAL MUSCLE (INTRACELLULAR)
mmol/L
Alanine
0.33
2.34
Arginine
0.08
0.51
Asparagine
0.05
0.47
Citrulline
0.03
0.04
Cysteine
0.11
0.18
Glycine
0.21
1.33
Glutamate
0.06
4.38
Glutamine
0.57
19.45
Histidine
0.08
0.37
Isoleucine
0.06
0.11
Leucine
0.12
0.15
Lysine
0.18
1.15
Methionine
0.02
0.11
Ornithine
0.06
0.30
Phenylalanine
0.05
0.07
Proline
0.17
0.83
Serine
0.12
0.98
Taurine
0.07
15.44
Threonine
0.15
1.03
Tyrosine
0.05
0.10
Valine
0.22
0.26
GENE FAMILY
GENERAL DESCRIPTION OF TRANSPORT SYSTEM SERIES
FUNCTIONAL NAMES
SLC1
High-affinity glutamate and neutral amino acid transporter family
ASCT (ASC), EAAT (  )
)
SLC3
Heavy subunits of the heteromeric amino acid transporters
rBAT, 4F2hc
SLC6
Sodium- and chloride-dependent neurotransmitter transporter family (for GABA, taurine, betaine transporters)
GlyT (gly), PROT (L-proline), CRTR or CT1 (creatine), TauT (taurine, β-ala), ATB0,+ (B0,+), SBAT (large neutral amino acids), NTT (neutral amino acids), B0AT (B0), SIT (IMINO)
SLC7
Cationic amino acid transporter/glycoprotein–associated amino acid transporter family; the light subunits of the heteromeric amino acid transporters
CAT(y+), LAT(L), y+LAT(y+L), b0,+AT (b0,+), Asc (asc), xCT (  ), AGT (XAT2)
SLC15
Proton–oligopeptide symporters
Pept (oligopeptide), PHT (peptide/histidine)
SLC16
Monocarboxylate transporter family (including aromatic amino acids)
TAT1 (T)
SLC36
Proton-coupled amino acid transporter family (for small neutral amino acids)
PAT (Iminoacid)
SLC38
System A and N, sodium-coupled neutral amino acid transporter family
SNAT (A and N)
SLC43
Sodium-independent, system L–like amino acid transporter family
LAT (LAT)
SLC17
Vesicular glutamate transporter family
VGLUT
SLC18
Vesicular amine transporter family
VMAT
SLC32
Vesicular inhibitory amino acid transporter family
VIAAT
 ) light subunit gene (xCT, or SLC7A11). Transcription factors that belong to the ATF (activating transcription factor) and C/EBP (CCAAT/enhancer binding protein) families appear to be involved in binding to the AARE or AARE-like sequences in these genes.
 NUTRITION INSIGHT
 system impair the transport of cystine out of lysosomes, resulting in the disease called cystinosis.
Amino Acids as Signaling Agents
Mammalian Target of Rapamycin
 CLINICAL CORRELATION
Taste
Nitrogen Theme: Reactions Involved in the Transfer, Release, and Incorporation of Nitrogen
Transamination
Deamination
Deamidation and Transamidation
Incorporation of Ammonia into the α-Amino Pool
 NUTRITION INSIGHT
Incorporation of Ammonia into Glutamine as an Amide Group
Incorporation of Ammonia into Carbamoyl Phosphate for Formation of Urea Cycle Intermediates and Urea
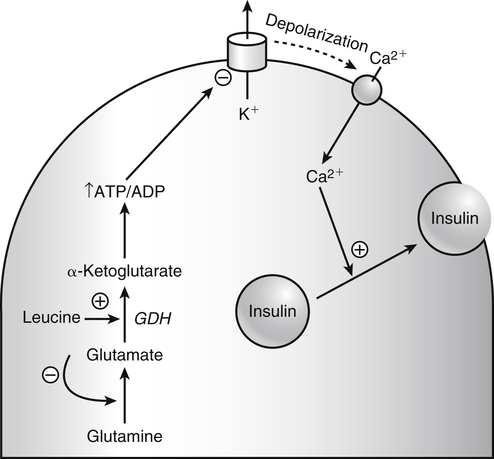
 CLINICAL CORRELATION
Carbon Theme: Metabolism of the Carbon Chains of Amino Acids
Catabolism of Amino Acid Carbon Chains
Gluconeogenesis from Amino Acids
Energetics of Amino Acid Oxidation
Regulation of Amino Acid Oxidation and Gluconeogenesis
Acid–Base Considerations of Amino Acid Oxidation
Synthesis of Dispensable Amino Acids
![]()
Stay updated, free articles. Join our Telegram channel

Full access? Get Clinical Tree


Basicmedical Key
Fastest Basicmedical Insight Engine