TABLE 16.1 Indications for Bone Marrow Trephine Biopsies | |
|---|---|
|
TABLE 16.2 Causes of Pancytopenia | ||||||||||||||||||||||||||||||||||||
|---|---|---|---|---|---|---|---|---|---|---|---|---|---|---|---|---|---|---|---|---|---|---|---|---|---|---|---|---|---|---|---|---|---|---|---|---|
| ||||||||||||||||||||||||||||||||||||
portends a worse prognosis (29,30). With successful induction, regeneration of normal bone marrow begins in the first week or two after the initiation of therapy. If growth factors are not administered, erythroid regeneration is generally first, followed in sequence by granulocyte and megakaryocyte regeneration. In patients treated with granulocyte colony-stimulating factor (G-CSF), granulocyte production occurs most rapidly. Hematopoietic marrow regeneration accelerates in the second and third weeks, with blood counts showing recovery and in some patients approaching normal within 28 days. Slow or asynchronous recovery of blood counts toward normal may indicate resistant disease. However, retarded bone marrow regeneration may also be caused by medications, viral infections (especially cytomegalovirus [CMV], human herpesvirus-6 [HHV6], and parvovirus B19), marrow stromal damage, and extraordinary sensitivity to chemotherapy (28,31). With remission and regeneration of normal hematopoietic tissue, the marrow returns to normal or near-normal cellularity, although cellularity may be more variable than normal; the bone marrow may remain mildly hypocellular in patients on maintenance chemotherapy. If blood cytopenias appear following complete remission of the disease, a bone marrow examination is indicated to determine whether the leukemia has relapsed or the marrow is suppressed by maintenance chemotherapy or other causes (31).
tumors, and collagen vascular diseases. In acute inflammation, an exudative reaction with increased mature granulocytes, edema, and necrosis is observed. In chronic infections or malignancies, decreased hematopoiesis with increased lymphocytes, plasma cells, and mast cells is more common (59). When the disease process is prolonged, hematopoiesis is diminished and reticulin fibrosis and alterations of vascularity may be present.
TABLE 16.3 Cytologic Features of Acute Leukemias | ||||||||||||||||||||||||
|---|---|---|---|---|---|---|---|---|---|---|---|---|---|---|---|---|---|---|---|---|---|---|---|---|
|
or Sudan black stain and a nonspecific esterase stain provides the desired information in most instances. The myeloperoxidase or Sudan black reactions are most useful in establishing the identity of AML. The nonspecific esterase stain is used to identify a monocytic component in AML and to distinguish poorly differentiated monoblastic leukemia from AML, minimally differentiated and ALL.
TABLE 16.4 Prognostic Implications of Cytogenetics in Acute Leukemia: Bone Marrow Chromosome Findings | ||||||||||||||||||||||||||||||||||||||||||||||||||
|---|---|---|---|---|---|---|---|---|---|---|---|---|---|---|---|---|---|---|---|---|---|---|---|---|---|---|---|---|---|---|---|---|---|---|---|---|---|---|---|---|---|---|---|---|---|---|---|---|---|---|
| ||||||||||||||||||||||||||||||||||||||||||||||||||
contributes directly to the classification of leukemias and may provide valuable treatment and prognostic information (119). PCR and FISH studies for specific gene segments are also sensitive indicators of minimal residual leukemia and early relapse (120). Probes are available for detection of many of the mutations and fusion genes that identify clinically relevant categories of acute leukemia, MDSs, and myeloproliferative neoplasms. Examples of some of the most common ones found in acute leukemias are listed in Table 16.5 with corresponding cytogenetic changes, where applicable. New methods for high-resolution genome-wide analysis are providing new information on the genetic basis of leukemogenesis, identifying novel subtypes of leukemia, and providing markers to integrate into diagnostic testing and to be targeted with novel molecular-based therapy.
TABLE 16.5 Major Molecular Genetic Abnormalities in Acute Myeloid Leukemia and Acute Lymphoblastic Leukemia | ||||||||||||||||||||||||||||||||||||||||||||||
|---|---|---|---|---|---|---|---|---|---|---|---|---|---|---|---|---|---|---|---|---|---|---|---|---|---|---|---|---|---|---|---|---|---|---|---|---|---|---|---|---|---|---|---|---|---|---|
| ||||||||||||||||||||||||||||||||||||||||||||||
chemotherapy for another disease. AML not otherwise specified (NOS) includes cases of AML that lack recurrent genetic rearrangements or myelodysplasia-related changes and have not received prior cytotoxic drugs. This group is subclassified into traditional morphologic categories. Myeloid sarcoma is a designation for a tumor mass consisting of myeloid blasts occurring in an anatomic site other than bone marrow. A separate group with several distinctive features is myeloid proliferations related to Down syndrome. Blastic plasmacytoid dendritic cell neoplasm is a recently designated group derived from precursors of plasmacytoid dendritic cells with a high frequency of cutaneous and bone marrow involvement and leukemic dissemination (91). Each group of AML and related precursor neoplasm is covered in more depth in the discussion that follows.
TABLE 16.6 World Health Organization Classification of Acute Myeloid Leukemia and Related Precursor Neoplasms | ||||||||||||||||||||||||||||||||||||||||||||||||||||||||||||||||||||
|---|---|---|---|---|---|---|---|---|---|---|---|---|---|---|---|---|---|---|---|---|---|---|---|---|---|---|---|---|---|---|---|---|---|---|---|---|---|---|---|---|---|---|---|---|---|---|---|---|---|---|---|---|---|---|---|---|---|---|---|---|---|---|---|---|---|---|---|---|
| ||||||||||||||||||||||||||||||||||||||||||||||||||||||||||||||||||||
TABLE 16.7 World Health Organization Classification of Precursor Lymphoid Neoplasms | ||||||||||||||||||||||||
|---|---|---|---|---|---|---|---|---|---|---|---|---|---|---|---|---|---|---|---|---|---|---|---|---|
| ||||||||||||||||||||||||
characteristic clinical, ultrastructural, cytogenetic, and molecular features. They differ only in the size and number of granules in the cytoplasm, the prominence of the abnormal nuclear shape in the predominant leukemic cells, and in the magnitude of the blood leukocyte count. Hypergranular APL is generally associated with leukopenia at presentation, whereas microgranular APL often presents with marked leukocytosis (135).
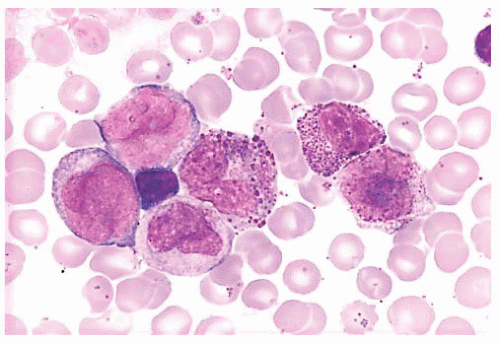 FIGURE 16.9 A marrow smear from a patient with acute myeloid leukemia and inv(16)(p13;q22) shows the typical myelomonocytic morphology and increased eosinophils with dysplastic granulation. |
most commonly in females (152). AML with mutated NPM1 in patients with normal conventional cytogenetics seems to show a good response to therapy and favorable prognosis unless there is also FLT3-internal tandem duplication mutation, in which case it is associated with a less favorable prognosis (156).
50% of cases. In those without Auer rods, at least 3% of the leukemic myeloblasts must be myeloperoxidase or Sudan black B positive.
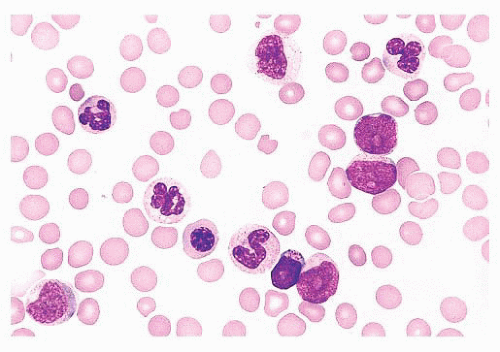 FIGURE 16.12 An intermediate magnification of a marrow smear illustrates features of acute myeloid leukemia with maturation. The marrow contained about 30% myeloblasts. |
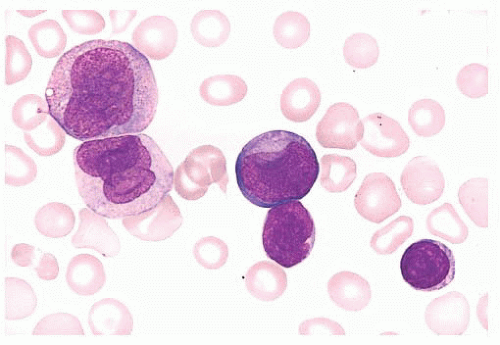
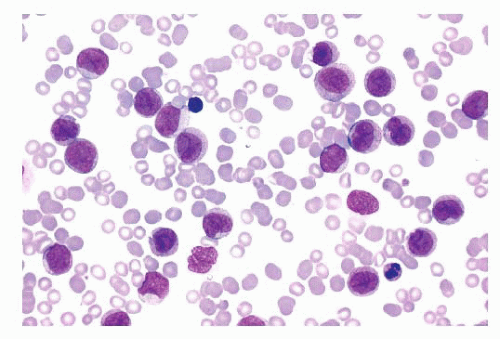 FIGURE 16.13 An intermediate magnification of a blood smear from a patient with acute monocytic leukemia. There is a marked leukocytosis consisting primarily of promonocytes and scattered monoblasts. |
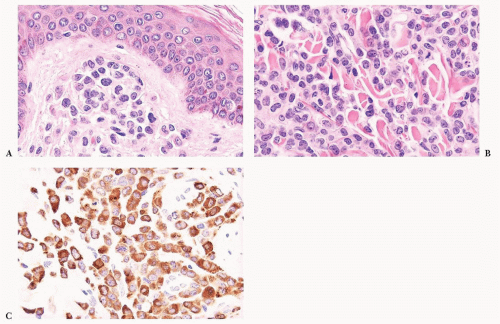
evidence of myeloid leukemia in the bone marrow and blood but, in some instances, myeloid sarcomas occur without obvious leukemia. The most common sites for myeloid sarcomas are subperiosteal bone, skin, lymph nodes, orbit, spinal canal, and mediastinum (91) (Fig. 16.14). Most types of AML may occasionally present in an extramedullary site, but the monocytic and myelomonocytic leukemias have the highest propensity.
and myeloid antigens. Expression of CD56 and TdT (when present) differentiate this entity from proliferations of mature plasmacytoid dendritic cells, which may be seen in reactive states and in association with other myeloid neoplasms, particularly chronic myelomonocytic leukemia (CMML) (188). The differentiation from AML may be challenging, but the characteristic clinical and immunophenotypic features allow confident diagnosis in most cases. Recently, expression of BDCA-2 and BDCA-4 have been suggested as useful features for the diagnosis of blastic plasmacytoid dendritic cell neoplasm (186).
TABLE 16.8 World Health Organization Requirements for Assigning More Than One Lineage to a Single Blast Population | ||||||||||||||||||
|---|---|---|---|---|---|---|---|---|---|---|---|---|---|---|---|---|---|---|
| ||||||||||||||||||
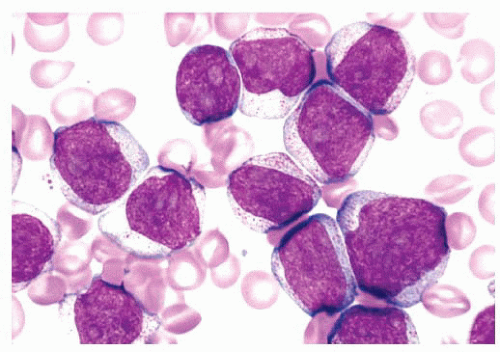
cytoplasm is variably basophilic. Vacuoles are often present, and cytoplasmic granules are found in a small number of cases. In a minority of cases, the predominant lymphoblasts are large. In these, the blast size may be relatively uniform or quite heterogeneous, but most of the lymphoblasts exceed twice the size of a normal small lymphocyte. In the large blasts, nucleoli are often prominent and vary from one to four; these cells may be difficult to distinguish from myeloblasts.
neoplasms (91). There are no distinctive clinical morphologic, immunophenotypic, or genetic findings in B-lymphoblastic leukemia/lymphoma, NOS.
therapy, most relapse and die of ALL or complications of hypereosinophilia; death due to cardiac failure is not uncommon.
blood and marrow; a diagnosis of AML is made if there are 20% or more myeloblasts (91,230). Approximately one-third of patients with MDS develop AML within months.
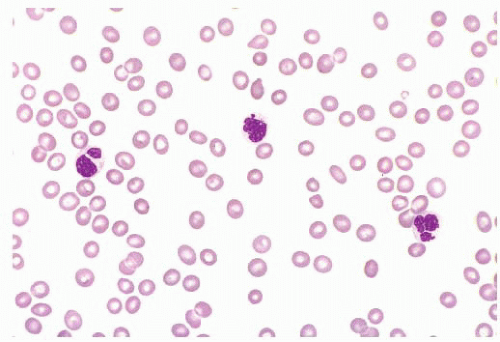 FIGURE 16.17 A blood smear from a patient with refractory cytopenias with multilineage dysplasia illustrating marked pancytopenia and dysplastic neutrophils. |
TABLE 16.9 Features That Define Myelodysplastic Syndrome | ||||||
|---|---|---|---|---|---|---|
|
TABLE 16.10 Hematologic Findings in Myelodysplastic Syndromes | |||||||||||||||||||||||||||||||||||||||||||||||||||||||||
|---|---|---|---|---|---|---|---|---|---|---|---|---|---|---|---|---|---|---|---|---|---|---|---|---|---|---|---|---|---|---|---|---|---|---|---|---|---|---|---|---|---|---|---|---|---|---|---|---|---|---|---|---|---|---|---|---|---|
| |||||||||||||||||||||||||||||||||||||||||||||||||||||||||
is abnormally diminished because of hypogranularity. IHC on marrow biopsies can aid in determining the blast percentage in some cases where there is a suboptimal aspirate.
TABLE 16.11 World Health Organization Classification of Myelodysplastic Syndromes | ||||||||||||||||||||||
|---|---|---|---|---|---|---|---|---|---|---|---|---|---|---|---|---|---|---|---|---|---|---|
| ||||||||||||||||||||||
Mild to moderate dyserythropoiesis may be observed but dysplastic changes in granulocytes and megakaryocytes are not present. Myeloblasts are rarely increased and never exceed 4%.
MDS that are seen in adults may be seen in children, but RARS and MDS with isolated del(5q) are extremely rare (91). The most common MDS in children is refractory cytopenia of childhood (RCC), which accounts for about half of all cases. RCC is characterized by persistent cytopenia, less than 5% blasts in the bone marrow and less than 2% in the blood (252). Dysplastic changes are present in two different lineages or in more than 10% of cells of a single lineage. In about 75% of cases, the bone marrow is hypocellular, often making RCC difficult to distinguish from other congenital or acquired causes of bone marrow failure (91). Most patients with RCC have normal cytogenetics; in those with a cytogenetic abnormality, monosomy 7 is most common (253). Patients with normal cytogenetics may experience a long indolent course of their disease. Patients with a monosomy 7 are the most likely to progress to a more aggressive MDS (253).
TABLE 16.12 World Health Organization Classification of Myeloproliferative Neoplasms | |||||||||
|---|---|---|---|---|---|---|---|---|---|
|
megakaryocytes, many of which are larger than usual and often polymorphic (283,284,285 and 286) (Fig. 16.21). The marrow may show increased vascularity and depleted storage iron. The prominent erythroid hyperplasia distinguishes PV from other MPNs. Not all PV cases require marrow biopsy for disease confirmation, as many can be diagnosed based on molecular and complete blood count studies.
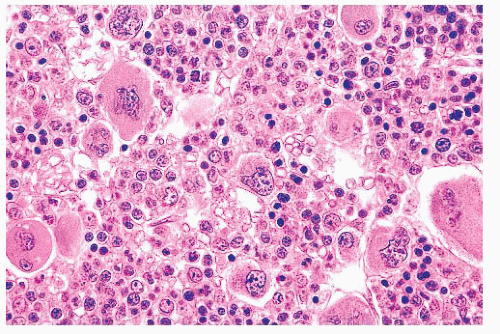 FIGURE 16.21 Bone marrow trephine biopsy section from a 57-year-old woman with PV. The marrow is markedly hypercellular with a striking increase in erythroid precursors and megakaryocytes. |
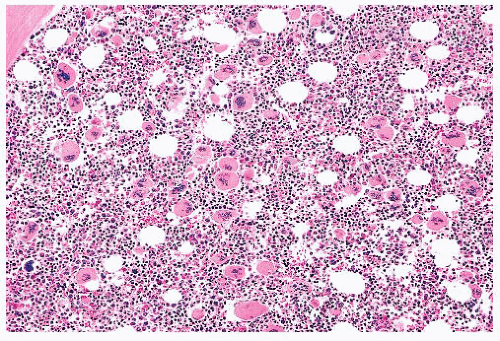 FIGURE 16.22 Bone marrow section from a patient with essential thrombocythemia. The patient’s platelet count was 1.7 million. The marrow is hypercellular and megakaryocytes are markedly increased. |
patchy phase features alternating areas of hematopoiesis and fibrosis. The phase of obliterative myelosclerosis (fibrosis) is characterized by extensive marrow replacement with fibrous connective tissue. The remaining scattered clusters of hematopoietic cells have the appearance of being entrapped and compressed in the fibrotic marrow; megakaryocytes may be markedly distorted. Osteosclerosis is often prominent in this terminal phase of the disease. To standardize interpretations, scoring systems exist for the semiquantitative assessment of marrow fibrosis (309). Although the marrow histopathologic features may vary among the three phases in biopsies from different anatomic sites (308), megakaryocytic atypia is a feature common to all three phases (295,309). Megakaryocytes show sizes ranging from small to large, frequent arrangement in tight clusters, and morphology characterized by “cloud-like” bulbous nuclear lobation and hyperchromatic nuclei. Of all the MPNs, PM has the most megakaryocytic atypia—a feature which can be used to discriminate the different diseases (254).
More than 25% of the mast cells in the infiltrate on a biopsy section are spindle shaped or have atypical morphology, or more than 25% of the mast cells in a marrow aspirate are immature or atypical
Detection of a KIT point mutation
Mast cells abnormally expressing CD2 and/or CD25 Serum tryptase persistently greater than 20 ng/mL (unless there is an associated clonal myeloid disorder)
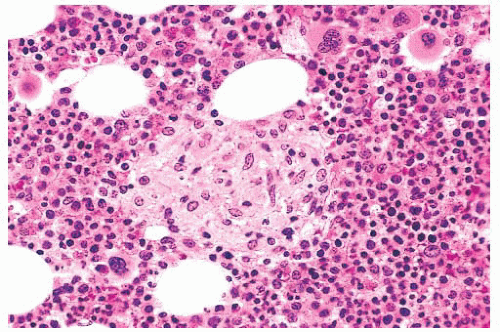
distributed and characterized by a mixture of mast cells, lymphocytes, eosinophils, neutrophils, histiocytes, endothelial cells, and fibroblasts. The various cell types may be uniformly mixed, but often there is an element of compartmentalization of cell types with a central focus of lymphocytes encircled by mast cells (Fig. 16.25). The mast cells are usually round or oval with abundant eosinophilic cytoplasm. The monocellular focal lesions are composed primarily of mast cells with occasional lymphocytes and eosinophils. The mast cells are frequently spindle shaped with pale to lightly eosinophilic cytoplasm. The nuclei are round, oval, elongated, or monocytoid in configuration; these mast cells resemble histiocytes or fibroblasts. In all types of focal lesions, nucleoli are inconspicuous and mitotic figures absent. The uninvolved portion of the bone marrow may be normocellular or hypercellular with increased granulocytes (313,316).
TABLE 16.13 Classification of Mastocytosis | |||||||
|---|---|---|---|---|---|---|---|
|
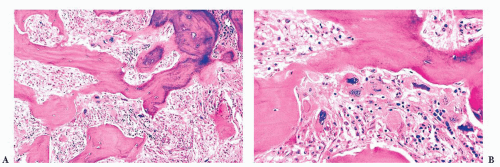
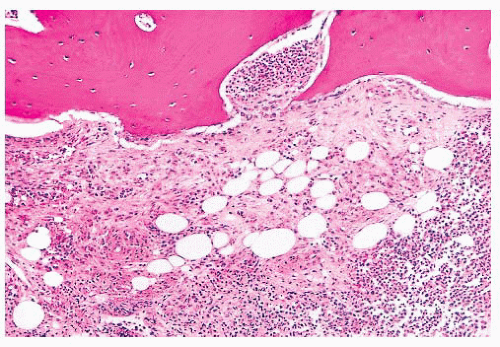 FIGURE 16.24 Trephine biopsy from a 78-year-old woman with systemic mast cell disease. There is widening and irregularity of the bone trabeculae and a paratrabecular infiltrate. |
Stay updated, free articles. Join our Telegram channel

Full access? Get Clinical Tree


