12 Applying Statistics to Trial Design
Sample Size, Randomization, and Control for Multiple Hypotheses

I Sample Size
1. What size sample—large or small—would be needed if there was a very large variance in the outcome variable?
2. What size sample would be needed if the investigator wanted the answer to be extremely close to the true value (i.e., have narrow confidence limits or small p value)?
3. What size sample would be needed if the difference that the investigator wanted to be able to detect was extremely small?
Other factors affecting the number of participants required for a study include whether the:
1. Research design involves paired data (e.g., each subject has a pair of observations from two points in time—before treatment and after treatment) or unpaired data (e.g., observations are compared between an experimental group and a control group).
2. Investigator anticipates a large or small variance in the variable of interest.
3. Investigator wants to consider beta (β, type II or false-negative) errors in addition to alpha (α, type I or false-positive) errors.
4. Investigator chooses the usual alpha level (p value of 0.05 or confidence interval of 95%) or chooses a smaller level of alpha.
5. Alpha chosen is one-sided or two-sided.
6. Investigator wants to be able to detect a fairly small or extremely small difference between the means or proportions of the outcome variable.
A Derivation of Basic Sample Size Formula
To derive the basic formula for calculating the sample size, it is easiest to start with the formula for the paired t-test (see Chapter 10):

where tα is the critical ratio to determine the probability of a false-positive (α) error if the null hypothesis is rejected;  is the mean difference that was observed in the outcome variable, sd is the standard deviation of the before-after differences, and N is the sample size.
1. The larger the variance (s2), the larger the sample size must be because the variance is in the numerator of the formula for N. This makes sense intuitively because with a large variance (and large standard error), a larger N is needed to compensate for the greater uncertainty of the estimate.
2. To have considerable confidence that a mean difference shown in a study is real, the analysis must produce a small p value for the observed mean difference, which implies that the value for tα or zα was large. Because zα is in the numerator of the sample size formula, the larger zα is, the larger the N (the sample size) that is needed. For a two-tailed test, a p value of 0.05 (the alpha level chosen) would require a zα of 1.96, which, when squared as in the formula, would equal 3.84. To be even more confident, the investigator might set alpha at 0.01. This would require a zα of 2.58, which equals 6.66 when squared, 73% greater than when alpha is set at 0.05. To decrease the probability of being wrong from 5% to 1% would require the sample size to be almost doubled.
3. If the investigator wanted to detect with confidence a very small difference between the mean values of two study groups (i.e., a small  ), a very large N would be needed because the difference (squared) is in the denominator. The smaller the denominator is, the larger the ratio is, and the larger the N must be. A precise estimate and a large sample size are needed to detect a small difference.
B Beta (False-Negative) Error
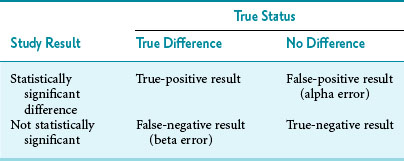
If a difference is examined with a t-test, and it is statistically significant at the prestated level of alpha (e.g., 0.05), beta error is not an issue. What if a reported finding seems to be clinically important, but it is not “statistically significant” in that study? Here the question of a possible false-negative (beta) error becomes important. Beta error may have occurred because the sample size was too small. When planning a study, investigators want to avoid the likelihood of beta (false-negative) error and the likelihood of alpha (false-positive) error, and readers of the literature should be on the lookout for this problem as well. The relationship between the results of a study and the true status can be seen in a “truth table” (Table 12-1). The similarity of Table 12-1 to the relationship between a test result and the disease status is obvious (compare with Table 7-1).
A seminal article illustrated the need to be concerned about beta error: in most of 71 negative RCTs of new therapies published in prominent medical journals, the sample sizes were too small “to provide reasonable assurance that a clinically meaningful ‘difference’ (i.e., therapeutic effect) would not be missed.”1 In the study, “reasonable assurance” was 90%. In 94% of these negative studies, the sample size was too small to detect a 25% improvement in outcome with reasonable (90%) assurance. In 75% of the studies, the sample size was too small to detect a 50% improvement in outcome with the same level of assurance. Evidence indicates that this problem has persisted over time.2
A study with a large beta error has a low sensitivity for detecting a true difference because, as discussed in Chapter 7:

which means that statistical power is equal to (1 − beta error). When calculating a sample size, if the investigators accept a 20% possibility of missing a true finding (beta error = 0.2), the study should have a statistical power of 0.8, or 80%. That means the investigators are 80% confident that they would be able to detect a true mean difference of the size they specify with the sample size they determine. The best way to incorporate beta error into a study is to include it beforehand in the determination of sample size. Incorporating the statistical term for beta error (zβ) in the sample size calculation is simple but likely to increase the sample size considerably.
C Steps in Calculation of Sample Size
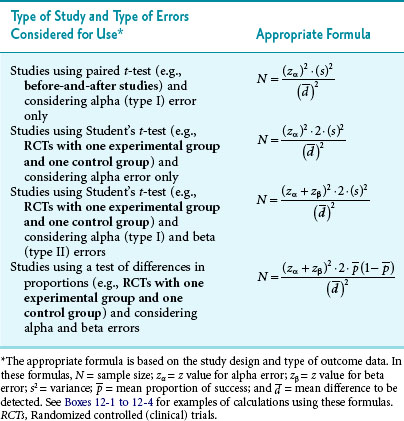
The first step in calculating sample size is to choose the appropriate formula to use, based on the type of study and the type of error to be considered. Four common formulas for calculating sample size are discussed in this chapter and listed in Table 12-2, and their use is illustrated in Boxes 12-1 through 12-4.3 The second step in calculating sample size requires that the investigators specify the following values: the variance expected (s2); the zα value for the level of alpha desired; the smallest clinically important difference  ; and, usually, beta (measured as zβ). All values except the variance must come from clinical and research judgment, although the estimated variance should be based on knowledge of data. If the outcome variable being studied is continuous, such as blood pressure, the estimate of variance can be obtained from the literature or from a small pilot study.
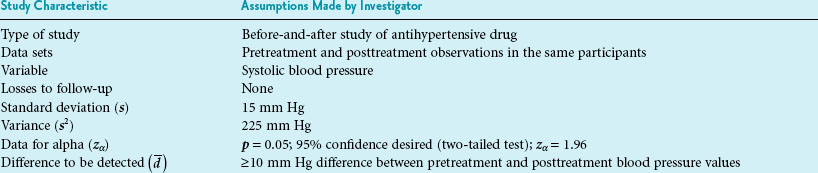
Box 12-1 Calculation of Sample Size for a Study Using the Paired ± t-Test and Considering Alpha Error Only
Box 12-2 Calculation of Sample Size for a Study Using Student’s t-Test and Considering Alpha Error Only
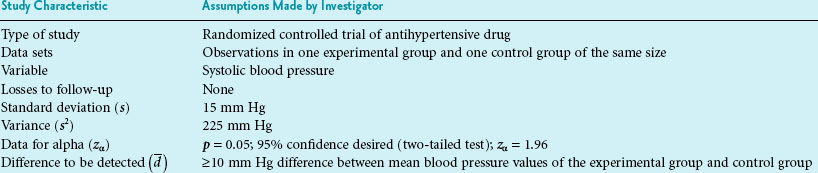
Part 2 Calculation of Sample Size (N)
Interpretation: For the type of study depicted in this box, 18 participants are needed in the experimental group and 18 in the control group, for a total N of 36 study participants. The N needed to be rounded up. The total N needed in this box is four times as large as the total N needed in Box 12-1, although the values for zα, s, and  are the same in both boxes. One reason for the larger sample size for a randomized controlled trial is that there are two groups, and the N calculated is for the intervention group only. The other reason is the fact that there are two variances to consider (i.e., the intervention and control groups contribute to the overall variance), so the estimated variance must be multiplied by 2.
Stay updated, free articles. Join our Telegram channel

Full access? Get Clinical Tree


