To better understand the modes of action and antiviral resistance of HIV the basic structure of the virus should be appreciated. HIV is a member of the Lentivirus genus in the Retroviridae family. The retrovirus genome consists of two RNA molecules transmitted as a single stranded positive sense enveloped virus. Upon entry into the target cell, viral RNA is reverse transcribed into double-stranded DNA by virally encoded reverse transcriptase that is transported with the viral genome in the virus particle. Two different approaches are used to assess HIV drug resistance: genotyping and phenotyping. Understanding the characteristics, performances, and the interpretation of these assays is needed to use them optimally (14–16). Genotypic assays detect mutations expressed as nucleotide disarray resulting in amino acid changes that have been shown to correlate with in vitro and/or in vivo resistance to a particular drug or class of drugs. Phenotypic assays provide quantitative measure of drug susceptibility by determining the concentration of drug required to inhibit virus replication in cell culture.
ARV resistance due to viral gene mutations accounts for a large portion of treatment failures. The emergence of these genetic changes in HIV type 1 (HIV-1) is fostered by ongoing viral replication in the presence of subinhibitory concentrations of ARVs. Poor penetration of drugs into certain body compartments (sanctuary sites), inadequate adherence, and variable pharmacokinetic factors may contribute to subtherapeutic drug levels in vivo. This, in turn, may allow for selection of either preexisting (archived) or newly generated drug-resistant mutants. The critical problem in the clinical setting is that a mutant selected by a failing regimen may have some degree of cross-resistance to other drugs in the same class that have not yet been prescribed to that patient. The development of cross-resistance may lead to a reduced virologic or immunologic response to subsequent regimens. As scientists develop new agents active against resistant virus (see Fig. 11.1), clinical medicine is also implementing diagnostic strategies designed to detect ARV resistance and individualize subsequent regimens.
ARV resistance develops when viral replication continues in the presence of the selective pressure of drug exposure. As previously noted, the 20 approved ARV drugs belong to six classes based upon their mechanism of action (see Fig. 11.1).
For some drugs, such as the NRTI lamivudine and all available NNRTIs, a single mutation induces high-grade resistance in a predictable manner. For others such as zidovudine, abacavir, tenofovir, and most PIs, high-grade resistance requires the serial accumulation of multiple mutations and is thus slower to emerge.
Nucleoside and Nucleotide Reverse Transcriptase Inhibitors
Although most of the mutations associated with NRTI resistance are not at the active site of the enzyme, they do lead to conformational changes that affect the active site aspartate residues. Different mutations lead to two different mechanisms for resistance: decreased substrate binding and increased phosphorolysis (removal of the chain-terminating substrate that has already been incorporated into the growing proviral DNA chain). Both mechanisms lead to an overall net decrease in termination of the elongating chain of HIV DNA by the NRTI.
Nonnucleoside Reverse Transcriptase Inhibitors
Two patterns of multi-NNRTI resistance have been described. One is the K103N RT mutation. This single mutation confers resistance to all currently available NNRTIs, presumably by stabilizing the closed-pocket form of the enzyme, thus inhibiting the binding of the drug to its target. The fact that all available agents in this class bind to the same domain explains the broad pattern of cross-resistance and has prompted the development of new agents that interact with this domain more favorably. Indeed, another pattern of multi-NNRTI resistance is the accumulation of multiple mutations including L100I, V106A, Y181C, G190S/A, and M230L. Rarely, Y188L causes multi-NNRTI resistance.
Enhanced susceptibility to NNRTIs (i.e., hypersusceptibility) has been described in association with multiple mutations conferring broad cross-resistance to NRTIs and a lack of NNRTI resistance mutations. Longer duration of NRTI use, prior use of zidovudine, and abacavir or zidovudine resistance all have been associated with hypersusceptibility. This phenomenon appears to have biologic significance, with its presence enhancing the response to efavirenz-based regimens. A significantly greater short-term reduction in plasma HIV-1 RNA level, showing hypersusceptibility to efavirenz, was noted in patients who received that drug for salvage therapy.
Protease Inhibitors
The sequential use of certain PIs may be possible in some situations because several drugs in this class have distinctive major resistance mutations. This is particularly true for nelfinavir and has been suggested for atazanavir. All other PIs retain activity in vitro and in vivo against D30N isolates selected by nelfinavir. Less commonly, nelfinavir failure is associated with L90M, which is more likely to add to cross-resistance to other PIs. The I50V amprenavir resistance mutation alters the hydrophobic interaction with the target and had been thought to alter the binding of other drugs in this class only minimally. Clinical evidence to support particular PI sequencing, except that for nelfinavir, is lacking.
The presence of two key mutations (e.g., D30N, G48V, I50V, V82A/F/T/S, I84V, and L90M) generally confers broad cross-resistance to most currently available PIs. One strategy to avoid the accumulation of multiple mutations is to use low-dose ritonavir to increase the circulating levels (or “boost”) of other PIs (e.g., lopinavir, indinavir, amprenavir, and saquinavir), which may result in higher and more prolonged drug concentrations and greater suppression of viral variants that contain a limited number of mutations. Thus, resistance depends not only on intrinsic properties of the virus but also on the achievable plasma levels of the drug.
Fusion Inhibitors
The fusion inhibitor operates by interfering with the fusion of viral and cellular membrane and thus entry into the CD4 cell. It binds to the initial heptad repeat (HR1) in the gp41 subunit of the viral envelope glycoprotein and prevents conformational changes required for fusion of the viral and cellular membranes. Enfuvirtide is the currently available fusion inhibitor delivered by subcutaneous injection. This agent is typically reserved for salvage therapy.
Integrase Strand Transfer Inhibitors
ARVs of this category obstruct integrase by binding in the catalytic core domain of the enzyme and competing for binding with host DNA. This action prevents integrase from inserting the viral genome into host DNA. Raltegravir is the currently available compound. Dolutegravir is a once-daily alternative to raltegravir.
When initiating therapy for HIV-infected patients that are considered naive, that is, never before been treated for infection, the U.S. Food and Drug Administration (FDA) panel recommends that therapy consist of two NRTIs and at least one ARV from another ARV class including a NNRTI, INSTI, or PI. The reference Web site provides up-to-date preferred regimens and weighs the strength of recommendations (Panel on Antiretroviral Guidelines for Adults and Adolescents. Guidelines for the Use of Antiretroviral Agents in HIV-1-Infected Adults and Adolescents. http://www.aidinfo.nih.gov).
Entry Inhibitors
Entry of HIV-1 into target cells is a multistep process involving attachment (mediated by gp120 binding to CD4), chemokine coreceptor binding, and association of two trimeric helical coils (HR-1 and HR-2) located in the ectodomain of gp41 into a six-helix bundle that brings the virus and cell membranes into close approximation, allowing membrane fusion to occur. A number of drugs currently in development block HIV-1 infection by interfering with one of these steps. The recently approved fusion inhibitor enfuvirtide (known as T-20) blocks the association of HR-1 with HR-2 by binding to the trimeric HR-1 complex, thereby inhibiting fusion and blocking virus entry (17). Mutations in HR-1 that reduce enfuvirtide susceptibility are selected by in vitro passage of HIV-1 in the presence of the drug and have been identified in isolates obtained from patients receiving enfuvirtide in clinical trials.
Identification of the presence of drug resistance by means of genotypic or phenotypic resistance assays can help a health care provider select a combination of ARVs that is likely to suppress HIV-1 replication (i.e., “active drugs” to which that patient’s virus population is not cross-resistant). To maximize the therapeutic benefit and minimize toxicity, information collected from the viral genotype or phenotype must be used in conjunction with the patient’s ARV treatment history, response to past regimens, immunologic status, pharmacologic data, and the clinician’s own knowledge of ARV drugs. Knowing when and how to use resistance testing in a clinical practice will lead to better clinical management of HIV-1–infected patients.
METHODS
Resistance assays use different technologies that provide complementary information about ARV resistance. As noted earlier, the two different types of drug resistance tests available are genotypic and phenotypic assays. Genotype assays provide information about viral mutations that may result in changes in viral susceptibility to particular drugs or classes of drugs. Phenotype assays directly quantitate the level of susceptibility of a patient’s virus sample to specific drugs in vitro. The values measured from the patient sample are compared with values measured from a standard wild-type reference strain. The degree of phenotypic resistance is the difference in susceptibility to a particular drug between the patient sample and the reference strain. In most cases, both genotype and phenotype testing methods require the use of polymerase chain reaction (PCR) technology to amplify the HIV-1 genes of interest (PR and RT) from patients’ plasma samples. However, there are numerous differences between these two resistance testing methods.
Phenotypic Testing
Several phenotypic assays have been in use for testing HIV-1. A serious limitation of some of these procedures is that not all clinical isolates grow in the cell culture lines used in these assays.
In the late 1980s, the first developed phenotypic assays were PBMC assays that required isolation of the virus by cocultivating patient’s PBMCs with mitogen-stimulated PBMCs obtained from HIV-seronegative donors, then titration of the virus stock. Subsequently, the inhibition of virus growth, in the presence of several concentrations of the drug, was evaluated by measurement of p24 Ag or RT activity in comparison with the replication in the absence of drug (18,19). These PBMC assay methods had several limitations regarding the difficulties in standardization, the interassay variability, and the burdensome workload for laboratory personnel. Overall, the PBMC compartment does not represent the actively replicating virus population present in the plasma compartment.
The development of RVA method, first described in 1994 (20), enabled the measurement of phenotypic resistance on a large scale. Since 1998, two companies have developed RVA assays: Antivirogram (Virco BVBA, Mechelen, Belgium) and PhenoSense (ViroLogic Inc, San Francisco, CA) (21). Antivirogram was the first RVA adapted to commercial development. The overall approach of the three commercial phenotypic assays is similar, but each assay is performed using different protocols (extraction, amplification) and reagents (viral vectors, cell lines, titration of the virus) (Table 11.1). Assays use PCR to amplify the entire protease, much of RT, and a part of the 3′ end of gag gene, including cleavage sites (p4/p2, p2/p7, p7/p1, p1/p6) from HIV-1 RNA extracted from patient plasma. Phenotypic PI resistance may be modulated by mutations at gag-pol cleavage sites, and four of the nine cleavage sites in the recombinant virus come from the patient virus and five from the laboratory virus construct. The amplified material is incorporated into vectors that derive from full-length molecular clones of HIV-1 but lack the protease and RT regions of the pol gene to create a recombinant HIV-1 isolate. After amplification, two strategies have been used to insert patient PR and RT sequences into vectors: The Antivirogram test (Virco BVBA, Mechelen, Belgium) uses homologous recombination following cotransfection of cell lines, whereas the PhenoSense assay (ViroLogic Inc, San Francisco, CA) uses site-specific endonuclease cleavage and direct ligation. Ligation products that are capable of propagating the vectors to high copy number are then introduced into bacterial cells. High virus stocks are generated by transfecting the recombinant viral vector DNA.
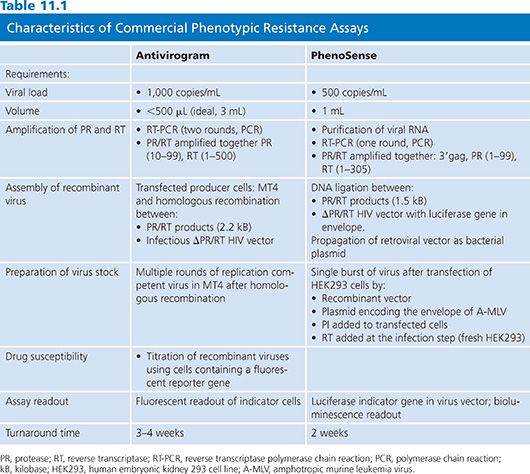
PhenoSense assay (ViroLogic Inc, San Francisco, CA) is a single-cycle assay using recombinant viruses that are limited to a single round of viral replication by a specific deletion in the HIV env gene of the vector. In this assay, evaluation of reverse transcriptase inhibitors (RTIs) involve serial dilutions of drugs added to the target cell line at the time of virus inoculation to block RT activity at the cell entry. PIs are evaluated by adding serial dilutions of drug to the transfected cells producing the virus stocks. In the Antivirogram (Virco BVBA, Mechelen, Belgium) assay, generation of high virus stocks is obtained by cultivating the recombinant viruses for several replication cycles (1 to 2 weeks). Then the virus stock is titrated before testing for drug susceptibility. Either PIs or RTIs can be evaluated using the same format by adding serial dilutions of drug to the cultures at the time of virus inoculation.
Commercially available RVA systems exploit the use of sensitive reporter genes that have been engineered into the target cells or the retroviral vector. Transcription of the reporter gene is placed under the regulatory control of the HIV-1 promoter/enhancer within the long terminal repeat (LTR). With infection with the recombinant virus, reporter gene expression is transactivated by the HIV-1 tat protein that is produced early in the HIV-1 replication cycle.
Drug susceptibility is assessed by comparing the IC50 of the patient virus to the IC50 of a drug-susceptible reference strain derived from the NL4–3 or HXB2 strain. Assay data are analyzed by plotting the percent inhibition of virus replication versus the log10 drug concentration. The final results are expressed as fold change or resistance indices, which are calculated as the IC50 of the patient virus divided by the IC50 of the reference virus. The Antivirogram (Virco BVBA, Mechelen, Belgium) assay results report IC50 values with graphic- and numerical-fold change values.
These phenotypic methods have been adapted to measure drug susceptibility to the entry inhibitors (22). The first results showed a very large variability in the IC50 of isolates from drug-naive patients. Such variability of up to 3 logs difference in IC50 is not yet explained.
Studies evaluating the comparative performances of the different phenotyping assays are limited. Excellent concordance was observed between the Antivirogram (Virco BVBA, Mechelen, Belgium) and PhenoSense (ViroLogic Inc, San Francisco, CA) assays (23) but the majority of the viruses tested were of the wild type.
Phenotypic Assays
Several phenotypic assays are available for determining the susceptibility of an HIV-1 isolate to nucleoside analog RT inhibitors. As noted earlier, a serious limitation of some of these procedures is that the clinical isolate recovered may not grow in the designated cell culture lines used in these assays. In order to meet this challenge, the AIDS Clinical Trials Group developed an assay performed in PBMCs that allows for most clinical isolates at HIV-1 (24). Viral end point is measured by quantitating p-24 antigens. To circumvent the typical drawbacks of phenotypic assays, a new iteration was developed, the RVAs. The two RVAs commercially available were previously noted: the Antivirogram (Virco BVBA, Mechelen, Belgium) assay (25) and the PhenoSense (ViroLogic Inc, San Francisco, CA) assay (21). In addition to the lengthy turnaround time of these phenotypic assays (~10 days) is the requirement for a minimum of 500 to 1,000 copies of HIV-1 RNA/mL plasma.
An unusual phenotypic assay exploits the requirement for HIV-1 to bind to a coreceptor, in addition to CD-4 for the virus to gain entry into the host cell; CXC chemokine receptor type 4 (CXCR4) and CCR5 are two major coreceptors for HIV-1 expressed on T lymphocytes and macrophages, respectively. A recently introduced entry inhibitor, Maraviroc, exploits the necessity for HIV-1 to bind to CCR5, preventing fusion of HIV-1 and T-lymphocyte membrane, thus blocking entry into cells. However, some HIV-1 strains exhibit “dual-tropism,” that is, they use both CXCR4 and CCR5 receptors; patient isolates must be characterized prior to initiation of Maraviroc therapy by means of a tropism assay to discern the required receptor(s). Commercially available tropism assay(s) are extant: the Phenoscript assay and the Trofile (Laboratory Corporation of America Holdings, Burlington, NC) assay. For integrase inhibitors such as raltegravir, an alternative specific phenotypic assay, PhenoSense Integrase (ViroLogic Inc, San Francisco, CA), is available. Mutations that confer resistance to integrase inhibitors have been elucidated and encompass two different pathways with a major mutation of either Q148/K/R or N155H. Using this information, laboratories can develop genotypic assays to detect this resistance capability.
Phenotypic drug susceptibility assay results are interpreted by comparing the replication of patient-derived viruses to replication of well-characterized laboratory strains at equivalent drug concentrations. The phenotypic assay cutoffs (change in IC50) defining whether the patient viral strain is susceptible or resistant are evolving. Former assays used “technical” cutoffs that refer to the interassay variability of the controls (one- to twofold for PhenoSense [ViroLogic Inc, San Francisco, CA] and two- to fourfold for Antivirogram [Virco BVBA, Mechelen, Belgium]). The “biologic” cutoff was obtained by testing a large number of viruses from treatment-naive individuals and defining the natural distribution of drug susceptibility in HIV-1 strains. The most relevant interpretation of phenotypic assay results is based on “clinical” cutoffs, which are distinct for each ARV drug and different for each assay system. Clinically relevant cutoffs available for a limited number of drugs are based on analysis of the relationship between baseline phenotype and reduction in viral load (Table 11.2).
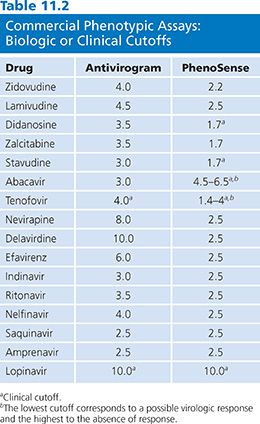
In the Antivirogram (Virco BVBA, Mechelen, Belgium) assay, biologic cutoff values are the basis for reporting assay results for all drugs tested except tenofovir and lopinavir/ritonavir, which are based on clinical response data. In the PhenoSense (ViroLogic Inc, San Francisco, CA) assay, results for lopinavir/ritonavir (26), abacavir (27), tenofovir (28), stavudine, and didanosine (29,30) are reported using clinically derived cutoffs. The PhenoSense (ViroLogic Inc, San Francisco, CA) assay can also measure increased susceptibility, often referred to as hypersusceptibility. This phenomenon has been mainly described for NNRTI drugs and is associated with resistance to nucleoside analogs (31). In a retrospective analysis of virologic outcome in patients who were NNRTI naive and NRTI experienced, increased susceptibility to efavirenz (as defined as less than 0.4-fold in susceptibility) was independently predictive of reduction in virologic failure (32). Even partial activity may be clinically useful when treatment options are limited (26).
There are ongoing efforts to develop clinical cutoffs for all approved ARV drugs, but some clinical cutoffs are difficult to establish as they are too close to the technical cutoff or the variability of the assay (33). When interpreting the results of phenotypic assay, the clinician should consider how each cutoff was derived (Table 11.2).
Genotypic Testing
The presence of resistance mutations by genotypic assays is identified by DNA sequencing or point mutation assays such as hybridization assays. Most diagnostic laboratories developed their own assays, which are referred to as home-brew assays. All genotypic assays require extraction of the virus genome, usually from the plasma specimen, then retrotranscription of the viral RNA in cDNA. Subsequently, the DNA is amplified in a single or nested PCR. Dideoxynucleotide sequencing is the standard approach to HIV genotyping (34).
Mutations in the nucleic acid sequence cause amino acid substitutions when messenger RNA (mRNA) is translated into protein. Some mutations are “silent mutations”; that is, the nucleic acid changes do not alter the amino acid sequence. Mutations are designated in a shorthand format using single-letter abbreviations for the amino acids encoded by a particular triplet of nucleotides (a codon). The normal, or wild-type, amino acid present at a particular location in a protein is given, followed by the location (amino acid position, or codon number), followed by the new amino acid that has replaced the wild-type amino acid. The designation L90M, for example, indicates that the amino acid methionine (M) has been substituted for the wild-type amino acid leucine (L) at position 90, which is one of the codons in the region that codes for the protease enzyme, and is designated PR. The region that codes for the reverse transcriptase enzyme is designated RT.
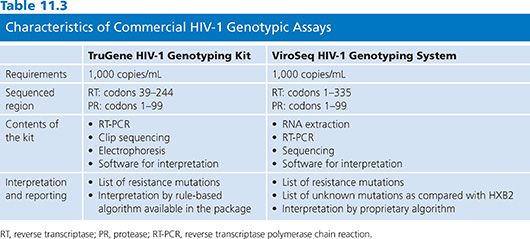
In 2001, a commercial HIV-1 RT and protease genotyping kit was approved by the FDA and European Medical Evaluation Agency (EMEA) for use in clinical settings. A second kit was FDA- and EMEA-approved in 2002 (Table 11.3). The advantages of using approved kits include standardization and consistency of results across laboratories, making them preferable to laboratory-developed tests (LDTs), previously known as home-brew tests in local laboratories with low experience in molecular biology. However, the commercial kits are more expensive and may not provide the flexibility of home-brew methods.
Overview of a Laboratory-Developed Test Sequencing Method: HIV-1 RNA Extraction, cDNA Synthesis, Amplification, and Sequencing
Genotypic Assays
The interactions between different mutations complicate the interpretation of genotypic assays. Mutations are designated by the wild-type amino acid present at a particular position of the RT or protease gene, followed by the amino acid position, then by the new amino acid that has replaced the wild-type amino acid. For example, M184V indicates that the methionine (M) wild-type amino acid at position 184 of the RT gene is replaced by the valine (V) amino acid. A large number of genotypic-resistance interpretation tools have been developed in recent years. These include mutation lists, rule-based algorithms, and interpretations based on databases correlating genotypes with corresponding phenotypic susceptibilities. The listing of mutations associated with resistance is available through the expert panel of International AIDS Society (IAS)-USA (http://www.iasusa.org) or Los Alamos National Laboratory (http://hiv-web.lanl.gov).
The interpretation of genotypic assays is based on interpretation systems called algorithms. They have the objective, in treated patients, to predict the response to each ARV according to the combination of mutations present on the RT and protease genes. More than 20 algorithms are available from different sources. Some algorithms are public and available on Web sites, such as the algorithms from Stanford University (http://hivdb.stanford.edu), the Rega Institute (http://www.kuleuven.ac.be), and the Agence Nationale de Recherches sur le Sida et les hépatites virales (http://www.hivfrenchresistance.org).
The early approach to interpreting genotypes was based on the in vitro correlation studies relating genotype with phenotype. However, recent data showed difficulty in determining reliable phenotypic cutoffs for some drugs such as stavudine, didanosine, and amprenavir (33,35). Correlation studies analyzing the virologic response in treatment-experienced patients according to the genotypic profile at baseline should provide the most relevant information for establishing algorithms. Such algorithms are still limited and available for some ARV drugs such as abacavir (36), stavudine (37,38), amprenavir (39), lopinavir (26,40,41) and tenofovir (28). The method issues for correlating baseline phenotype with virologic response also apply to analyses of baseline genotype and response. To build up such algorithms, a strict method is needed that is not standardized. Multivariate analyses must show the predictive value of the algorithm when there are confounding factors such as viral load at baseline, previous drug history, duration of past treatment, and new drugs in the regimen (42). Then the validation step must confirm that the algorithm is also predictive of the virological response in a different data set (37). These correlation studies are based on retrospective analyses of patients enrolled in therapeutic trials that are sometimes several years old. The accuracy of these algorithms depends on the prevalence of specific resistant mutations at baseline; some mutations, relevant to the resistance but underrepresented in the genotype profile, will be ignored by the algorithm.
No single study can be expected to provide a full picture of the relationship between genotype and response. The genotypic profile of patients is changing as new drugs become available that may select for previously unknown mutations. There is a need for wide-ranging databases containing appropriately quality-controlled data from genotypic resistance assays and international efforts to be developed to pool databases and to establish standardized analyses for constructing algorithms that need to be frequently refined.
Different reporting formats and interpretation systems are provided by the wide diversity of clinical virology laboratories providing HIV genotyping. Laboratories using home-brew assays have varied approaches to reporting the results. Some laboratories provide only a list of mutations, and understanding by clinicians is poor. In addition to listing each resistance mutation detected in RT and PR genes, the interpretation must be provided with the precise indication of the algorithm used.
Reports of genotypic resistance usually score virus isolates as “resistant,” “possible resistant,” or “no evidence of resistance.” Some algorithms classify patient isolates in four or five categories. Possible resistance corresponds to different situations according to the algorithm and the drugs: The detected mutations may have been associated with diminished virologic response in some but not all patients. This classification may also refer to a limited knowledge on resistance to this particular drug.
The use of expert advice in interpreting a genotype result has been shown to lead to a better choice in the alternative regimen compared with a regimen chosen in the absence of expert advice (43). Unfortunately, such expert advice is not always available. The role of the expert is to know the bases of the algorithm and to modulate the interpretation according to the clinical and immunologic parameters of the patient.
The discordances in interpretations seem to be drug-related, low for NNRTI, and more important for some ARVs such as stavudine, didanosine, abacavir, and amprenavir (44,45). Several studies retrospectively analyzed the relationship between the different interpretations of resistance genotypes by several algorithms and the outcome of salvage treatment in cohorts of drug-experienced patients (45,46). These studies show generally significant discordances between available algorithms that are associated with different predictions of subsequent virologic outcomes.
Virtual Phenotype
Another approach to interpreting genotype is employed by Virco (47). This company maintained a large proprietary database of specimens for which both genotype and phenotype are known for each drug. From this database, viruses with the same genotype as that of the patient’s virus are identified and the average IC50 of these matching viruses is calculated, estimating the likely phenotype of the patient’s virus. Several reports support the validity of the virtual phenotype for interpreting genotypes (48). However, the accuracy of the predicted phenotype depends on the number of database matches with the patient’s isolate. For the new or investigational agents, the system is delayed by the need to accumulate genotype–phenotype data; with the availability of new drugs and the selection of new mutations, the number of matches may decrease.
INTERPRETATION OF DRUG RESISTANCE ASSAYS: DISCORDANCES BETWEEN GENOTYPE AND PHENOTYPE RESULTS
Appropriate interpretation of the results of drug resistance testing is a challenging problem for both phenotype and genotype assays (12). These interpretation tools show variability, which may modulate the choice of drugs to be used and therefore affect the therapeutic outcome. More attention is being focused on the importance of a standardized approach to interpret resistance results. Interpretation of resistance testing and choice of new therapy must be performed in light of all clinical information, including past therapies, previous viral load and immunologic responses, adherence, tolerance, and toxicities. Previous resistance test results must be considered when available.
Several studies comparing phenotype and genotype results on a large number of clinical samples showed that discordances between results are not uncommon (49,50). The clinical usefulness of genotypic testing has been demonstrated in most prospective, randomized studies; in contrast, phenotypic testing has been shown to be clinically useful in a few prospective studies. Genotypic testing is also used more commonly than phenotypic testing because of its lower cost, wider availability, and shorter turnaround time. Unlike genotyping assays, phenotyping assays involving sophisticated laboratory procedures are not available as test kits for widespread distribution.
Genotypic testing may detect a single drug resistance mutation within a virus population that will affect the virologic response but will not reduce phenotypic drug susceptibility. For example, the Y181C mutation confers in vitro susceptibility to efavirenz (51) but is associated with absence of clinical response to this drug (52). Genotypic assays detect mutations present as mixtures even if the mutation is present at a level that is too low to affect drug susceptibility in a phenotypic assay and identify reversal mutations that do not cause phenotypic drug resistance but indicate the presence of previous drug pressure. Decreased phenotypic susceptibility to some drugs may be suppressed (resensitization) by other mutations in the sequence. In the presence of thymidine mutations that decrease susceptibility to zidovudine, the presence of M184V or L74V or K65R may restore the in vitro susceptibility to this drug. Such in vitro–increased susceptibility has not been proved to be clinically relevant.
Phenotypic testing in research settings is essential for establishing genotype-phenotype correlations, which provide the first bases for interpreting genotype tests and for designing new antiviral drugs that are effective against existing drug resistance strains.
Relationship of Genotype and Phenotype Results to Drug Levels
Virus drug susceptibility is likely to be a continuous phenomenon because of partial remaining activity of the drugs against mutant viruses and variability of drug exposure.
Data correlating drug concentrations with virologic response have been generated for most PIs and NNRTIs. The concept of inhibitory quotients (IQs) characterizes the relationship between drug exposure and drug susceptibility of the virus and is defined as the Cmin of drug divided by measure of resistance either by phenotype (IQ: Cmin/IC50), “virtual” phenotype (vIQ: Cmin/value of IC50 according to the virtual phenotype), or genotype (GIQ: Cmin/number of mutations). This concept has begun to be applied to prediction of response to PIs (53). The concept is particularly suitable for PIs that exhibit very large interindividual drug concentration variability. Although IQs have yet to be prospectively evaluated as a tool for managing HIV infection, they have been shown to be better predictors of virologic response in treatment-experienced patients receiving lopinavir boosted by ritonavir than plasma drug concentrations and/or resistance testing alone (53). The virtual IQ was the best predictor of viral load reduction in response to ritonavir boosting indinavir-based therapy in patients with ongoing viremia (54). The accurate adjustment of the in vitro–calculated IC50 to the in vivo protein binding remains to be determined. In PI-experienced patients receiving boosted amprenavir, the genotype IQ, using the Cmin measured at week 8 and the number of PI resistance mutations evaluated at baseline, was the best predictor of the virologic response at week 12 (55). These approaches need to be validated in prospective clinical trials.
Practical Considerations
All genotypic and recombinant phenotypic assays use initial amplification through reverse transcriptase polymerase chain reaction (RT-PCR) as the first step in the process. Because these assays require amplification of a larger segment of the HIV-1 genome than assays designed only to detect the presence of HIV-1 RNA, they are generally less sensitive than viral load assays and require samples with at least 1,000 copies per milliliter of HIV-1 RNA to obtain amplification from plasma, although amplification is possible in some samples at lower viral load.
Plasma is the main source of virus used for testing HIV-1 drug resistance in the clinical setting. Because the half-life of HIV-1 in plasma is approximately 6 hours, only actively replicating virus can be isolated from this source; thus, the sequence of plasma virus represents the quasispecies most recently selected by ARV drugs (56). Specialized testing for research purposes can use a variety of other tissue compartments such as cerebrospinal fluid, genital secretions, PBMCs, or lymph nodes.
Blood samples may be drawn in either EDTA or acid citrate dextrose vacutainers. Heparin must be avoided as it inhibits PCR reactions. Plasma separation should be performed within a maximum of 6 hours after blood collection. Sample volume consists of 1 to 3 mL of plasma that can be stored at −80°C. Samples taken for viral load should be stored frozen within the laboratory in order that retrospective resistance testing can be undertaken.
These tests are technically demanding, and external quality control is essential. This is addressed by national and international pathology laboratory accreditation programs. Laboratories undertaking resistance testing should provide clinical support to HIV clinics and demonstrate participation in external quality control programs and accreditation by national and international agencies. In addition to quality assurance of the assay, quality assurance of the laboratory performing the assay is also required. Currently, all the laboratories in the United States that perform genotyping or phenotyping assays must have certification according to the Clinical Laboratory Improvement Act (CLIA) 1988 indicating some level of review of the laboratory’s performance standard (CLIA Related Federal Register, FDA, 1995. Available at http://www.fda.gov/cdrh/clia/fr/hsq230n.html). In Europe, some hospital laboratories participate in proficiency testing programs for genotyping.
Drug costs are driving the overall total cost of HIV-1 care in developed countries. A National Institutes of Allergy and Infectious Diseases and Centers for Disease Control and Prevention (CDC)–funded study analyzed cost-effectiveness in genotypic resistance testing using an HIV-1 stimulation model of 1 million patients (57). The authors reported that the cost-effectiveness of genotypic resistance is similar or better than that of recommended interventions for HIV-1-infected patients, such as Mycobacterium avium complex prophylaxis.
There is large geographical variability in reimbursement of HIV drug resistance assays. Lack of or low levels of reimbursement may still limit access in some areas or countries. However, proper implementation of resistance assays may reduce the overall cost of patient management by prompting more appropriate choices in therapy and avoiding drugs that are likely to induce toxicities.
LIMITATIONS OF RESISTANCE TESTING
Quasispecies
Resistance testing has technical limitations. Both genotypic and phenotypic testing depends on PCR amplification of virus from plasma and therefore do not address the properties of different virus components (i.e., whole virus vs. viral genome alone). The likelihood of generating sufficient genome product to undertake further analysis depends on the starting concentration of virus. The nature of direct PCR sequencing techniques limits the detection of minority strains of virus within the plasma virus population to 20% (17,58–61). Smaller proportions of mutant virus may contribute to subsequent therapy failure and will not be detected. This component of the variable-limited portion of the virus population contributes to the concept of “quasispecies.” This limitation is particularly troublesome in patients with complicated treatment histories or in those who have discontinued one or more ARV drugs. To maximize the likelihood of identifying drug resistance mutations present within the virus population of a patient, it is important to analyze plasma samples for resistance testing before changing or discontinuing ARV therapy and to consider the patient’s treatment history when interpreting the results of resistance testing.
Direct PCR is done in clinical settings because it is quicker and more affordable than testing multiple clones individually. Clonal sequencing of individual strains is performed in research settings to answer questions about the pathways and evolution of HIV-1 drug resistance. Multiple quasispecies with distinct resistance genotypes coexist at any given time and some initially minority populations, with or without additional changes, can subsequently emerge as majority populations (62,63).
Cellular Reservoirs
The evolution of HIV-1 drug resistance mutations in proviral DNA in PMBCs lags behind that in plasma HIV-1 RNA. In patients with multiple virologic failures, proviral DNA may contain multiple archived mutations that are not present in plasma (64–67). Discrepancies in protease and RT resistance profiles have been described between plasma and other compartments such as cerebrospinal fluid or semen. The variable penetration of ARV drugs into sanctuary sites may contribute to the differential evolution of HIV and the emergence of drug resistance (68–70). However, the utility of sequencing virus from PBMC or from other sanctuary sites has not been evaluated in either prospective or retrospective clinical trials.
Non-B Subtypes
HIV-1 group M has evolved into multiple subtypes that differ from one another by 10% to 30% along their genomes. In North America and Europe, most HIV-1 isolates belong to subtype B. However, subtype B accounts for only a small proportion of HIV-1 isolates worldwide and non-B isolates are being identified with increasing frequency in Europe. Technically, primers used for RT, PCR, and sequencing may have a lower rate of annealing for non-B compared with subtype B templates. The performances of the different phenotypic and genotypic assays are currently being investigated. The ViroSeq HIV-1 genotyping system (Celera, Alameda, CA) was used to determine protease and RT sequences from a panel of 126 non-B subtypes isolates. Four specimens that could not be amplified included three subtype D isolates and one CRF02-AG isolate (71). The TruGene assay (Visible Genetics Inc, Toronto, Canada) using prototype 1.5 RT-PCR primers and the ViroSeq (Celera, Alameda, CA) assay were both successful for sequencing 34 non-B isolates, although five isolates (two belonging to subtype C, one to subtype B, one to subtype E, and one to subtype H) lacked double-strand sequence coverage in the ViroSeq assay (Celera, Alameda, CA) (72,73).
When mutation sequences were studied in subtype B and non–subtype B population, it was determined that all known subtype B resistance mutations were extant in the non-B subtypes and 80% were correlated with ARV treatment of patients with the non-B subtypes (74). Based on this conclusion, it appears reasonable to continue to focus on known subtype B resistance mutations for global monitoring of resistance.
It should be recognized that in general genotypic assays regardless of the methodologic approach can only detect known resistance-associated mutations. A concern with each genotypic methodology is that mutant variants may be present in the patient’s infection at low frequencies and may not be detectable so that mixtures of HIV-1 strains with minor sequence variations may not be distinguishable.
OUTLOOK: HIV AND ANTIRETROVIRALS
As resistance to ARVs is anticipated to be ongoing, there will be pressure to develop new drugs and approaches to therapy for HIV infection. Clearly, the testing methodology will be genotypic, with whole genome sequencing of the virus and interpretation and resistance testing being a key component.
HEPATITIS B: STRUCTURE OF THE VIRUS AND DISCUSSION OF ANTIVIRAL AGENTS
Hepatitis B virus (HBV) was the first of the hepatitis viruses to be discovered. Whereas infection during adulthood is frequently cleared, vertical transmission from mother to child leads to persistent infection. More than 350 million people worldwide are currently persistently infected with HBV and are at risk of developing liver cirrhosis and hepatocellular carcinoma (75).
The HBV is a noncytopathic, parenteral DNA virus. The outcome of HBV infection depends on the kinetics of the virus–host interaction and particularly on the strength of the innate and adaptive, humoral, and cellular immune response. Whereas patients with acute hepatitis B have a vigorous and polyclonal immune response to HBV antigens, individuals with chronic hepatitis B have a weak and restricted immune response to HBV (76). Studies demonstrated that the latent, immune-mediated clearance mechanisms become activated spontaneously in chronically infected individuals undergoing hepatitis B e antigen (HBeAg) clearance (77). In addition, it has been shown that immune clearance of HBV can occur via cytolytic as well as noncytolytic mechanisms (78).
The asymmetric replication of the HBV genome, via RT of an RNA intermediate, makes it prone to mutations. Although mutations can occur randomly along the HBV genome, the overlapping open reading frames (ORFs) limit the number and location of viable mutations. Viable variants are selected on the basis of replication competence of the virus, selection pressure from the host’s immune system, and in some instances, exogenous factors such as antiviral therapy. The divergence of HBV sequences results in HBV quasispecies, variants, and genotypes with epidemiologic and clinical significance.
Structure of Hepatitis B
Virions
The HBV is an enveloped virus containing 3.2-kb, partially double-stranded DNA contained in a relaxed circular genome; it is the prototype member of the family Hepadnaviridae (79), which includes genetically similar viruses that infect primates and monkeys, woodchucks and ground squirrels, and herons and ducks. Electron microscopic examination of the serum of a highly viremic carrier reveals three types of virus-associated particles. The HBV virion, which is 42 nm in diameter, comprises an outer envelope formed by the hepatitis B surface antigen (HBsAg). This envelope surrounds an inner nucleocapsid made up of the hepatitis B core antigen (HBcAg) that packages the viral genome and associated polymerase. Abundant spherical particles 17 to 25 nm in diameter in numbers up to 1013 per milliliter and less numerous tubular structures or filaments approximately 20 to 22 nm in diameter and of variable length in numbers up to 1011 per milliliter do not contain HBV DNA and thus are not infectious.
Viral Genotypes
There are currently seven recognized genotypes of HBV, designated A to G, that vary by 8% at the nucleotide level over the entire genome (80). The HBV genotype designation is based on the entire genomic sequence and thus is more reliable than the serologic subtype nomenclature that was used previously, which was based on the immunoreactivity of particular antibodies to a limited number of amino acids in the envelope protein. The relationship between the four major subtypes (adw, adr, ayw, and ayr) and genotypes has been determined (Table 11.4) (81).
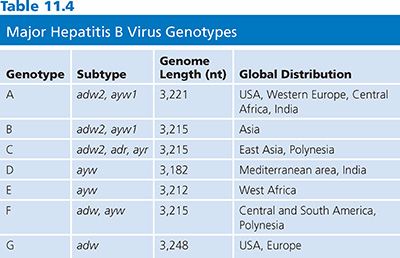
Important pathogenic and therapeutic differences do exist among HBV genotypes (82). For example, genotype C is associated with more severe disease than genotype B, and genotype D is associated with more severe disease than genotype A (83). Genotypes C and D are associated with a lower response rate to interferon therapy than genotypes B and A (81,83). Recombination between two HBV genotypes has been reported for genotypes B and C (84) and genotypes A and D (85), generating more diversity.
Genome and Common Mutants of Hepatitis B Virus
The genome of HBV is a partially double-stranded, relaxed, circular DNA molecule about 3,200 nucleotides (nt) in length (Fig. 11.2) (79). The two linear DNA strands are held in a circular configuration by a 226-base pair (bp) cohesive overlap between the 5′ ends of the two DNA strands that contain 12-nt direct repeats called DR1 and DR2 (79). All known complete HBV genomes are gapped and circular, comprising between 3,181 and 3,221 bases, depending on the genotype (see Table 11.4). Within the virion, the minus strand has a fixed length with defined 5′ and 3′ ends and a terminal redundancy of 8 to 9 nt (86). The minus strand is not a closed circle and has a nick near the 5′ end of the plus strand. The viral polymerase is covalently bound to the 5′ end of the minus strand. The 5′ end of the plus strand contains an 18-base-long oligoribonucleotide, which is capped in the same manner as mRNA (86). The 3′ end of the plus strand is not at a fixed position, so most viral genomes contain a single-stranded gap region of variable length ranging from 20% to 80% of genomic length that can be filled in by the endogenous viral DNA polymerase.
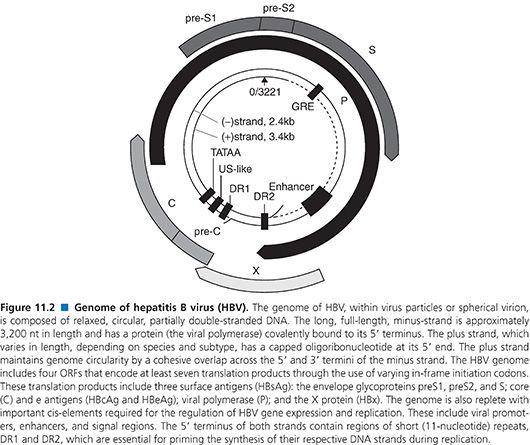
The minus strand contains four ORFs and carries all the protein-coding capacity of the virus (79). Importantly, these overlap in a frame-shifted manner with one another so that the minus strand is read one and a half times (79). The longest ORF encodes the viral polymerase (POL). The ORF for the envelope (PreS/S) genes is completely located within the POL ORF, and the ORF for the core (PreC/C) and X genes partially overlap with POL ORF. Thus, the HBV encodes more than one protein from one ORF by using multiple internal AUG codons within an ORF, creating additional start sites for protein biosynthesis. Nested sets of proteins with different N-termini are thus synthesized (80).
The HBV mutation frequency has been estimated to be approximately 1.4 to 3.2 × 10⁻⁵ nt substitutions per site per year, approximately 10-fold higher than for other DNA viruses (87). The HBV POL is an RT and lacks proofreading function. The mutation rate of HBV is also influenced by the clinical phase of the patients, such as immune tolerance versus immune elimination, and clinical settings such as immunosuppression and transplantation (88). The predominant HBV exists in an infected individual as the major population of the HBV quasispecies pool. The stability of the predominant HBV within this pool is maintained by particular selection pressures from the host’s immune system and the constraints imposed by the overlap in reading frames, viability, and replication competence of the virus. Furthermore, the magnitude and rate of virus replication are important, with the total viral load in serum frequently approaching 1011 virions per milliliter. Most estimates place the mean half-life of the serum HBV pool at about 1 to 2 days, so that the daily rate of the de novo HBV production may be as great as 1011 virions.
The high viral loads and turnover rates, coupled with poor replication fidelity, all influence mutation generation and the extent of the HBV quasispecies pool. Furthermore, the availability of “replication space” requires that the eventual takeover by a mutant virus depends on the loss of the original wild-type virus, which is itself governed by factors such as replication fitness and the turnover and proliferation of hepatocytes (89,90). Replication space can be understood in terms of the potential of the liver to accommodate new HBV covalently closed circular DNA molecules (cccDNA; Fig. 11.3). Synthesis of new cccDNA molecules can occur only if uninfected cells are generated by growth within the liver, hepatocyte turnover, or loss of cccDNA from existing infected hepatocytes (91,92). Thus, the expansion of a (drug-) resistant mutant in the infected liver can be possible only with the creation of new replication space.
Mutations in the Precore/Core Promoter, Precore, and Core Genes
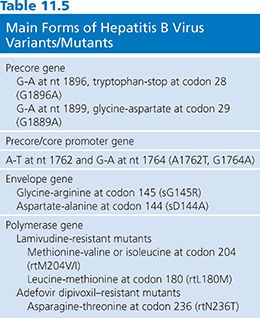
Two major groups of mutations have been identified that result in reduced or blocked HBeAg expression. The first group includes a translational stop codon mutation at nt 1896 of the precore gene (93). The second group of mutations affect the precore/core (pre-C/C) promoter, also called basic core promoter, at nt 1762 and nt 1764, resulting in a transcriptional reduction of the pre-C/C mRNA (Table 11.5).
The single-base substitution (G-to-A) at nt 1896 gives rise to a translational stop codon (TGG to TAG) in the second last codon (codon 28) of the precore gene located in the epsilon (ε) structure. The ε structure is a highly conserved stem loop structure, with the nt G1896 forming a base pair with nt 1858 at the base of the stem loop. In HBV genotypes B, D, E, G, and some strains of genotype C, the nt 1858 is a thymidine (T). Thus, the stop codon mutation created by G1896A (T-A) stabilizes the ε structure. In contrast, the precore stop codon mutation is rarely detected in HBV genotype A, F, and some strains of HBV genotype C, as the nt at position 1858 is a cytidine (C), maintaining the preferred Watson-Crick (G-C) base pairing.
Three other mutations (at nt positions 1817, 1874, and 1897) that cause truncations in HBeAg have been reported (88). In addition, changes that affect the initiation codon at nt 1814, 1815, and 1816 have been described. The mutation at G1899A is frequently detected in association with the precore stop mutation of G1896A. Early studies implicated the HBV precore stop codon mutant, leading to HBeAg negativity, as a possible virulence factor for severe liver disease and fulminant hepatitis B (94,95). However, this strain has also been found in asymptomatic carriers (96).
The pre-C/C promoter mutations, such as A1762T plus G1764A, may be found in isolation or conjunction with precore mutations, depending on the genotype (see Table 11.5). The double mutation of A1762T plus G1764A results in a decrease in HBeAg production of up to 70% (97). This mutant strain display reduced binding of liver-specific transcription factors, resulting in less pre-C/C mRNA transcripts and thus less precore protein. However, this mutation does not affect the transcription of pregenomic RNA (pgRNA) or the translation of the core or polymerase protein. Thus, by removing the inhibitory effect of the precore protein on HBV replication, the pre-C/C promoter mutations appear to enhance viral replication by suppressing pre-C/C mRNA relative to pgRNA (97). As with the precore mutations, the pre-C/C promoter mutations have not been conclusively identified as a potential virulence marker.
The core gene possesses both B cell and cytotoxic T-lymphocyte epitopes, and for the virus to persist in the infected host, during the elimination phase of hepatitis B, escape mutations within those epitopes are readily selected (88,97). Akarca and Lok (98) have demonstrated that the frequency of core gene mutations is associated with the presence of precore stop codon mutations, HBeAg negativity, and active liver disease.
Mutations in the X Gene
Mutations in the X region can involve the regulatory elements that control replication such as the pre-C/C promoter and the enhancer 1. Because the pre-C/C promoter encompasses nt 1742 to 1802 and overlaps with the X gene in the concomitant reading frame, the A1762T plus G1764A pre-C/C promoter mutations also change in the X gene at xK130M and xV131I. A novel class of HBx mutants has been found in patients with hepatocarcinoma exhibiting increased clonal outgrowth and decreased apoptosis, implying a possible role in hepatocarcinogenesis (99).
Mutations in the Envelope Gene
Most hepatitis B vaccines contain the major HBsAg, and an immune response to the major hydrophilic region induces protective immunity. Mutations in this epitope have appeared under pressure generated by vaccine-induced antibodies (100). In addition, mutations have been detected after treatment of liver-transplant patients with hepatitis B immunoglobulin (101). Most isolates have a mutation from glycine to arginine at residue 145 of HBsAg (sG145R) or aspartate to alanine at residue 144 (sD144A) (see Table 11.5). The former mutation has been shown to evade the known protective anti-HBs response.
Viral Life Cycle
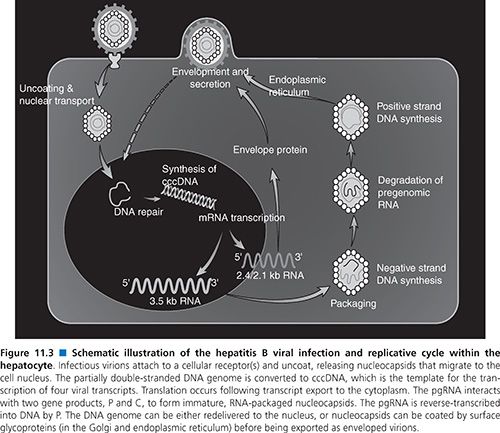
An understanding of the HBV life cycle is crucial for the identification of potential antiviral targets (102,103). HBV replication begins when the virion attaches to an as yet unidentified receptor on the hepatocyte surface (see Fig. 11.3). Following viral entry, the virus uncoats and is transported to the nucleus where the relaxed circular genome is converted by the host cellular machinery to the cccDNA; the cccDNA is, in turn, organized into viral minichromosomes. This key replicative intermediate is the transcriptional template for production of the various HBV RNAs, including the pgRNA, that are necessary for viral replication and represents one of the major obstacles in the development of effective treatments for the control of HBV infection. Transcription of the 3.5-kb pgRNA serves three important roles. First, its translation leads to production of the core and POL proteins. Second, it participates in the nucleocapsid packaging reaction, the specificity of which is provided by a unique stem-bulge-stem structure known as epsilon (ε) on the 5′ and 3′ ends of the pgRNA (104). Following translation of the pgRNA, the POL protein binds to the 5′-end ε. Host proteins such as heat shock protein 90 (Hsp90) stabilize this POL–ε interaction (104). The cis-translated core proteins dimerize around the pgRNA-pol complex and self-assemble to form viral nucleocapsids (105).
Once packaged into a nucleocapsid, the pgRNA serves its third and most important role as the template for reverse transcription and DNA synthesis. The POL protein is bound to the 5′ ε structure and acts as its known primer for initiation and synthesis of the first three nucleotides of the negative-strand DNA (102,103). This nascent DNA is then translocated to the 3′ end of the pgRNA where it binds to the complementary sequence within a 12-nt region known as direct repeat 1 (DR1). From here, negative-strand DNA synthesis proceeds and the RNase H activity of the POL protein degrades all but the last few nucleotides of the template pgRNA. This RNA oligomer is translocated to the 3′ copy of the 12-nt repeat known as DR2, from which point positive-strand DNA synthesis begins. Elongation of the positive-strand DNA proceeds to the 5′ end of the negative strand where a third strand transfer occurs. This is facilitated by a short redundancy (r) in the negative-strand DNA template, which anneals to the r region on the 5′ end positive-strand DNA, thereby circularizing the genome (102,103). Premature termination of the positive-strand DNA synthesis by the POL protein results in the characteristic partially double-stranded genome. The HBV nucleocapsid containing the partial double-strand DNA is either recycled back to the nucleus to increase the supply of cccDNA, or undergoes further processing in the endoplasmic reticulum and Golgi for virion assembly. Mature virions are subsequently exported from the cell via the constitutive secretory pathway.
Antiviral Drugs
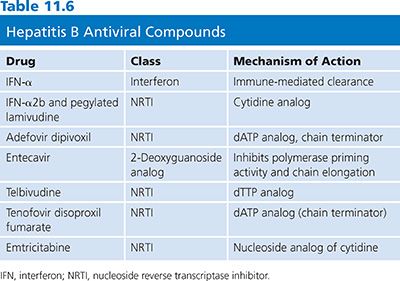
Success in HIV drug development in the 1990s revolutionized treatment of hepatitis B. Several antiviral agents that were developed for the treatment of HIV infection proved to be effective in inhibiting HBV replication. Several therapeutic interventions are now available encompassing five nucleoside analogs: 2′,3′-dideoxy-3′-thiacytidine (3TC), adefovir dipivoxil, telbivudine, tenofovir, and entecavir. All treatments have limited long-term efficacy. Although there have been few direct comparison trials, the short-term efficacy for both HBeAg-positive and HBeAg-negative hepatitis B appears comparable; factors predictive of response are similar. Thus, the advantages and disadvantages of each treatment, the durability of response, and the patient’s preference must be carefully weighed before a decision is made (106).
The review of the HBV life cycle reveals that apart from reverse transcription, most viral processes depend on host cell machinery. The most important of these is the generation and persistence of cccDNA. Conventional antiviral inhibitors of viral DNA synthesis such as nucleoside/nucleotide analogs (Table 11.6) can prevent or reduce the development of new molecules of cccDNA. However, successful elimination of the existing pool of hepadnaviral cccDNA has only been achieved by either a noncytolytic T helper type 1 (Th1) immune response (107,108) or immune-mediated cell killing followed by hepatocyte division (109,110). In this context, it is important to note that treatment of hepatitis B with nucleoside analogs can result in the partial restoration of specific immunoresponsiveness, which appears necessary for durable host-mediated control of infection (111). Thus, the concept of successful therapy for hepatitis B is converging on the use of both antiviral and immunomodulating approaches. In this chapter, the focus is on antiviral drugs.
Evaluation of Drug Efficacy
The major role of serum HBV DNA assays in patients with hepatitis B is to assess HBV replication and candidacy for antiviral therapy. Quantitative HBV DNA testing in serum is also important in assessing the response to antiviral treatment. Historically, the molecular assays for HBV DNA detection and quantification were not well standardized. However, over the past several years with the onset of real-time PCR, there have been significant advances. Several commercial “cleared” (approved) assays using real-time PCR or transcription-mediated amplification (TMA) from five different manufacturers have become available. The lower limit of detection (LLOD) ranges from 6 to 30 IU/mL of HBV with the upper end of the dynamic range at 8.0 log10 IU/mL. These assays have been reviewed by Valsamakis (112) and more recently by Chevaliez and colleagues (113) detailing LLODs and dynamic ranges.
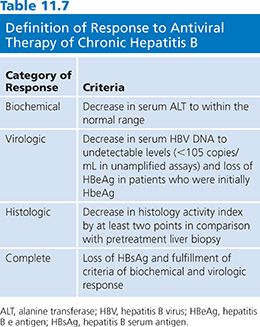
A National Institutes of Health workshop on the management of hepatitis B proposed that the definitions and criteria of the response to antiviral therapy of hepatitis B be standardized. An arbitrary value of more than 105 viral copies per milliliter has been chosen as a diagnostic criterion for hepatitis B (106). However, this definition is not perfect. The proposal categorized responses as biochemical, virologic or histologic, and as on-therapy or sustained off-therapy (106) (Table 11.7).
As for HIV-1, both phenotypic and genotypic assays have been used to characterize HBV drug resistance mutations. Various phenotypic methods have been studied; several are reviewed by Shaw et al. (114). In methods involving the development of point mutations associated with drug resistance, the phenotype is deduced by comparing replications of cell lines with or without mutations in the presence/absence of drugs. As with HIV-1, virtual phenotyping has been established that correlates patient clinical results with viral mutational data to assign a viral phenotype (114). Known mutations associated with resistance to HBV antiviral compounds are discussed by Chao and Hu (115).
Lamivudine and Virogram
Hepadnaviruses replicate through an RNA template that requires RT activity. HBV DNA polymerase was shown to share homologies with the RT from retroviruses. Inhibitors for RT of oncogenic RNA viruses may suppress HBV DNA replication. Lamivudine (Epivir) is the minus enantiomer of 3TC. It was developed as an RTI for use in HIV infection. Lamivudine has been shown to be a potent inhibitor of HBV replication in 2.2.15 cells (116). The 2.2.15 cells were clonal cells derived from Hep G2 cells that were transfected with a plasmid containing HBV DNA. These cells secreted hepatitis B virions. The 2.2.15 cells were maintained in minimal essential medium supplemented with 10% (vol/vol) fetal bovine serum (FBS). Cells were incubated at 37°C in a moist atmosphere containing 5% CO2/95% air. The 2.2.15 cells were inoculated at a density of 3 × 10⁵ cells per 5 mL in a 25-cm2 flask.
The drugs studied were added to the medium 3 days after the inoculation. Cells were grown in the presence of drugs for 12 days with changes of medium every 3 days. After incubation, the medium was centrifuged (10 minutes at 2,000 × g) and polyethylene glycol (Mr, 8,000) was added to the supernatant to a final concentration of 10% (wt/vol). The virus was pelleted (10 minutes at 10,000 × g). The pellet was resuspended at 1% the original volume in TNE (10 mM Tris HCl, pH 7.5/100 mM NaCl/1 mM EDTA). The suspension was adjusted to 1% sodium dodecyl sulfate (SDS) and proteinase K at 0.5 mg/mL and incubated for 2 hours at 55°C. The digest was extracted with phenol/chloroform, 1:1 (vol/vol), and the DNA was precipitated with ethanol. The DNA pellet was dissolved in TE80 (10 mM Tris-HCl, pH 8.0/1 mM EDTA) and then electrophoresed in a 0.8% agarose gel followed by blotting onto Hybond-N membrane. The blot was hybridized with a 32P-labeled HBV DNA (Bam HI insert from plasmid pam6; American Type Culture Collection [ATCC]) probe, washed twice with standard saline citrate (SSC)/0.2% SDS at room temperature for 1 hour and 0.1 × SSC/0.2% SDS at 55°C for 30 minutes, and then autoradiographed. The intensity of the autoradiographic bands was quantified by a scanning densitometer. HBID50 was defined as the drug concentration that inhibited HBV viral DNA yield in the medium by 50%. The values were obtained by plotting percentage inhibition compared with control versus the drug concentration.
No cell growth retardation or effects on mtDNA was observed after the administration of lamivudine at concentrations at least 100 times higher than concentrations that completely block HBV replication. Lamivudine did not affect the integrated HBV DNAs. Since the RNA replicative intermediates are transcribed from the integrated DNA, it is not surprising that HBV-specific transcripts were not affected by drug treatment. Thus, interruption of drug treatment resulted in a return of HBV virus to intra- and extracellular populations (116). Lamivudine is phosphorylated in vivo to the active triphosphate (3TC-TP) that competes with deoxycytidine triphosphate (dCTP) for DNA synthesis. It inhibits DNA synthesis by terminating the nascent proviral DNA chain.
Emergence of the YMDD mutation was associated with duration of therapy. Sixty-seven percent of patients who received lamivudine for 4 years showed evidence of the YMDD mutation, 40% of patients showing evidence after 104 weeks, 31% of patients showing evidence between weeks 52 and 104, and 14% showing evidence after 52 weeks (117,118). Drug resistance can be detected as early as 49 days after taking lamivudine (119), but clinical evidence (phenotypic expression) of drug resistance, which is indicated by a rise in serum alanine transferase (ALT), does not occur before 6 months. Mutations in the catalytic polymerase/RT domain of the gene for HBV polymerase have been associated with lamivudine resistance in patients receiving treatment for HBV infection (120). This is one of the four functional domains of HBV polymerase, which also possesses a priming region, a spacer domain, and a region with ribonuclease H activity (91). The identification of several regions of conserved sequences within the polymerase/RT domain has led to its further subdivision into subdomains A to F. A sequence of four amino acids within the C subdomain consisting of tyrosine (Y) followed by methionine (M) and two aspartic acid (D) residues is highly conserved among viral polymerase/RTs. Termed the YMDD motif, it is essential for polymerase activity because of its involvement in binding nucleotide substrates in the catalytic site (120). Lamivudine resistance has been associated with substitution of isoleucine (I) or valine (V) for methionine in the YMDD motif at position 552 (rtM204I/V) of HBV polymerase/RT (see Table 11.5) (121). In vitro assays have confirmed that the YMDD motif mutations conferred reduced susceptibility of HBV to lamivudine (120,122). However, in vitro experiments also suggested that YMDD mutant HBV had reduced replicative efficiency in the absence of lamivudine, compared with wild-type HBV (120).
In most cases, YMDD mutations occur in combination with an additional mutation in the B subdomain rtL180M (L528M) that is located in the catalytic site near the YMDD motif in the three-dimensional model of HBV polymerase. The combined L528M/M552I or L528M/M552V mutations have been shown to restore the in vitro viral replication capacity of HBV containing YMDD motif mutations (120). These data reaffirm the growing body of clinical data indicating that patients who develop lamivudine-resistant HBV undergo rebound in serum HBV DNA that returns to level similar to those seen prior to therapy with lamivudine (123). Modeling suggests that mutation of the YMDD motif methionine at position 552 to valine or isoleucine causes steric hindrance between the methyl group on the β-branched side chain of valine/isoleucine and the sulfur atom in the unnatural L-oxathiolane ring of lamivudine (91,121). Besides reducing the strength of binding of lamivudine to the polymerase, steric hindrance results in a different orientation of the inhibitor when bound to the mutant enzyme that reduces the efficiency of incorporation of lamivudine triphosphate into replicating viral DNA. Resistance because of steric hindrance may be a problem common to all L-nucleosides (91). These mutations do not affect binding of the natural substrate dCTP to the same degree because the deoxyribose ring is in the natural D-configuration. Thus, the effect on natural substrates is small compared with the effect on lamivudine, and the polymerase enzyme can preserve a significant, but decreased, level of activity (121).
Adefovir Dipivoxil
Adefovir dipivoxil is an oral prodrug of adefovir (9-[2-phosphonylmethoxyethyl] adenine, PMEA), a phosphonate nucleotide analog of adenosine monophosphate. It is an acyclic nucleoside phosphonate (ANP) compound (124). The antiviral effect of the ANP analogs is the result of a selective interaction of their diphosphate metabolite with the viral DNA polymerase. Based on the structural resemblance to natural deoxynucleoside triphosphates (i.e., dATP in this case), this diphosphate metabolite acts both as a competitive inhibitor and an alternative substrate during the DNA polymerase reaction. PMEA inhibited HBV release from human hepatoma cell lines Hep G2 2.2.15 and HB611 cells (transfected with human HBV) (125). The cells were seeded in 25 cm2 tissue culture flasks (Costar, Sigma-Aldrich, St. Louis, MO) at a density of 4 × 10⁴ cells/cm2 in Dulbecco’s modified Eagle minimum essential medium (EMEM) supplemented with 2 mmol/L L-glutamine (Flow Laboratories, Rockville, MD), garamycine (40 µg/mL), amphotericin B (2.5 µg/mL), the neomycin analog G418 (360 µg/mL for HepG2 cells; 200 µg/mL for HB611 cells), and 10% FBS. Medium was changed every 3 days. When cells reached confluency at day 6, FBS concentration was reduced to 2%. Cell cultures were maintained in 5% CO2 atmosphere at 37°C. At day 3, the culture medium was supplemented with various concentrations of PMEA. Cell culture supernatants and cells were harvested at day 12 and subjected to HBV DNA and HBsAg analysis.
The 50% cytotoxic concentration of PMEA was determined in 24-well tissue plates (cell density: 4 × 10⁴ cells/cm2) by inhibition of [3H]methyl-dThd incorporation during 24 hours starting at 3 days after seeding. HBsAg secretion was inhibited by PMEA in a concentration-dependent manner in HB611 cells. Moreover, in congenital duck hepatitis B virus (DHBV)–infected ducklings, PMEA at a dose of 30 mg/kg/day was found to affect a marked decrease in DHBV DNA (122). PMEA has been found to have immunostimulating effects in mice, reflected by the induction of interferon (mainly α/β) and a significant enhancement of natural killer cell activity (126,127). The interferon levels induced by PMEA, given for 5 consecutive days at a dose of 25 mg/kg−1, were comparable with those achieved with the known interferon-inducer poly I:C. The natural killer enhancement by PMEA appeared to be coupled, at least in part, to interferon production. However, cytokines other than interferon may be involved, since prolonged administration of PMEA (5 mg/kg/day for 20 days) resulted in sustained natural killer enhancement in the absence of interferon production.
In two phase III clinical studies, although mutations in the polymerase sites of HBV had been described (rtS119A, rtH133L, rtV214A, rtH234Q) in 4 of 271 patients treated with adefovir dipivoxil for 48 weeks, no adefovir resistance mutations were identified in this large group of hepatitis B patients (128). However, in 1 patient during the second year of treatment with adefovir dipivoxil, the rise of HBV DNA and the exacerbation of liver disease led to the identification of a novel asparagine-to-threonine mutation at residue rt236 in domain D of the HBV polymerase (see Table 11.5). In vitro testing of a laboratory strain encoding the rtN236T mutation and testing of patient-derived virus confirmed that the rtN236T substitution caused a marked reduction in susceptibility to adefovir dipivoxil (129).
Resistance to adefovir dipivoxil is significantly less common than for lamivudine. The emergence of resistance to adefovir dipivoxil appears to be delayed and infrequent. Adefovir is an acyclic nucleotide analog and is smaller than the bulkier oxathiolanes (121). Molecular modeling studies suggest that adefovir can be accommodated more effectively in the more constrained and “crowded” deoxynucleoside triphosphate-binding pocket that carries the rtM204V/I mutations (129). Finally, the adefovir-resistant HBV was sensitive to lamivudine (130).
Entecavir
Entecavir, a cyclopentyl guanosine analog, is a potent inhibitor of HBV DNA polymerase, inhibiting both the priming and elongation steps of viral DNA replication (106,131,132). Entecavir is phosphorylated to its triphosphate, the active compound, by cellular kinases. It is a selective inhibitor of HBV DNA. It has little or no inhibitory effect on the replication of other DNA viruses such as herpes simplex, CMV, and RNA viruses such as HIV. Entecavir is also effective against lamivudine-resistant mutants but less effective than against wild-type HBV (131,133,134). In an in vitro assay using Hep G2 2.2.15 human liver cells, the EC50 for entecavir was 0.00375 µM compared with 0.116 µM for lamivudine. Therefore, entecavir is 30 times more potent than lamivudine in suppressing viral replication. In woodchucks with chronic woodchuck infection, doses of 0.1 mg/kg of entecavir reduced woodchuck hepatic virus (WHV) titers by 7 logs (135). In addition, after 14 months of entecavir therapy, viral core antigen, WHV, and cccDNA were undetectable in liver biopsy samples of nine WHV tested (136). There is also a decrease of the incidence of hepatocellular carcinoma and an increase of survival in treated WHVs as compared with untreated WHVs.
Entecavir has been evaluated in phase I/II clinical studies. The viral dynamics during and after entecavir therapy were studied in a small number of patients with hepatitis B receiving different doses of entecavir ranging from 0.05 to 1.0 mg/day of entecavir. The median effectiveness in blocking viral production was 96%. The median half-life of viral turnover was 16 hours and the median half-life of infected hepatocytes was 257 hours (10.7 days). Rebound of viral replication also followed a biphasic return to baseline levels (137). During short-term therapy, entecavir seems to show stronger antiviral activity than lamivudine, but this assumption should be validated by head-to-head studies. In addition, entecavir shows continuous activity in patients with detectable lamivudine-induced mutant virus (138).
Until now, no entecavir-resistant viral mutants have been described (132). Prolonged therapy as well as prophylactic therapy, for example, in liver-transplant recipients, is feasible and not limited by breakthrough infections. Different ongoing multicenter phase III studies are currently evaluating the efficacy and safety of entecavir in HBeAg-positive and HBeAg-negative patients and in patients resistant to lamivudine. These studies are comparing entecavir with lamivudine for 48 weeks with extended treatment (96 weeks).
Emtricitabine and Tenofovir
Emtricitabine (FTC) is a cytosine nucleoside analog with antiviral activity against both HBV and HIV. It differs from lamivudine in having a fluorine at the 5-position of the nucleic acid. In a pilot study, five different doses of FTC were evaluated (25, 50, 100, 200, and 300 mg daily for 8 weeks) in 49 patients with HBeAg-positive hepatitis B (106,139). At the end of treatment, serum HBV DNA decreased by 2 to 3 logs in patients receiving the higher doses.
Phase III clinical trials are underway to determine the long-term safety and efficacy of FTC. However, the role of FTC in the treatment of hepatitis B may be limited by its structural similarity to lamivudine and hence the potential for cross-resistance and the development of HBV drug-resistant mutants.
Tenofovir is a nucleotide analog approved for the treatment of HIV infection. It has in vitro activity against both wild-type and lamivudine-resistant HBV (140). A report of five patients with HBV and HIV coinfection demonstrated a 4 log10 drop in HBV DNA levels during 24 weeks of treatment (141).
β-L-Nucleosides
The natural nucleosides in the β-L-configuration (β-L-thymidine (L-dT), β-L-2-deoxycytidine (L-dC), and β-L-2-deoxyadenosine [L-dA]) represent a newly discovered class of compounds with potent, selective, and specific activity against hepadnavirus. In vitro studies have shown that these compounds are not active against other viruses such as herpes viruses or HIV, but these compounds have marked effects on HBV replication. It is not yet clear if these compounds are active against lamivudine-resistant HBV mutants (106,142–145).
L-dT is at the most developed stage of clinical investigation and has a remarkably clean preclinical toxicology profile. So far, it does not have mitochondria toxicity and it appears not to be mutagenic. After 1 year of therapy, antiviral activity was significantly greater for L-dT compared with lamivudine, and ALT normalization was greatest for L-dT monotherapy (146). Combination therapy of L-dT and lamivudine was not more efficacious than L-dT alone.
Another promising β-L-nucleoside compound is Val-L-dC. Preliminary results in phase I/II testing indicate substantial antiviral activity with a good safety profile (106).
Combinations of β-L-nucleoside appear to have additive or synergistic effect against HBV. In vitro studies and animal testing showed that there is no evidence of cellular or mitochondrial toxicity. The combination of L-dT and Val-L-dC was analyzed in a woodchuck study. Over a 12-week treatment period, the combination of L-dT and Val-L-dC cleared WHV DNA in all of the five animals tested with no significant side effects noted.
Other Antiviral Drugs
Several compounds have been developed that have a mechanism of HBV inhibition that is unrelated to the viral polymerase. The first of these are the phenylpropenamide derivates, AT-61 and AT-130. King et al. (147) showed that AT-61 did not affect total HBV RNA production or HBV DNA polymerase activity but did significantly reduce the production of encapsidated RNA. Importantly, both AT-61 and AT-130 have identical antiviral activity against wild-type strains as well as a number of different lamivudine-resistant strains of HBV (148). In vitro studies using AT-130 showed significant inhibition of the production of encapsidated HBV RNA but had no effect on total HBV RNA and did not affect core protein or nucleocapsid production, indicating an interference with the encapsidation process itself (149). Steric inhibition or interaction with the host cell chaperone proteins such as Hsp90 may be a possible mechanism. Phenylpropenamides are not water soluble and have very low bioavailability. Their future successful development as antiviral agents will depend on overcoming potential toxicity and medicinal chemistry issues.
A second class of compounds, the heteroaryldihydropyrimidines, are also potent nonnucleoside inhibitors of HBV replication both in vitro and in vivo (150). The heteroaryldihydropyrimidine compounds include the candidate molecule Bay 41–4109 and congeners Bay 38–7690 and Bay 39–5493. Exposure of HBV-infected cells to Bay 41–4109 resulted in increased degradation of core protein through improper formation of viral nucleocapsids. These heteroaryldihydropyrimidine compounds were shown to have efficacy against HBV in the HBV-transgenic mouse model and to possess suitable preclinical pharmacokinetic and toxicologic profile (150). Their novel mechanism of action and highly specific antiviral activity indicates that future clinical studies may be warranted.
A third compound, LY582563, is a 2-amino-6-arylthio-9-phosphonomethoxyethylpurine bis (2,2,2,-trifluoro-ethyl) ester, a novel nucleotide analog derivative of phosphonomethoxyethyl purine. It belongs to a structural class that is similar to adefovir. This compound has excellent antiviral activity against HBV with a good preclinical toxicity profile (151). It is also effective against lamivudine-resistant HBV (152). Its mechanism of action and early clinical development are under investigation.
Outlook: Hepatitis B Therapies
The long-term success of therapy for hepatitis B depends on safe, effective suppression of HBV replication for a long period of time without giving rise to resistant viral strains. As the long-term efficacy of current therapy for hepatitis B is limited, the patient’s age, severity of liver disease, and likely response must be weighed against the potential for adverse events and complications before treatment is initiated. Recommendations for the management of patients with hepatitis B have been recently published by an international panel (153).
In the past several years, the treatment of hepatitis B has been improved. It is now possible to contemplate combination therapy for hepatitis B. The future question is which agents to combine: two or more nucleoside/nucleotide analogs or antiviral agents plus immunomodulatory drugs. A recent report reviews several alternative rescue therapies for chronic hepatitis B (115).
Gene therapy is defined as the introduction of new genetic material into a target cell with a therapeutic benefit to the individual represents a novel approach (154). Several genetic antiviral strategies including ribozymes, antisense oligonucleotides, interfering peptides or proteins, and therapeutic DNA vaccine have been explored for the molecular therapy of hepatitis B (154,155). A novel molecular strategy that holds promise is the use of small interfering RNAs (siRNA). RNA interference is a cellular process of sequence-specific gene silencing in which small duplexes of RNA target a homologous sequence for cleavage by cellular ribonucleases (156). The introduction of approximately 22-nt siRNAs into mammalian cells can lead to specific silencing of cellular mRNAs without induction of the nonspecific interferon responses that are activated by longer RNA duplexes. Posttranscriptional gene silencing mediates resistance to both endogenous, parasitic, and exogenous pathogenic nucleic acids and can regulate the expression of protein-coding gene (156). This approach has been successfully applied to HBV (157). The siRNA molecules dramatically reduced virus-specific protein expression and RNA synthesis, and these antiviral effects were independent of interferon. Although this approach holds great promise, issues such as gene delivery, stability, toxicity, resistance, and safety need to be resolved.
HEPATITIS C VIRUS INFECTION: VIROLOGY AND CULTURE SYSTEMS FOR ANTIVIRAL DRUG STUDIES
Hepatitis C virus (HCV) is a major pathogen, harbored by over 250 million people worldwide, with a 70% risk of chronic infection for contaminated individuals (158). Chronic hepatitis may lead not only to limited histologic lesions in 20% of patients but also to severe fibrosis and cirrhosis. Complications arising from chronic HCV infection include the development of cirrhosis, end-stage liver disease, and hepatocellular carcinoma. Among the latter, at least 30% will develop hepatocellular carcinoma in the following 20 years (158,159). Accordingly, complications arising from chronic HCV are the leading cause of death from liver disease and the most common indication for liver transplantation throughout the world. Although recent progress has been made in the knowledge of the HCV life cycle, thanks to new experimental tools such as selectable subgenomic replicons, we are still limited in our understanding by the lack of an efficient cell culture system and of an easy-to-use animal model (160). Consequently, the identification of new therapeutic targets is particularly difficult. Interferon-α (IFN-α) and ribavirin have been the mainstay of available therapies for chronic HCV infection for years. Therapeutic results may appear disappointing as, at best, 50% of the treated patients will have undetectable HCV viremia when these drugs are used in combination therapy (161).
Therapeutic improvements resulted from the progression of using standard IFN-α monotherapy to pegylated interferons coupled with ribavirin when measured in the rates of sustained virologic response (SVR). Despite these improvements, the rates of cure in genotype 1 infection remained around 40% to 50% for treatment-naive individuals with poorer outcomes for African Americans, individuals with cirrhosis, prior treatment failure, and HIV coinfection (162–165).
Ongoing research in the elucidation of the HCV life cycle and crystal structures of several viral proteins has broadened the development of drug targeted at specific points in the HCV life cycle (166–169) (Table 11.8). Specifically, it has been the nonstructural (NS) protein required for ongoing viral replication and spread that have been the primary targets of drug development. Direct-acting antiviral agents (DAAs), which include NS3/4A PIs, replication complex inhibitor (NS5A), and NS5B polymerase inhibitor, have been developed (see Table 11.8). Additionally, agents that target host protein involved in viral replication have been studied
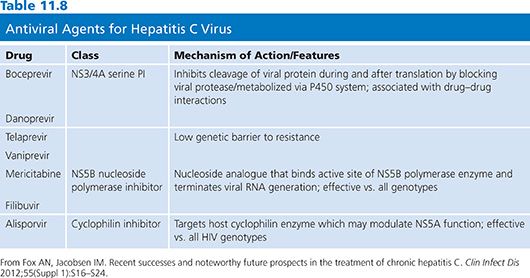
Stay updated, free articles. Join our Telegram channel

Full access? Get Clinical Tree


