Alterations in Oxygen Transport
Marie L. Kotter and Susan G. Trevithick
Key Questions
• What factors are necessary for normal red blood cell production?
• How are oxygen and carbon dioxide transported in the circulation?
• How are laboratory tests used to detect anemia and polycythemia?
• What are the general effects of anemia on body systems?
• What are the appropriate treatment measures for each of the common types of anemia and polycythemia?

http://evolve.elsevier.com/Copstead/
Blood is a critical body fluid composed of formed elements and cells suspended in plasma that circulates through the cardiovascular system. As the primary transport system of the body, blood is involved in the physiologic and pathologic activities of all organs. The red blood cell (RBC), or erythrocyte, is essential to oxygen transport within the circulatory system. Red blood cells contain large numbers of hemoglobin molecules, which are designed to move oxygen efficiently from the lungs to other body tissues. Hemoglobin also aids in acid-base balance. In addition, RBCs carry carbon dioxide wastes away from the cells and back to the lungs for expiration.
Composition of Blood
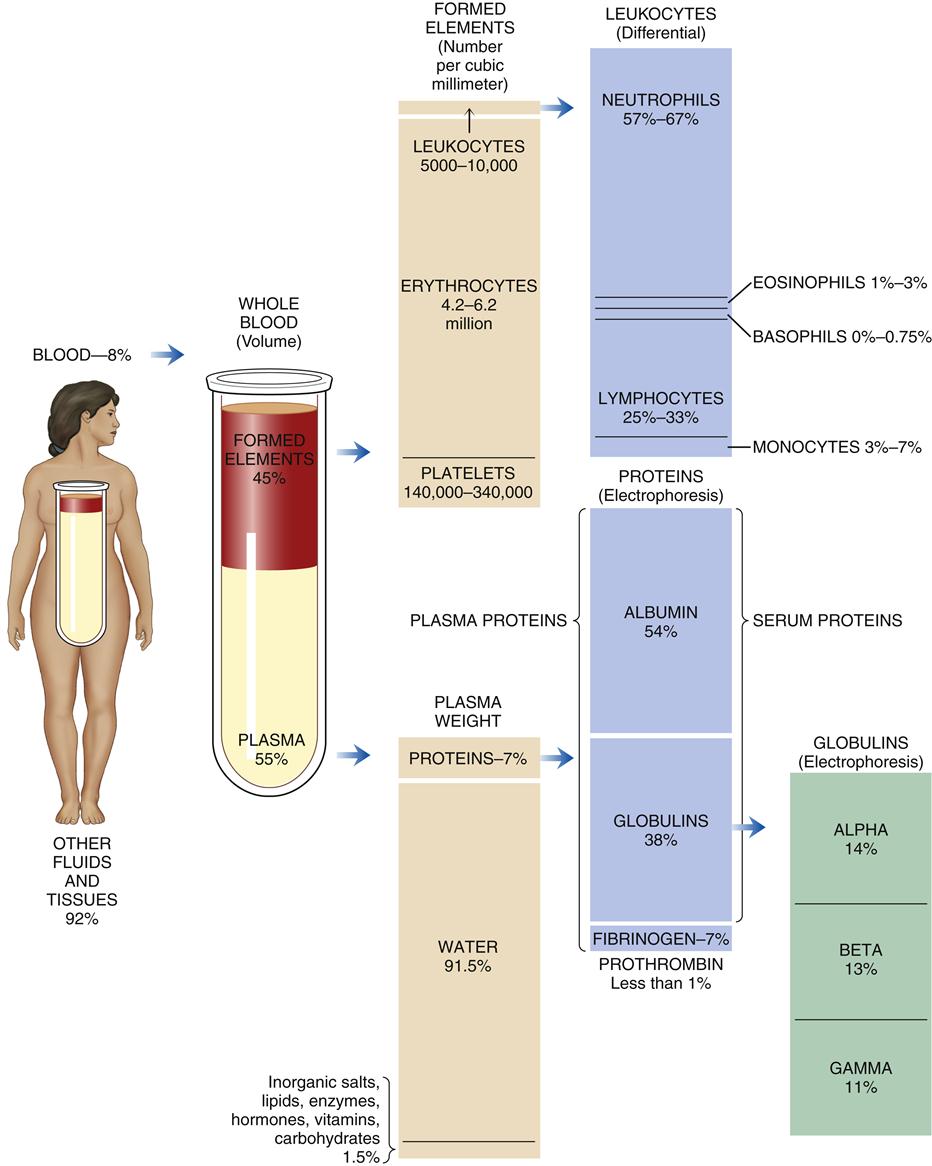
The total blood volume averages 75.5 ml/kg in men and 66.5 ml/kg in women, which is 5 to 6 L or 7% to 8% of body weight. The blood cells comprise approximately 45% and the blood plasma 55% of the blood volume. Blood plasma is composed of about 92% water and 7% plasma proteins (Figure 13-1). The arterial pH of normal blood is 7.35 to 7.45.
Organic and Inorganic Components
The plasma proteins are formed mainly in the liver. They are unable to leave the vascular space under normal circumstances and assist in regulating blood volume and the body’s fluid balance. Plasma proteins contribute to colloid osmotic pressure, which is important in maintaining blood pressure. There are three general types of plasma proteins. The first is serum albumin, which is an essential factor in maintaining blood volume and pressure. The second is serum globulin, which is composed of three general fractions: the α fraction is associated with the transport of bilirubin, lipids, and steroids; the β fraction is associated with the transport of iron and copper in plasma; and the γ fraction contains the antibody molecules. Fibrinogen is the third major type of plasma protein. It is the inactive precursor of fibrin, which forms the framework of blood clots. Regulatory proteins, such as hormones and enzymes, are also present in the plasma. Diffusible nonorganic substances, such as sodium chloride, calcium, potassium, iodine, and iron, are used by body cells and constitute 0.9% of plasma. Diffusible organic constituents, such as urea, uric acid, xanthine, creatine, creatinine, and ammonia, are products of tissue metabolism that are transported from the tissues to the kidneys and skin for excretion. Also included in this category are nutritive organic materials, such as amino acids, glucose, fats, and cholesterol, which are foodstuffs in solution absorbed from the gastrointestinal (GI) tract. They are transported to other body tissues for utilization and storage (Table 13-1).1
TABLE 13-1
ORGANIC AND INORGANIC COMPONENTS OF BLOOD
| CONSTITUENT | AMOUNT/CONCENTRATION | MAJOR FUNCTIONS |
| Water | 92% of plasma weight | Medium for carrying all other constituents |
| Electrolytes | Total <1% of plasma weight | Keep H2O in extracellular compartment; act as buffers; function in membrane excitability |
| Na+ | 136-145 mEq/L (142 mM) | |
| K+ | 3.5-5 mEq/L (4 mM) | |
| Ca2+ | 4.5-5.5 mEq/L (2.5 mM) | |
| Mg2+ | 1.5-2.5 mEq/L (1.5 mM) | |
| Cl− | 100-106 mEq/L (103 mM) | |
| HCO3− | 27 mEq/L (27 mM) | |
| Phosphate (mostly HPO42−) | 3-4.5 mEq/L (1 mM) | |
| SO42− | 0.5-1.5 mEq/L (0.5 mM) | |
| Proteins | 6-8 g/dl (2.5 mM) | |
| Albumin | 3.5-5.5 g/dl | Provides colloid osmotic pressure of plasma; acts as buffers; bind other plasma constituents (e.g., lipids, hormones, vitamins, metals) |
| Globulins | 1.5-0.3 g/dl | Enzymes; enzyme precursors; antibodies (immune globulins); hormones |
| Fibrinogen | 0.2-0.4 g/dl | Clotting factor |
| Gases, arterial plasma | ||
| CO2 content | 22-30 mmol/L of plasma | By-product of metabolism; most CO2 content is from HCO3− and acts as buffer |
| O2 | PaO2, 80 mm Hg or greater (arterial); P O2, 30-40 mm Hg (venous) O2, 30-40 mm Hg (venous) | Oxygenation |
| N2 | 0.9 ml/dl | By-product of protein catabolism |
| Nutrients | Provide nutrition and substances for tissue repair | |
| Glucose and other carbohydrates | 70-105 mg/dl (5.6 mM) | |
| Total amino acids | 40 mg/dl (2 mM) | |
| Total lipids | 450 mg/dl (7.5 mM) | |
| Cholesterol | 150-250 mg/dl (4-7 mM) | |
| Individual vitamins | 0.0001-2.5 mg/dl | |
| Individual trace elements | 0.001-0.3 mg/dl | |
| Waste products | ||
| Urea (BUN) | 10-20 mg/dl (5.7 mM) | End product of protein catabolism |
| Creatinine | 0.7-1.5 mg/dl (0.09 mM) | End product of energy metabolism |
| Uric acid | 2.5-8 mg/dl (0.3 mM) | End product of protein metabolism |
| Bilirubin | 0.3-1.1 mg/dl | End product of red blood cell destruction |
| Direct conjugated | 0.1-0.5 mg/dl | |
| Indirect unconjugated | 0.1-0.7 mg/dl | |
| Individual hormones | 0.000001-0.05 mg/dl | Functions specific to target tissue |
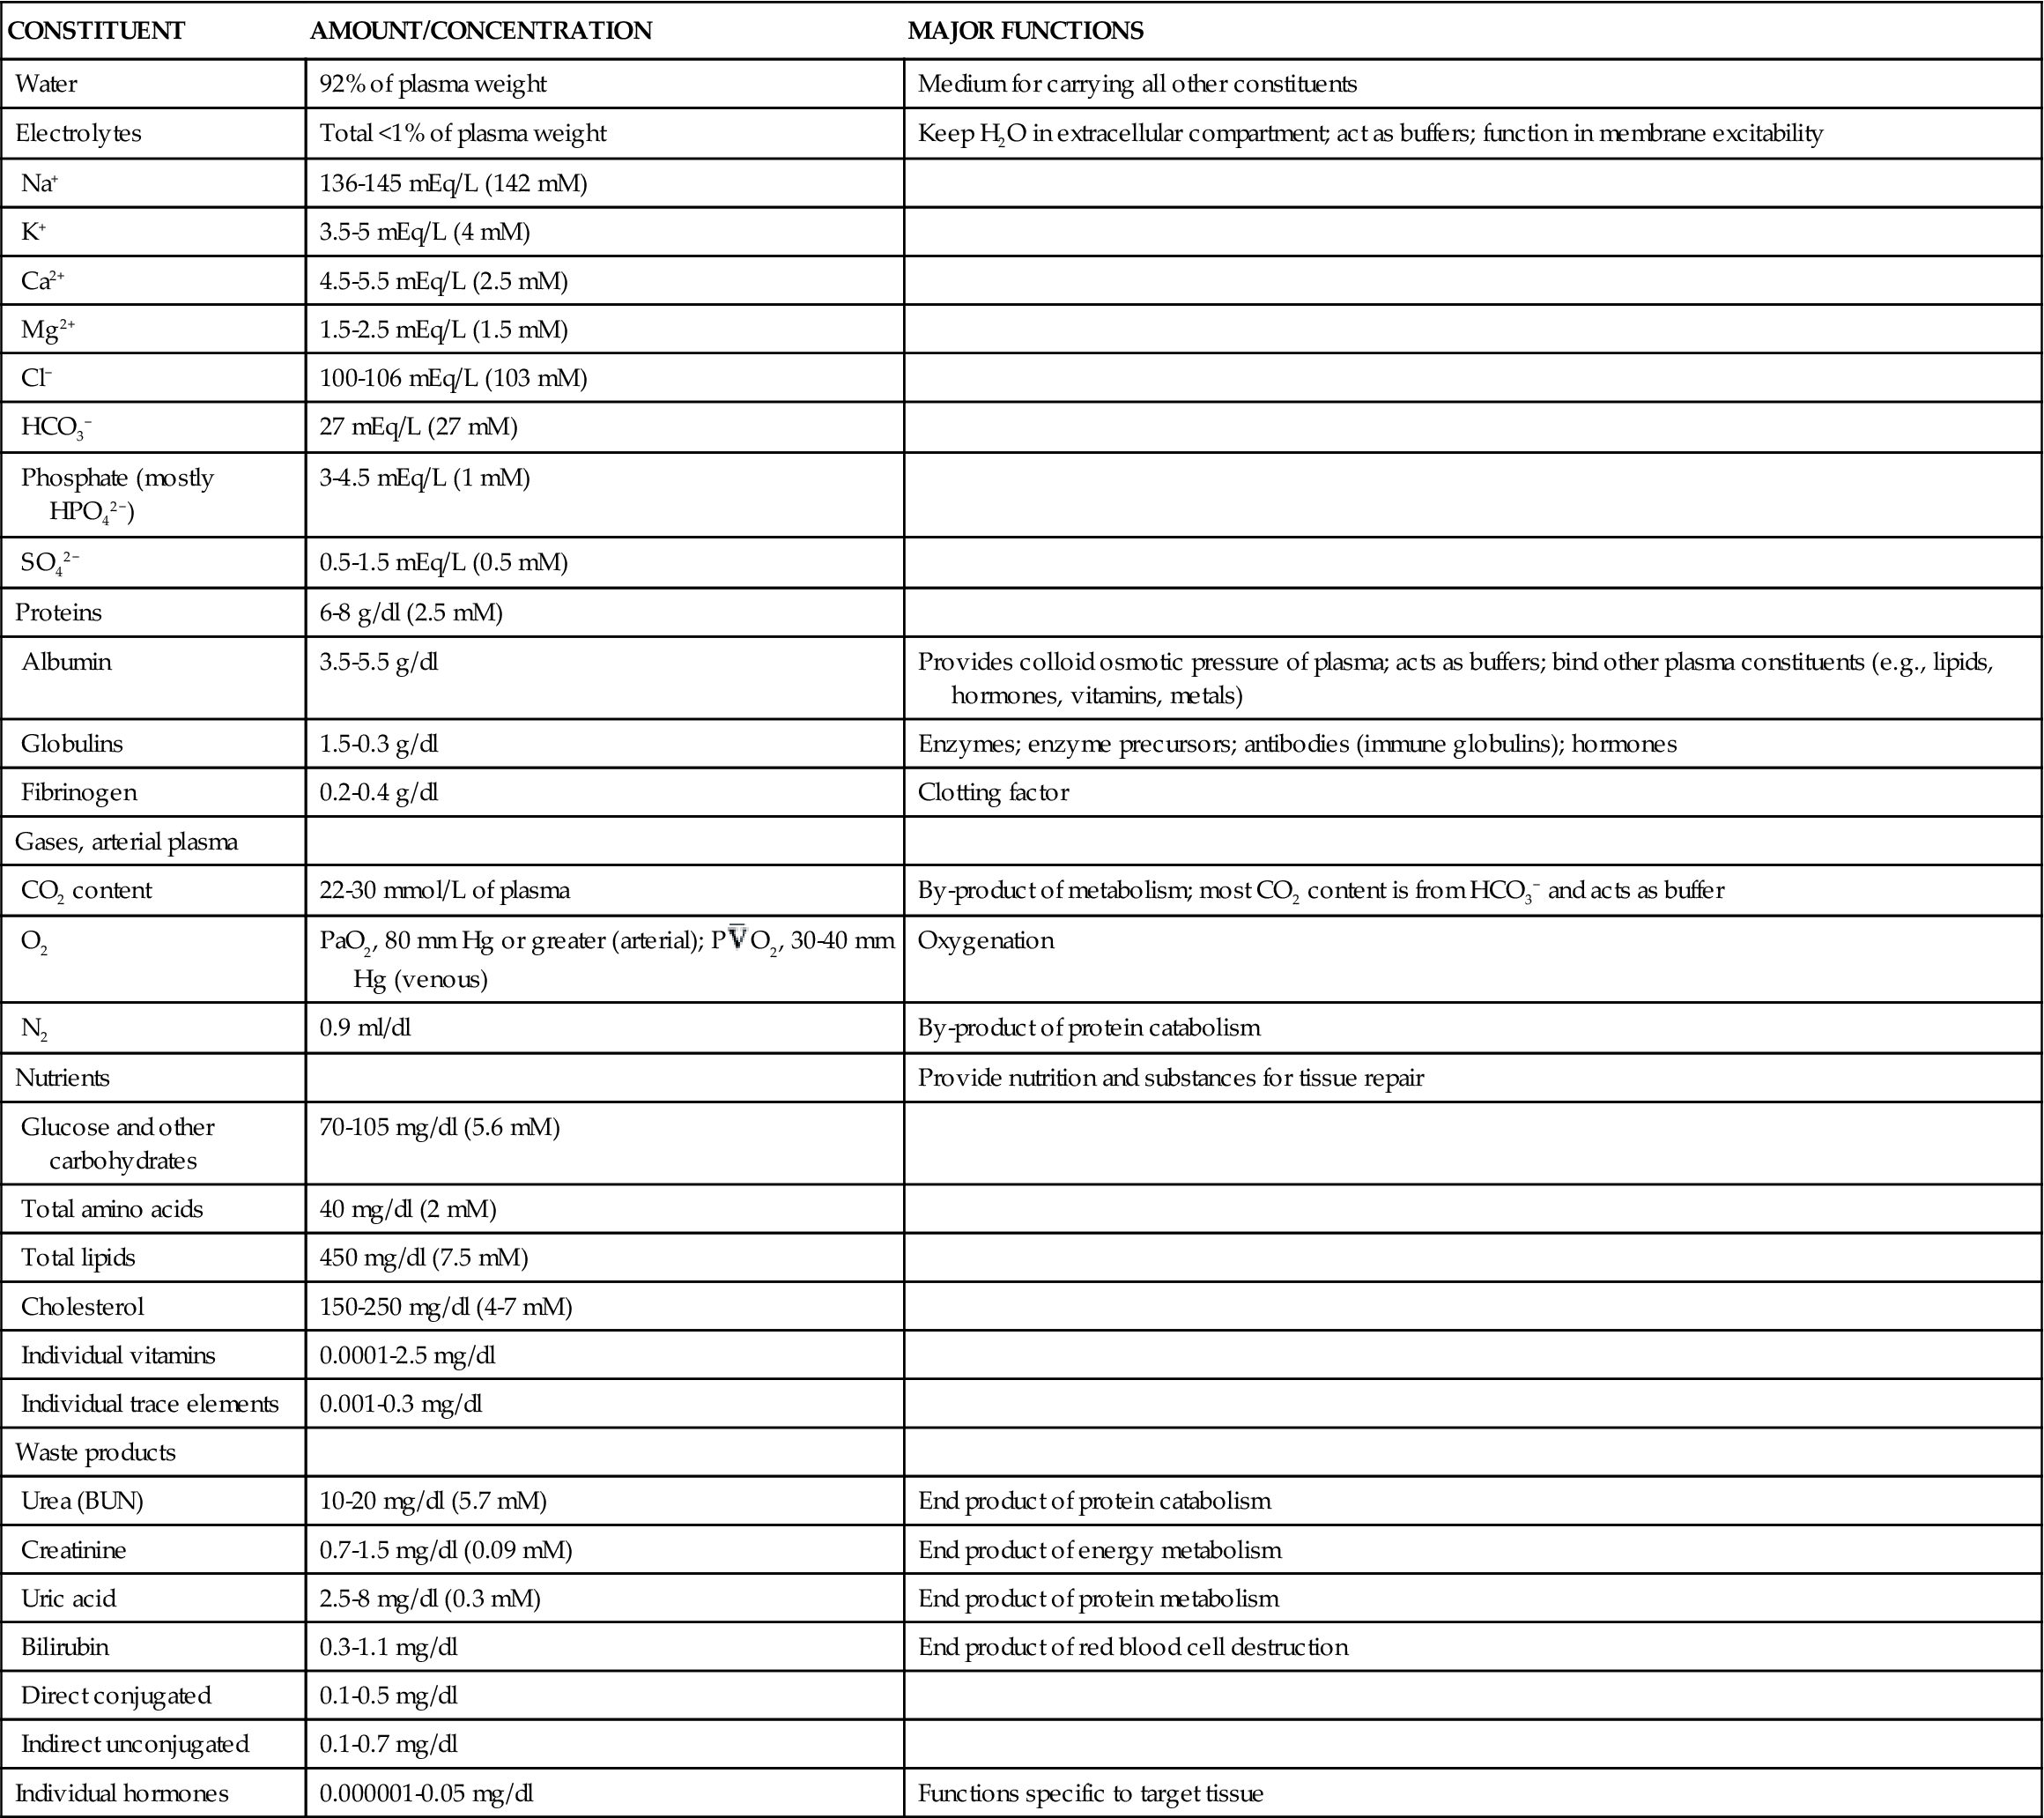
Adapted with permission from Vander AJ et al: Human physiology: the mechanisms of body function, ed 7, New York, 1998, McGraw-Hill.
Cellular Components
The amounts of the different cellular components in the blood vary with age. Table 13-2 gives normal values from birth to 21 years.2
TABLE 13-2
AGE-RELATED CHANGES IN HEMATOLOGIC VALUES
| AGE | HEMOGLOBIN (g) | HEMATOCRIT (%) | RBC COUNT (millions/mm3) | PLATELETS (thousands/ mm3) | RETICULOCYTES (%) | WBC COUNT (cells/mm3) | PMN COUNT, ADULT | BAND FORMS (%) | EOSINOPHILS (%) | BASOPHILS (%) | LYMPHOCYTES (%) | MONOCYTES (%) |
| Birth | 17.6 | 55 | 5.5 | 350.0 | 5.0 | 9000-30,000 (avg., 18,000) | 9400 (52%) | 9.1 | 2.2 | 0.6 | 31 | 5.8 |
| 24 hr | 18.0 | 56 | 5.3 | 400.0 | 5.2 | 9400-34,000 (avg., 19,045) | 9800 (52%) | 9.2 | 2.4 | 0.5 | 31 | 5.8 |
| 1 wk | 17.0 | 54 | 5.0 | 300.0 | 1.0 | 5000-21,000 (avg., 12,279) | 4700 (39%) | 6.8 | 4.1 | 0.4 | 41 | 9.1 |
| 2 mo | 12.4 | 30 | 4.3 | 260.0 | 0.5 | 5500-18,000 (avg., 11,000) | 3300 (30%) | 4.4 | 2.7 | 0.5 | 57 | 5.9 |
| 6 mo | 11.5 | 34 | 4.6 | 250.0 | 0.8 | 6000-17,500 (avg., 11,900) | 3300 (28%) | 3.8 | 2.5 | 0.4 | 61 | 4.8 |
| 2 yr | 12.9 | 40 | 4.8 | 250.0 | 1.0 | 6000-17,000 (avg., 10,680) | 3200 (30%) | 3.0 | 2.6 | 0.5 | 59 | 5.0 |
| 6 yr | 14.1 | 42 | 4.8 | 250.0 | 1.0 | 5000-14,500 (avg., 8500) | 4000 (48%) | 3.0 | 2.7 | 0.6 | 42 | 4.7 |
| 14 yr | 15.0 | M: 45; F: 42 | 5.1 | 250.0 | 1.0 | 4500-13,000 (avg., 7900) | 4200 (53%) | 3.0 | 2.5 | 0.5 | 37 | 4.7 |
| 21 yr | 15.0 | M: 45; F: 42 | 5.1 | 250.0 | 1.0 | 4500-11,000 (avg., 7400) | 4200 (56%) | 3.0 | 2.7 | 0.5 | 34 | 4.0 |
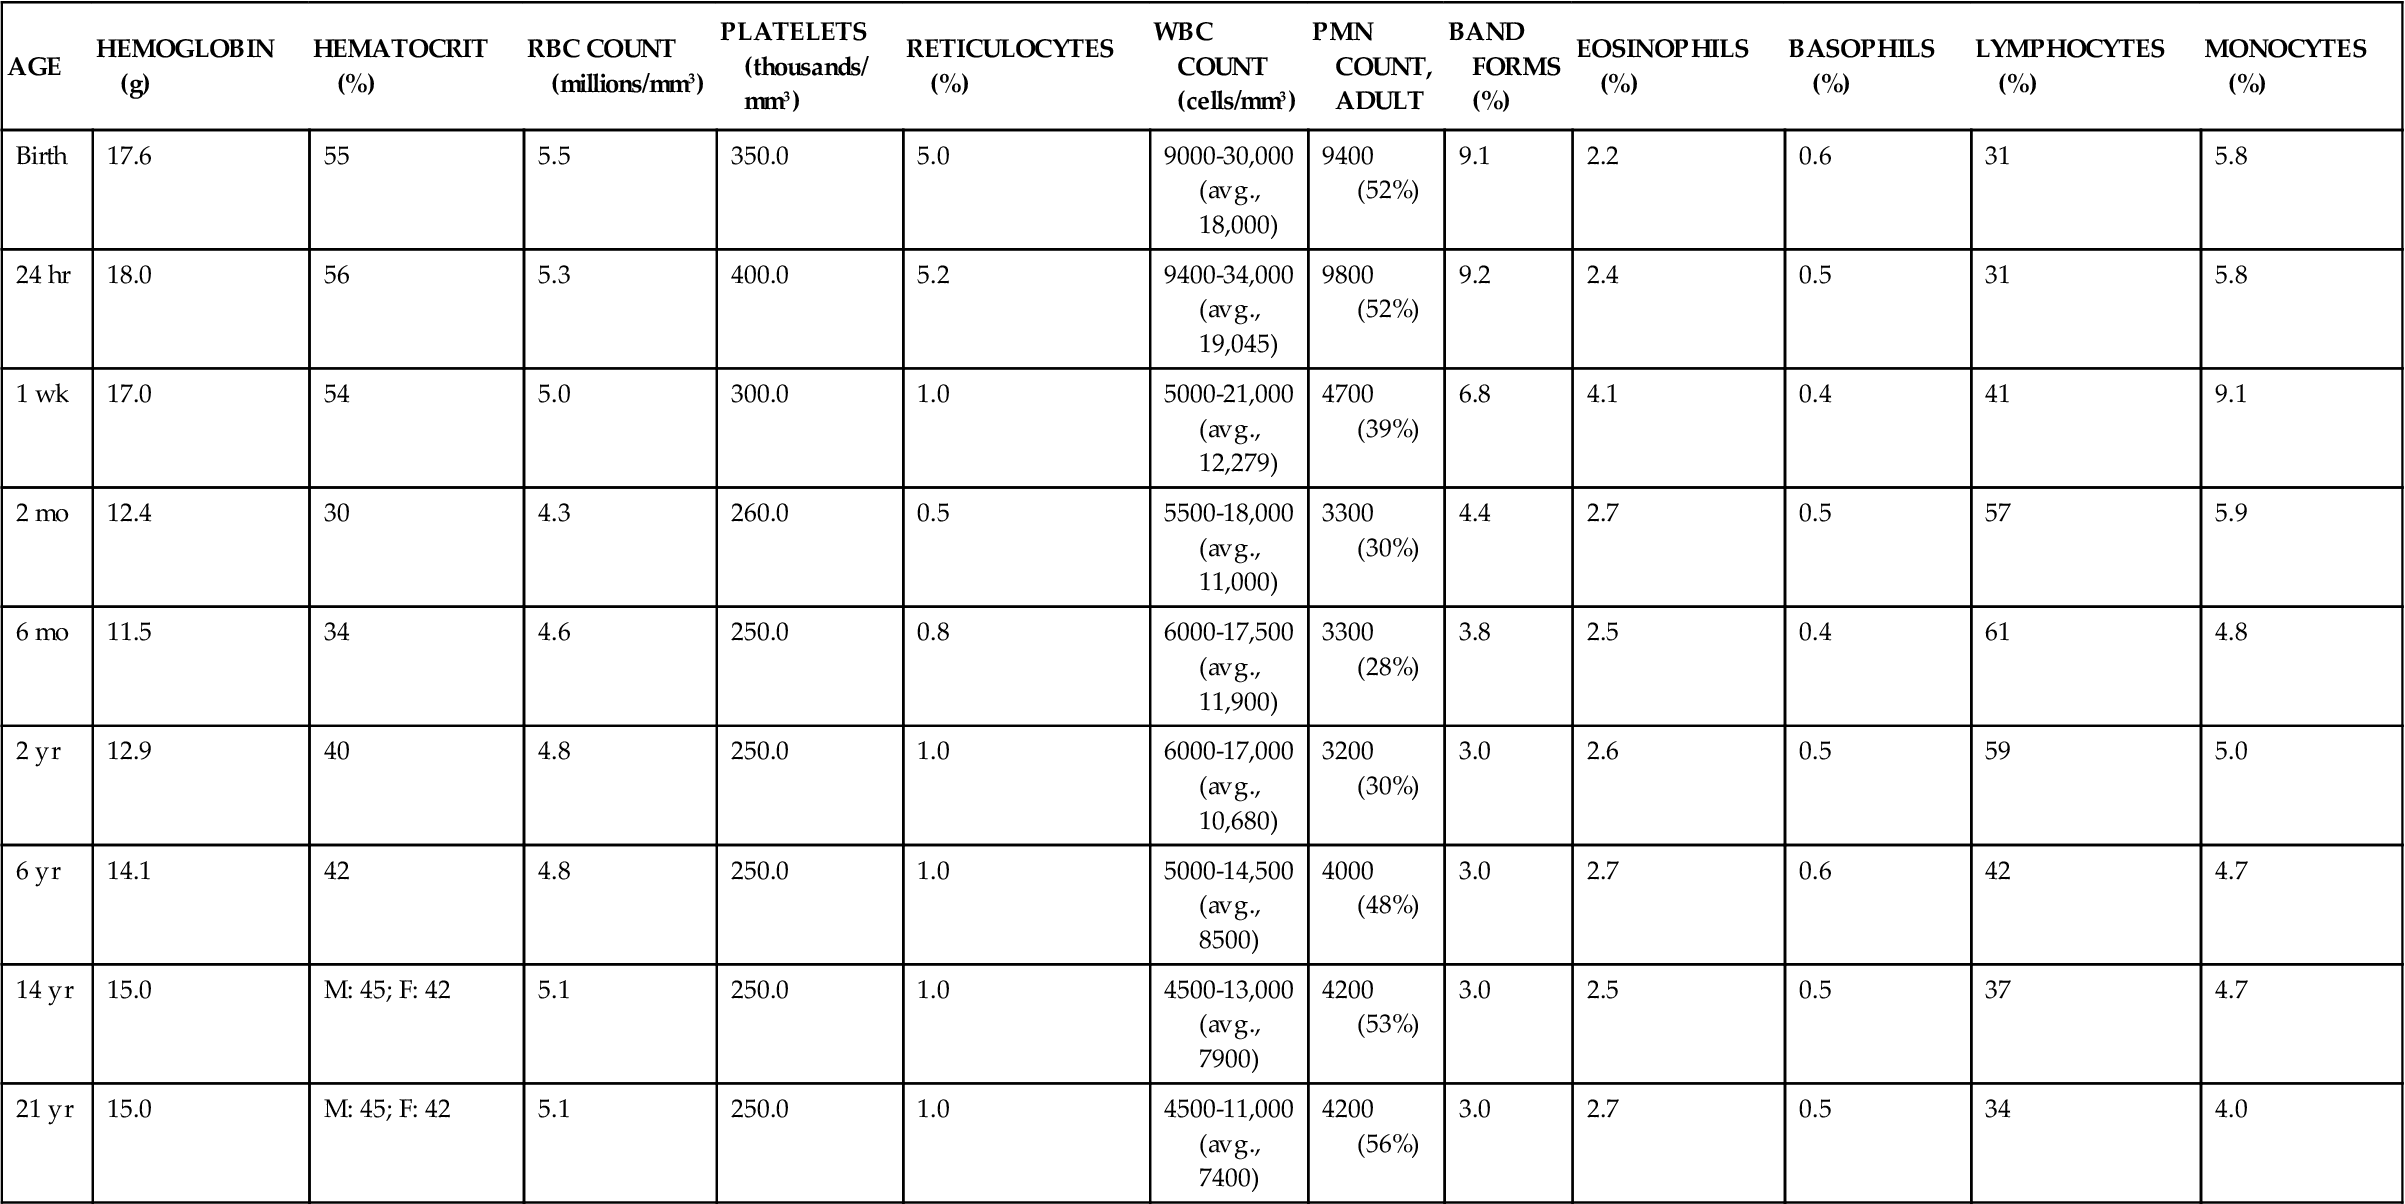
Data from Platt W: Color atlas and textbook of hematology, ed 2, Philadelphia, 1979, Lippincott, p 4. Reproduced by permission of William R. Platt, MD.
Erythrocytes
Of the cellular elements of blood (Table 13-3), RBCs, or erythrocytes, are the most numerous, with normal concentrations ranging from 4.2 to 6.2 million cells/mm3. RBCs are responsible for transporting oxygen to the tissues, and participate in both removing carbon dioxide from the tissues and buffering blood pH. They have no cytoplasmic organelles, nucleus, mitochondria, or ribosomes. Therefore, RBCs cannot synthesize protein or carry out oxidative reactions. Instead the erythrocyte’s cytoplasm consists of a solution containing proteins, hemoglobin, and electrolytes that regulates diffusion through the cellular membrane. RBCs live for 80 to 120 days in the circulation; then they die and are replaced. Hemoglobin is the main functional constituent of the red cell. It is a protein that enables the blood to transport 100 times more oxygen than could be transported in plasma alone. An enzyme inside RBCs, carbonic anhydrase, is responsible for the buffering mechanism of red cells.3
TABLE 13-3
CHARACTERISTICS OF BLOOD CELLS
| CELL | STRUCTURAL CHARACTERISTICS | NORMAL AMOUNTS IN CIRCULATING BLOOD∗ | FUNCTION | LIFE SPAN |
Erythrocyte (red blood cell)  | Nonnucleated biconcave disk containing hemoglobin | Males: 4.7-6.1 × 10¹²/L Females: 4.2-5.4 × 10¹²/L | Gas transport to and from tissue cells and lungs | 80-120 days |
| Leukocyte (white blood cell) | Nucleated cell | 4.8-10.8 × 10⁹/L | Body defense mechanisms | See below |
Lymphocyte | Mononuclear immunocyte | 1.2-3.4 × 10⁹/L; 20-44% leukocyte differential | Humoral and cell-mediated immunity | Days or years, depending on type |
Neutrophil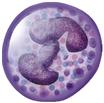 | Segmented polymorphonuclear granulocyte with neutrophilic granules | 1.4-6.5 × 10⁹/L; 50-70% leukocyte differential | Phagocytosis, particularly during early phase of inflammation | 5 days |
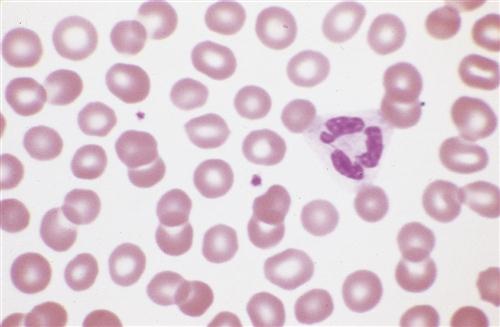
Eosinophil 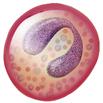 | Segmented polymorphonuclear granulocyte with eosinophilic granules | 0-0.7 × 10⁹/L; 0-4% leukocyte differential | Phagocytosis, antibody-mediated defense against parasites; participates in mucosal immune response | Unknown |
Basophil  | Segmented polymorphonuclear granulocyte with basophilic granules | 0-0.2 × 10⁹/L; 0-2% leukocyte differential | Transport and release of heparin and histamine; involved in immune and inflammatory responses | Unknown |
Monocyte-macrophage 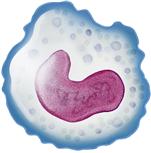 | Large mononuclear phagocyte | 0.11-0.59 × 10⁹/L; 2%-9% leukocyte differential | Phagocytosis; process and present antigens | Months to years |
Platelet 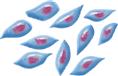 | Discoid cytoplasmic fragment derived from megakaryocytes | 130-400 × 109/L | Hemostasis following vascular injury; forms hemostatic plug, provides cofactors, maintains vascular endothelium | 9.5 days |
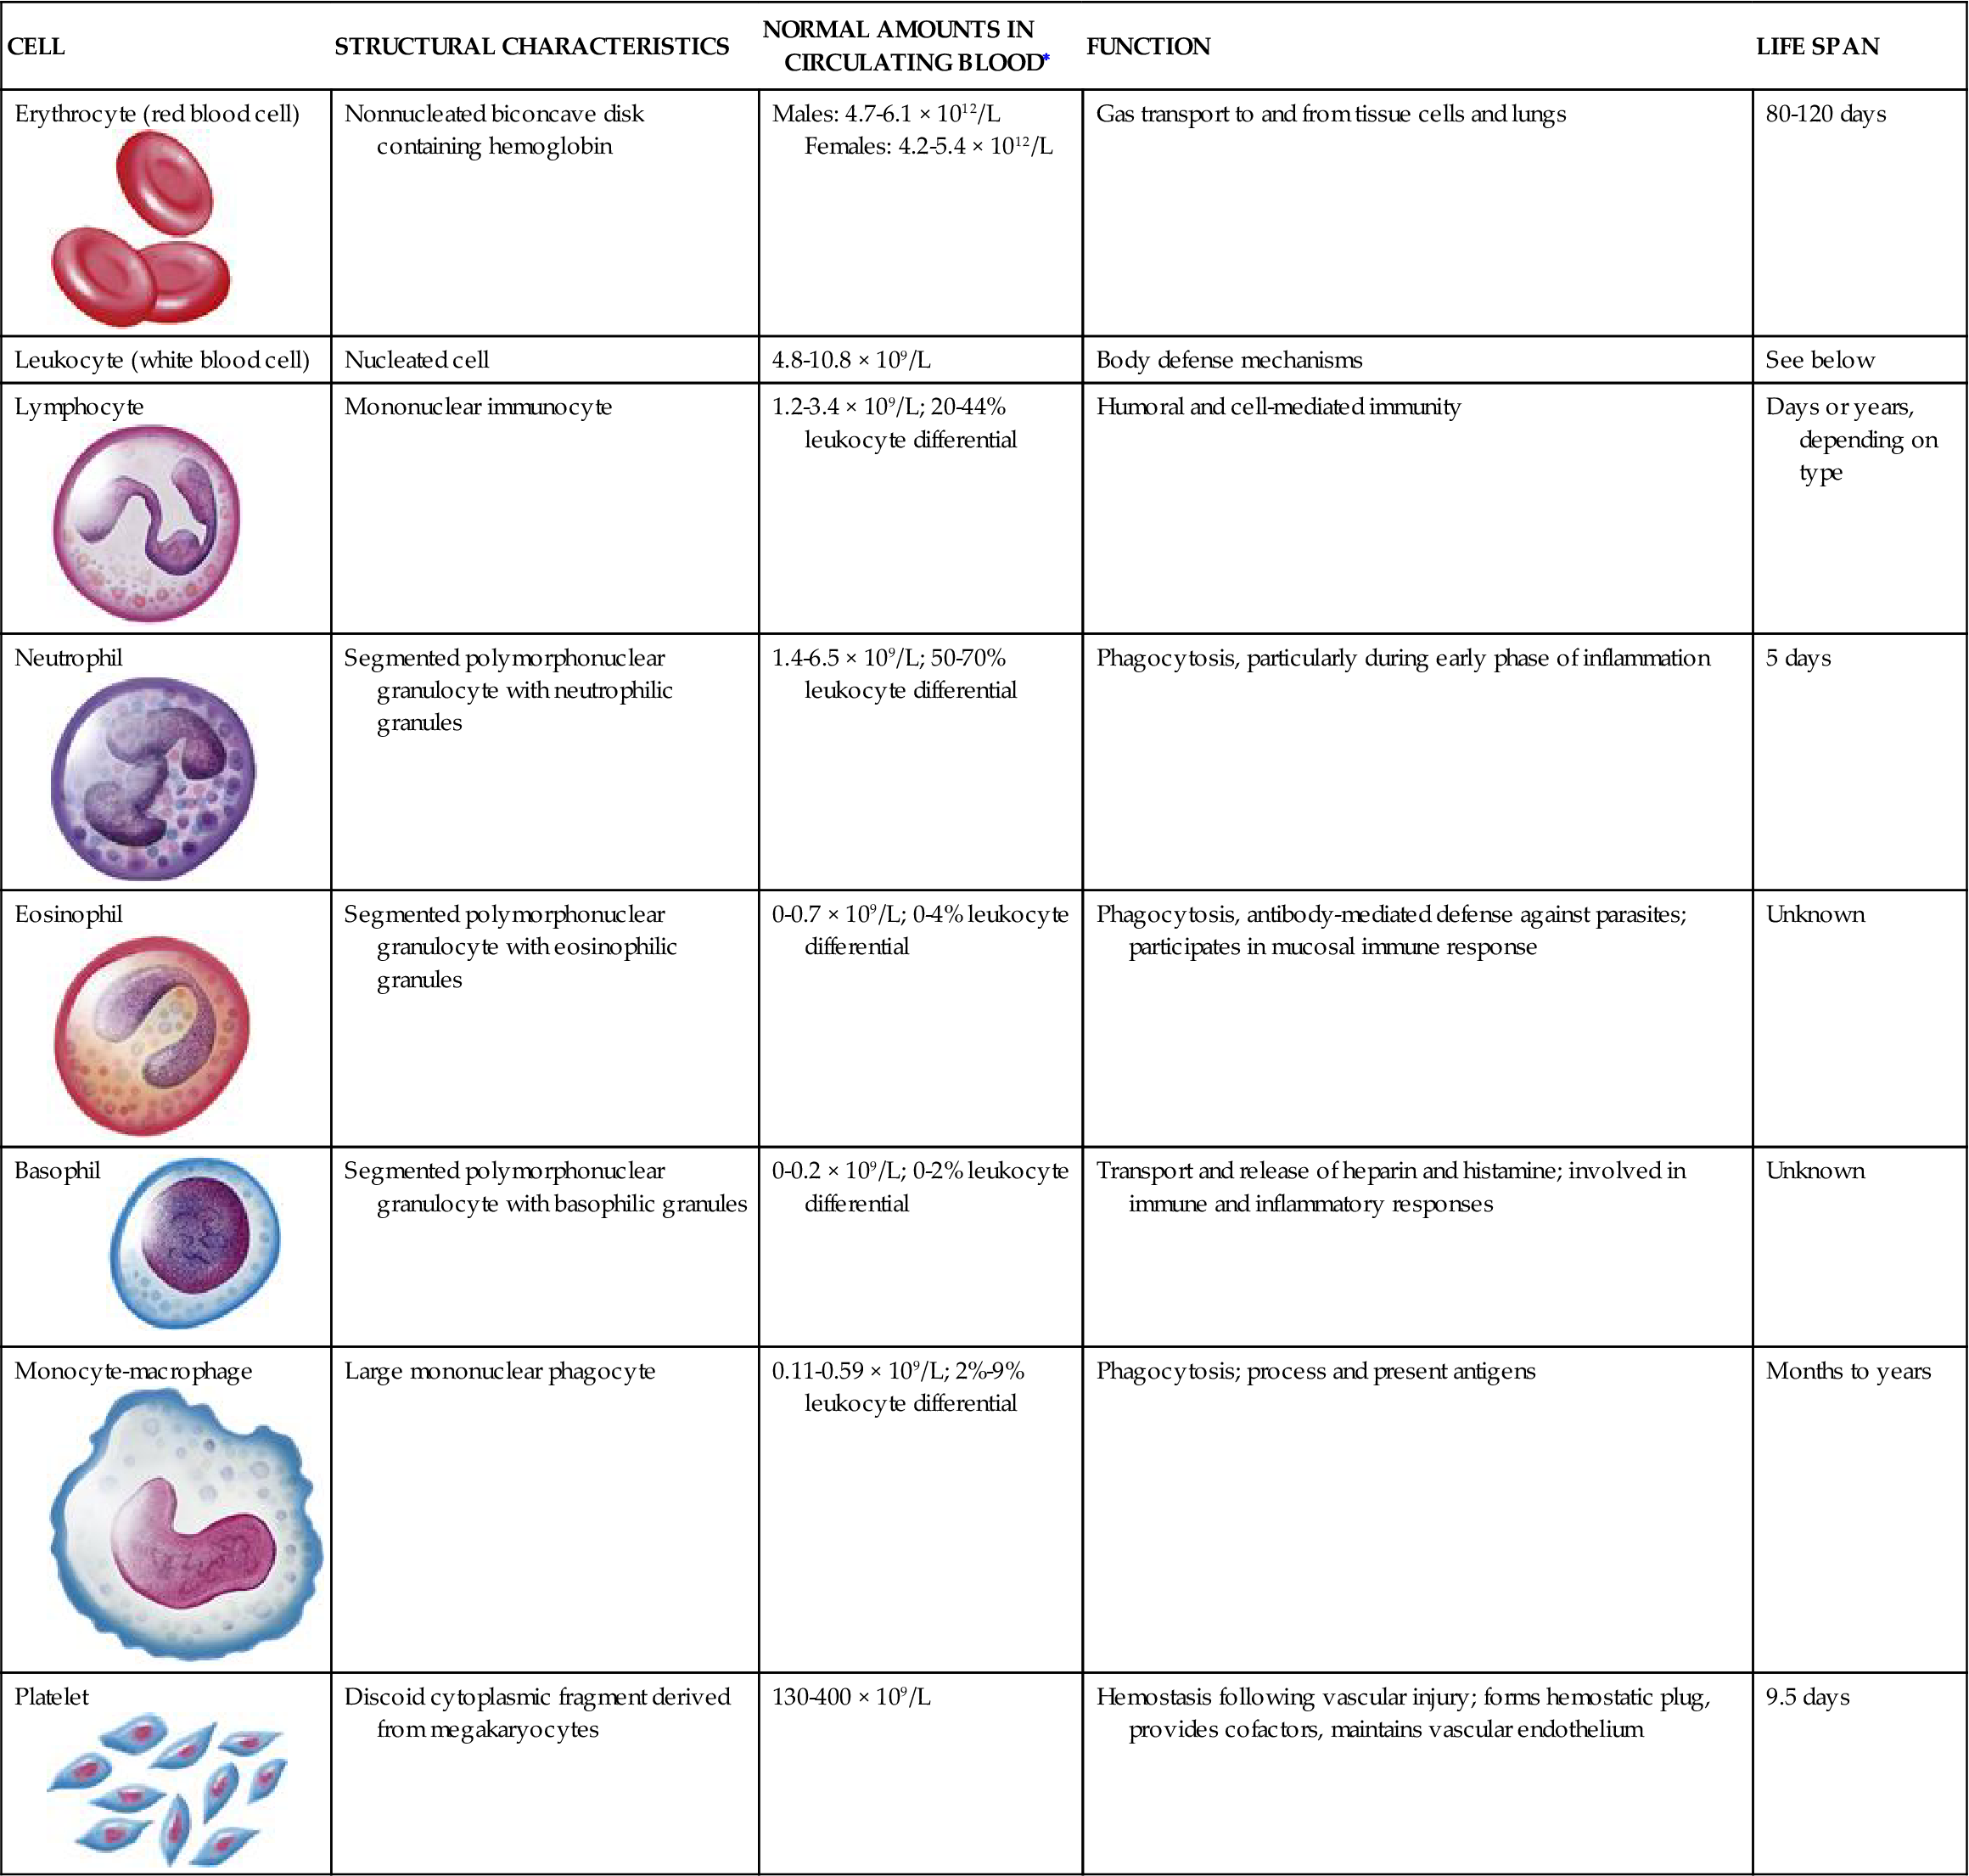
Illustrations from Patton KT, Thibodeau GA: Anatomy & physiology, ed 8, St Louis, 2013, Mosby, p. 606.
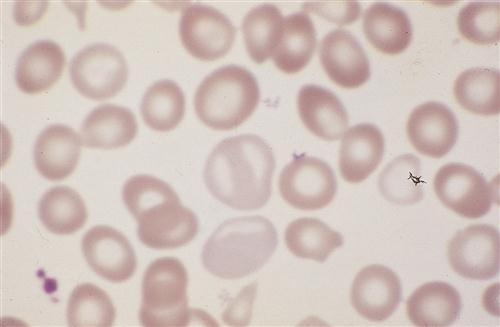
The erythrocyte’s size and shape also contribute to its function as a gas carrier (Figure 13-2). It is a small, biconcave disk (about 7.2 μm in diameter) that must circulate through splenic sinusoids and capillaries, which are only 2 μm in diameter. This remarkable feat is accomplished through a property called reversible deformability, which allows the RBC to assume a torpedo-like conformation and then return to a biconcave disk shape.3
Leukocytes
White blood cells (WBCs), or leukocytes, protect the body by phagocytosis of microorganisms and other debris and participate in immune antibody formation. Leukocytes act primarily in the tissues but are also transported in the circulatory and lymphatic systems. The average adult has approximately 5000 to 10,000 leukocytes per cubic millimeter of blood. Monocytes and granulocytes are WBCs that share a common lineage with RBCs and platelets. Because of the interrelationship of RBCs, WBCs, and platelets, which are all derived from the myeloid stem cell (Figure 13-3), abnormalities in these cells are seen in some red cell diseases.4 Leukocyte structure and function are discussed in detail in Chapter 9.
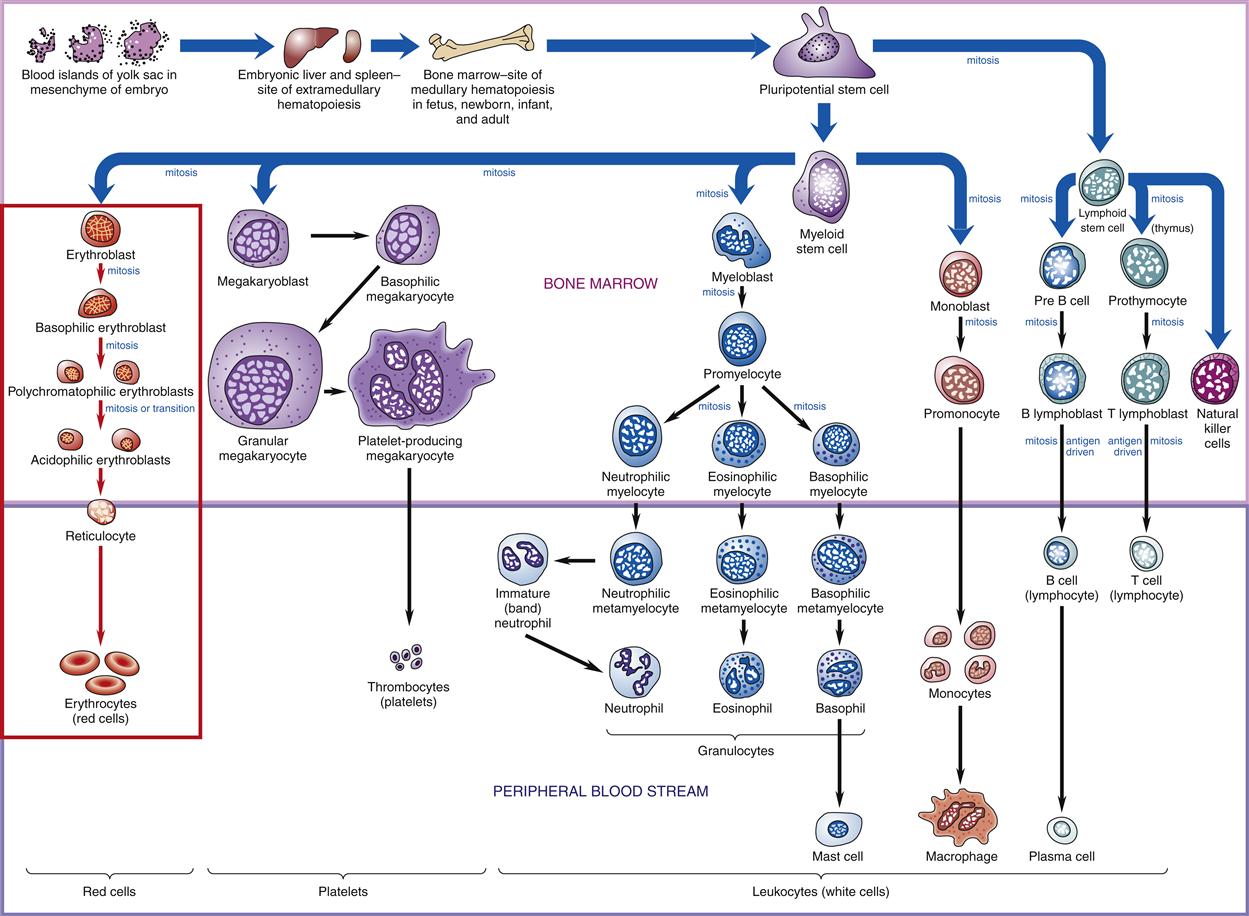
Probable pathways of blood cell differentiation from the pluripotential stem cell to mature leukocytes, erythrocytes, and platelets. Production of cells begins in embryo blood islands of the yolk sac. As the embryo matures, production shifts to the liver and spleen (extramedullary hematopoiesis) and progresses to bone marrow (medullary hematopoiesis). In an adult, all production is in the bone marrow. Current thinking is that all cell production begins with a pluripotential stem cell, which differentiates into either a myeloid stem cell or a lymphoid stem cell, which then differentiates into a specific blast cell. For example, red cell differentiation begins with the proerythroblast, which matures into a basophilic erythroblast, to a polychromatophilic erythroblast, and to an acidophilic erythroblast, all of which are found in the bone marrow. Red cell differentiation concludes with production of reticulocytes and mature red cells (erythrocytes), which normally are found only in the peripheral blood.
Platelets
Platelets are essential in the formation of blood clots and in the control of bleeding. They are not cells but are circulating cytoplasmic fragments of megakaryocytes and are incapable of mitotic division. They contain cytoplasmic granules that release biochemical mediators involved in the hemostatic process. Normally, 150,000 to 400,000 platelets/mm3 circulate freely in the blood. An additional one third of the body’s platelets are in a reserve pool in the spleen. The average life span of platelets in the peripheral blood is approximately 4 to 5 days.5
Structure and Function of Red Blood Cells
The cellular components of blood originate in the yolk sac mesenchyme, move to the liver and spleen during fetal life, and finally are limited to the marrow of the body skeleton (Figure 13-4). Bone marrow provides a special environment for hematopoietic cell proliferation and maturation. Developing cells are held in a fine reticular meshwork, which provides free access to plasma nutrients but retains developing cells until their maturity allows penetration of the endothelial barrier. In times of need, immature cells (reticulocytes and nucleated red blood cells, or NRBCs) are released early into the circulation; their presence in increased numbers is a sign that the hematopoietic system is stressed or is experiencing disease.2
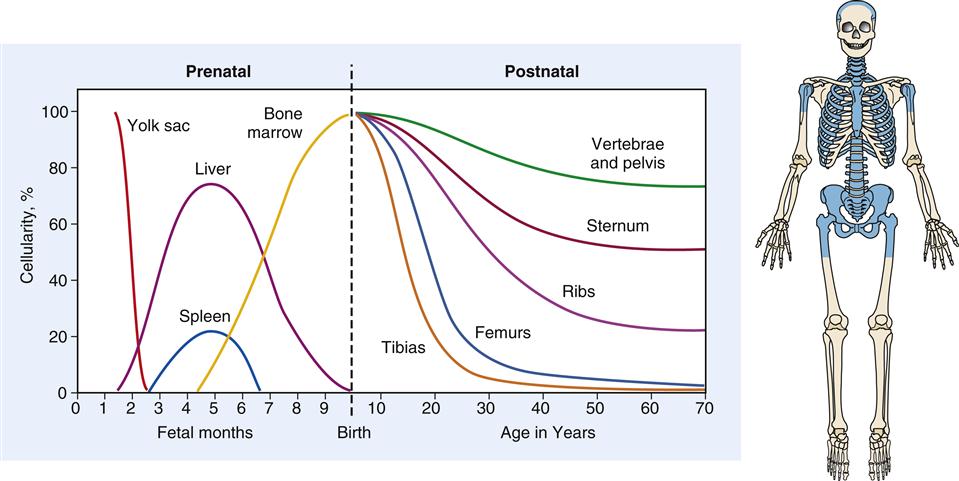
During fetal development, hematopoiesis is first established in the yolk sac mesenchyme, later moves to the liver and spleen, and finally is limited to the bony skeleton. From infancy to adulthood, there is progressive restriction of productive marrow to the axial skeleton and proximal ends of the long bones, which appear as shaded areas on the drawing of the skeleton.
Hematopoiesis
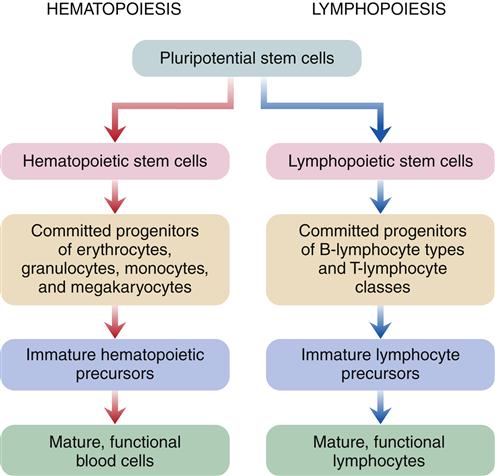
Hematopoiesis is the developmental process leading from pluripotential stem cells to mature, differentiated red cells, neutrophils, eosinophils, basophils, monocytes, and platelets. Lymphopoiesis describes this process for lymphocytes. Both hematopoietic and lymphopoietic stem cells probably derive from a single totipotent stem cell pool in fetal development, but it is uncertain if this is the functioning stem cell after birth (Figure 13-5). Research suggests that a pluripotential stem cell that is stimulated by erythropoietin and other poietins to cause further differentiation into separate cell lines may be the primary stem cell in adults.6
Hematopoiesis is a two-stage process that involves mitotic division (proliferation) and maturation (differentiation). Each type of blood cell has stem cells that undergo mitosis when stimulated by a specific biochemical signal, indicating that the number of circulating cells has decreased. Medullary or bone marrow hematopoiesis continues throughout life and can be accelerated by several mechanisms, including (1) an increase in differentiation of daughter cells, (2) an increase in number of stem cells, and (3) conversion of yellow (fatty) bone marrow (which does not produce cells) to red marrow (which does produce cells). Marrow conversion is stimulated by erythropoietin, which is the hormone from the kidney that stimulates erythrocyte production. In adults, extramedullary hematopoiesis, or production of blood cells in tissue other than bone, is usually due to disease.7
Erythrocyte development is shown in detail in Figure 13-3. During this process, the cell changes from a large nucleated cell, rich in ribosomes, to a reticulocyte, which is a small disk that has lost its nucleus. The reticulocyte (Figure 13-6) leaves the marrow, enters the bloodstream, and matures into an erythrocyte in 24 to 48 hours. During this period, mitochondria and ribosomes disappear; the cell can no longer synthesize hemoglobin, and it relies on glycolysis for adenosine triphosphate (ATP) production. The normal reticulocyte count is 1% of the total RBC count. This makes it a useful test to determine effective erythropoietic activity7 because erythropoietin stimulates uncommitted stem cells to differentiate into proerythroblasts.
Hemoglobin Synthesis
The immature red cell can be viewed as a factory for hemoglobin synthesis. In a mature red cell, hemoglobin, the oxygen-carrying protein, composes about 90% of the cell’s dry weight in the form of approximately 300 hemoglobin molecules.3 Hemoglobin that is carrying oxygen is called oxyhemoglobin. Hemoglobin is composed of two pairs of polypeptide chains—the globins. Each globin has an attached heme molecule that is composed of iron plus a protoporphyrin molecule (Figure 13-7).8
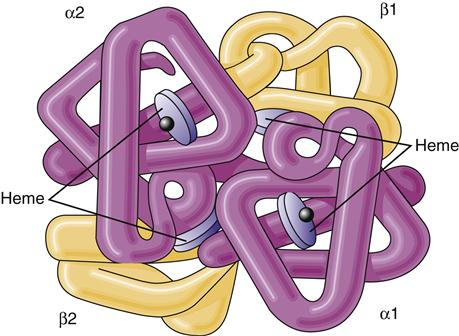
The molecule is a spherical tetramer weighing approximately 64,500 daltons. It contains two α- and two β-polypeptide chains and four heme groups.
After dietary iron is absorbed in the duodenum and proximal jejunum, it is transported through the plasma by the protein transferrin to transferrin iron receptors on the RBC membrane. The transferrin-receptor complex is engulfed by the cell into an invagination of the cell surface. The invagination becomes sealed off and forms an intracytoplasmic vacuole. Iron is then released and either stored as ferritin or used to synthesize heme (Figure 13-8).2 About 67% of total body iron is bound to heme in erythrocytes and muscle cells, and 30% is stored bound to ferritin or hemosiderin-containing macrophages and hepatic parenchymal cells. The remaining 3% is lost daily in urine, sweat, bile, and epithelial cells that are shed in the intestines. The mitochondria are responsible for the synthesis of protoporphyrin. The final heme molecule consists of four porphyrin moieties assembled in a ring structure around a central iron molecule.2
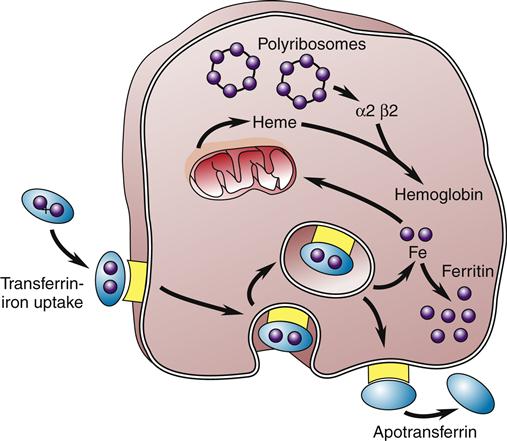
The iron-transferrin complex is picked up by a membrane-associated receptor and brought into the cell by invagination and formation of an intracytoplasmic vacuole. The iron is then released and stored as intracytoplasmic ferritin or used to synthesize heme, the precursor of hemoglobin. The transferrin-receptor complex is returned to the cell membrane, where the apotransferrin is expelled back into the circulation. (Redrawn from Hillman RS, Finch CA, editors: Red cell manual, ed 6, Philadelphia, 1992, FA Davis, p 8.)
Hemoglobin Synthesis in Infants
When an infant is born many mechanisms occur to decrease the infant’s hemoglobin level. At birth, erythropoietin, a hormone that stimulates red blood cell production, disappears from blood plasma; there is an increase in arterial oxygen saturation and the infant is born with immature bone marrow. These mechanisms cause a slow rate of red blood cell production at birth. In addition, infants primarily have fetal hemoglobin, accounting for about 70% of their total hemoglobin. Although fetal hemoglobin is a more efficient oxygen carrier, it has a shorter life span than adult hemoglobin. This causes red blood cells to be turned over every 70 to 90 days, instead of 120 days for adult red blood cells. Fetal hemoglobin may suppress production of erythropoietin.
Hemoglobin levels gradually decrease in the infant over the first 2 to 3 months because of the rapid destruction of fetal hemoglobin, decreased red blood cell production and depressed erythropoietin production. Additionally, the infant experiences rapid growth during this time, which creates quick expansion of blood volume that further dilutes the supply of hemoglobin. Maternal iron stores are rapidly depleting at this time and the baby’s iron stores will gradually diminish by 6 months.
As fetal hemoglobin is metabolized, the iron is released and stored. The body has enough iron to synthesize hemoglobin, but there is no stimulation to create hemoglobin at this time. Hemoglobin levels will continue to decrease until the oxygen needs of the tissues in the body are depleted enough to stimulate erythropoietin production. Release of erythropoietin causes erythropoiesis to resume. Adult hemoglobin is made at this time with the iron stored in the body. Hemoglobin levels will steadily increase in the infant starting about 6 months of age as fetal hemoglobin is replaced by adult hemoglobin.9
Globin is assembled from two pairs of polypeptide chains produced on specific ribosomes. The protein chain produced in fetal life is altered after birth by sequential gene suppression and activation. At birth, red cells contain mainly fetal hemoglobin (hemoglobin F), which is composed of two α chains and two γ chains. Hemoglobin F is a more efficient gas carrier under decreased oxygen tension than hemoglobin A and releases CO2 more readily. Within 120 days, fetal hemoglobin disappears and is replaced by adult hemoglobin (hemoglobin A) (Figure 13-9). This switch is the result of globin genes and is not well understood. Hemoglobin A is composed of two α chains and two β chains and constitutes 97% of the hemoglobin found in adults. Hemoglobin A2 comprises 2% to 3% of hemoglobin found in adults and is composed of α2δ2.8,9
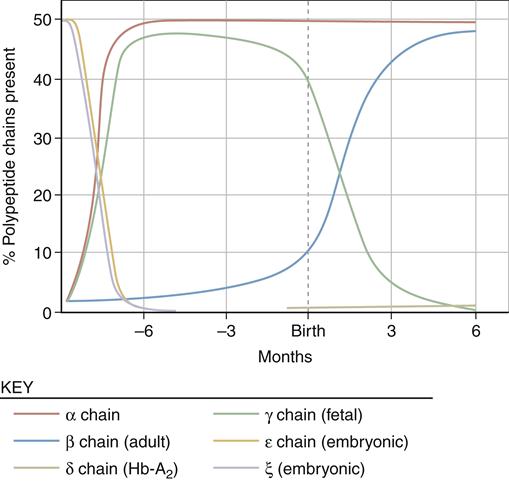
Sequential suppression and activation of individual globin genes in the immediate postnatal period result in a switch from fetal hemoglobin (hemoglobin F: two α chains and two γ chains) to adult hemoglobin (hemoglobin A: two α chains and two β chains). A small amount of hemoglobin A2 (two α chains and two δ chains) is also present in the adult. (From Young NS et al, editors: Clinical hematology, Philadelphia, 2006, Mosby, p 24.)
Several hundred hemoglobinopathies have been described that have changes in the two α chains and two β chains. Most are characterized by the substitution of only one amino acid and are classified by the polypeptide chain in which the substitution occurs.8
Nutritional Requirements for Erythropoiesis
In addition to iron, which is required for hemoglobin synthesis, the normal development of erythrocytes requires adequate supplies of protein, vitamins, and minerals. Erythropoiesis cannot proceed in the absence of vitamins, especially B12, folate, B6, riboflavin, pantothenic acid, niacin, ascorbic acid, and vitamin E. Folates and vitamin B12 (cobalamin) are absorbed from food by the ileal mucosa. Folate deficiencies or vitamin B12 deficiencies lead to impaired DNA synthesis in erythroid cells because the vitamins are coenzymes in a large number of key reactions in cellular metabolism. Absorption of vitamin B12 requires intrinsic factor in the gastric juice. Intrinsic factor is secreted by the stomach parietal cells and binds to vitamin B12. The complex then moves down the gastrointestinal tract to the ileum, where it attaches to specific receptor sites on the ileum mucosal cell. It is absorbed into the cell, released, and transported in the blood to the tissues and liver.10,11
Energy and Maintenance of Erythrocytes
For the RBC to perform efficiently and survive in the circulation for the full 120-day life span, it must have a source of energy. Without an energy source, ion pumps fail and the RBC becomes sodium logged and potassium depleted. The shape changes from a biconcave disk to a sphere, and it is quickly removed from the circulation by the filtering action of the spleen and the mononuclear phagocyte system. The metabolism of the RBC is limited because of the absence of a nucleus, mitochondria, and other subcellular organelles. Although the binding, transport, and release of O2 and CO2 is a passive process that does not require energy, other energy-dependent metabolic processes occur that are essential to RBC viability. The chief metabolic pathway, accounting for about 90% of the glucose used, is the anaerobic or Embden-Meyerhof pathway. The Embden-Meyerhof pathway provides ATP for regulation of intracellular Na+, K+, Ca2+, and Mg2+ concentrations via cation pumps. About 10% of the glucose undergoes aerobic glycolysis in the hexose monophosphate shunt. The hexose monophosphate shunt provides nicotinamide adenine dinucleotide phosphate (NADPH) and glutathione (GSH) to reduce cellular oxidants. This protects the cell from permanent oxidant injury. The methemoglobin reductase pathway protects hemoglobin from oxidation via NADH and methemoglobin reductase. Last, the Rapoport-Luebering pathway forms 2,3-diphosphoglycerate (2,3-DPG), which facilitates oxygen release to the tissues. These pathways contribute energy for maintaining (1) high intracellular K+, low intracellular Na+, and very low intracellular Ca2+ levels (cation pumps); (2) reduced hemoglobin concentration; (3) high levels of reduced GSH; and (4) membrane integrity and deformability.2 Deficiencies of enzymes that regulate these pathways can be due to natural causes, such as the normal aging process, or to an inherited deficiency of an enzyme.3,12
Red cell membrane structures are matrices formed from a double layer of phospholipids. In the red cell membrane, the globular proteins floating on the “sea of lipids” form a protein network on the cytoplasmic surface of the membrane. Half of the mass of the membrane is lipid, which is partially responsible for many of its physical characteristics. Both passive cation permeability and mechanical flexibility can be significantly influenced by changing the lipid composition of the membrane. Maintenance and renewal of membrane lipids in well-developed RBCs is important, and problems in these pathways result in premature cell death.13
Red Cell Production
When blood is described as a single body system, it is called the erythron (Figure 13-10). The erythron includes the blood cells and their bone marrow precursors. The size of the erythron increases or decreases based on the erythropoietic process and the pathologic changes in red cells seen in anemia.14 Erythropoiesis is controlled by a system sensitive to alterations in the concentration of hemoglobin in the blood. A decrease in hemoglobin level decreases the tissue oxygen tension in the kidney. In response to this hypoxia, the kidney secretes a hormone, erythropoietin, that stimulates primitive stem cells in the bone marrow to differentiate into proerythroblasts or pronormoblasts, thereby increasing the erythron (Figure 13-11).3,15 Hypoxia from a low hemoglobin level and other causes, such as high altitudes, can also initiate this response.
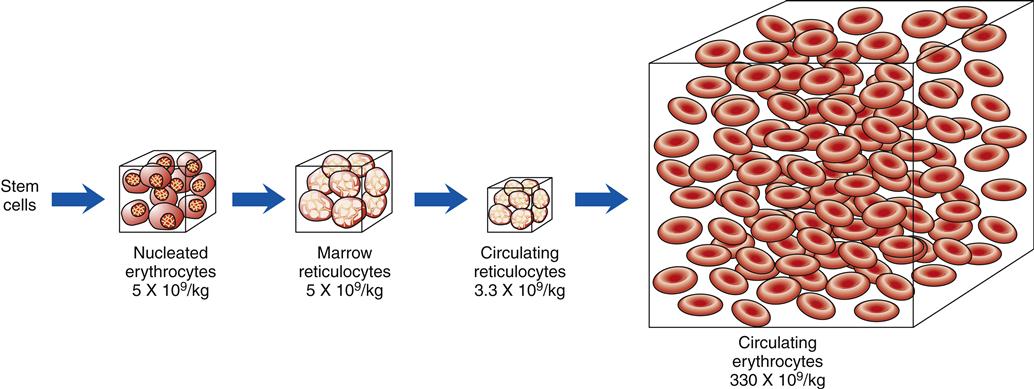
The numbers below each box indicate the average number of cells per kilogram of body weight. (Redrawn from Wintrobe M et al, editors: Clinical hematology, ed 8, Philadelphia, 1981, Lea & Febiger, p 109.)
Red Cell Destruction
While the red cell ages, the various enzyme activities decrease, amounts of membrane lipids decrease, levels of hemoglobin A2 and methemoglobin increase, and changes in cell size occur. Methemoglobin is formed when the iron of the hemoglobin molecule is oxidized to the ferric state (Fe3+). The cell loses its ability to deform and becomes increasingly fragile. These aging red cells are then removed by the mononuclear phagocytic system. The red cells are digested by proteolytic and lipolytic enzymes in phagolysosomes of macrophages. Almost 80% to 90% of this process occurs in macrophages of the spleen and liver. Only 10% to 20% of normal destruction occurs intravascularly.3,16
Globin is broken down into amino acids, and the iron is recycled. Porphyrin is reduced to bilirubin, which is transported to the liver and conjugated by the enzyme glucuronyl transferase. Finally, conjugated bilirubin is excreted in the bile as glucuronide. Bacteria in the intestine convert conjugated bilirubin into urobilinogen, which is excreted primarily in the stool but also in the urine (Figure 13-12). Any condition causing increased red cell destruction increases the load of bilirubin to be cleared, which leads to increased serum levels of unconjugated bilirubin and increased excretion of urobilinogen. Increased levels of circulating bilirubin give the skin a yellowish tone, which is called jaundice. In newborns, the albumin levels for bilirubin transport are low and the amount of liver glucuronidase available for bilirubin conjugation is low, which may cause an accumulation of toxic unconjugated bilirubin. Unconjugated bilirubin is toxic because in this form it is lipid soluble and can easily cross cell membranes. This form of bilirubin has a high affinity for basal ganglia of the central nervous system. The conjugated form of bilirubin is water soluble but lipid insoluble so it cannot cross cell membranes.3,16
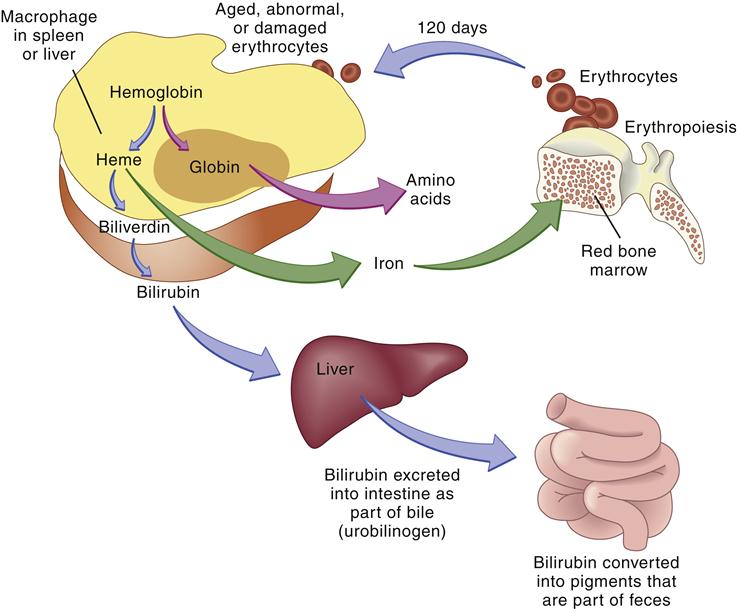
The globin and iron portions are conserved and reused. Heme is reduced to bilirubin, eventually degraded to urobilinogen, and excreted in the feces. Thus, indirect indicators of erythrocyte or erythrocyte destruction include the blood bilirubin level and urobilinogen concentration in the feces. (From Thibodeau GA, Patton KT: Anatomy & physiology, ed 6, St Louis, 2007, Mosby, p 654.)
Gas Transport and Acid-Base Balance
RBCs have many important functions in the body related to gas transport and acid-base balance.3,16,17 RBCs contain hemoglobin, which is responsible for oxygen transport to the body tissues.3,16 Oxygen combines with the heme portion of hemoglobin to form oxyhemoglobin in a loose and reversible bond in the pulmonary capillary attributable to a high partial pressure of oxygen (PO2) and is carried to the tissues with a low PO2, where it is released.17 Large quantities of carbonic anhydrase in RBCs catalyze the reaction between CO2 produced by cellular metabolism in the tissues and water to form carbonic acid, which dissociates into hydrogen and bicarbonate ions for elimination by the lungs and kidneys. Approximately 90% of the CO2 in the arterial blood and 60% of the CO2 in the venous blood are transported as bicarbonate. Finally, the hemoglobin protein directly binds with the remaining CO2 to form carbaminohemoglobin for CO2 transport. Carbamino compounds are acid-base buffers responsible for as much as 50% of the whole blood–buffering power.3,16
Oxygen Transport
Transport of oxygen to the body tissues and removal of carbon dioxide is a complex process involving interdependent function of the lungs, heart, and blood (Figure 13-13). Approximately 97% of oxygen in the blood is transported on red cells loosely and reversibly combined with hemoglobin (oxyhemoglobin), and 3% is dissolved in plasma. Each hemoglobin molecule can bind four atoms of oxygen. Despite a combining potential of 1.39 ml of oxygen per gram of hemoglobin in pure hemoglobin, a maximum of about 1.34 ml of oxygen per gram of hemoglobin is available, owing to a reduction of about 4% by impurities such as methemoglobin. The blood of an average person contains approximately 15 g of hemoglobin per 100 ml of blood. Therefore, in the average person, the hemoglobin in 100 ml of blood can combine with approximately 20 ml of oxygen if the hemoglobin is 100% saturated. This value is expressed as 20 vol%.17,18
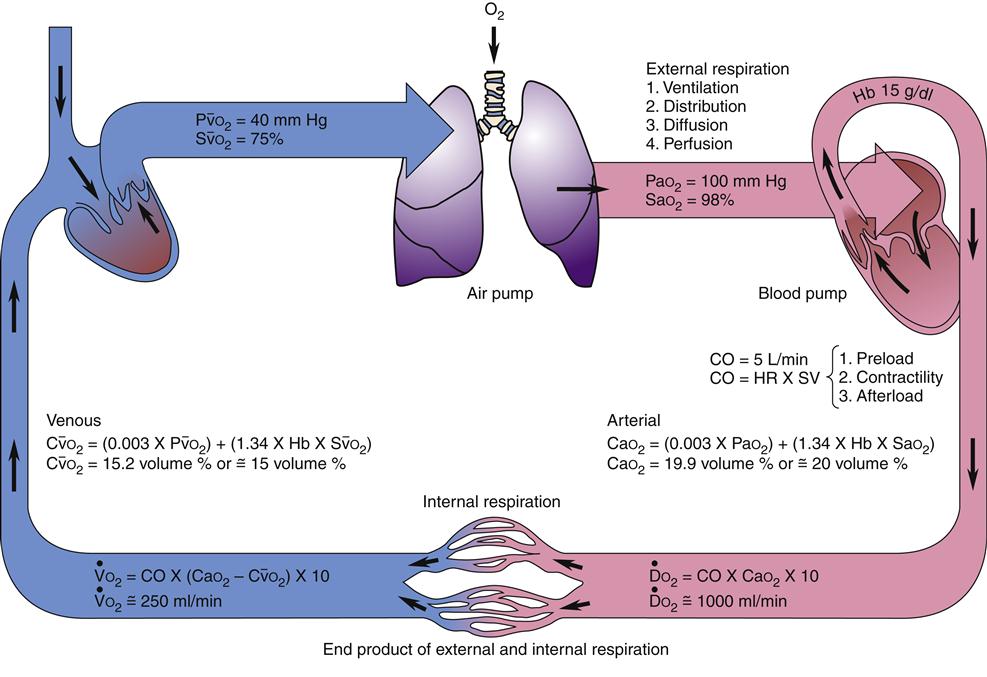
Diffusion of oxygen into the pulmonary capillaries occurs when alveolar PO2 exceeds capillary PO2. Maintenance of this gradient is dependent on adequate alveolar ventilation and perfusion. Delivery of oxygenated blood to the tissues (
 ) is determined by the content of oxygen in the blood (CaO2) and the cardiac output (CO). The difference between arterial and venous oxygen is a reflection of oxygen consumption by tissues (
 ). Hb, Hemoglobin; HR, heart rate; SV, stroke volume.
The partial pressure of oxygen (PO2) reflects the pressure or tension that oxygen exerts when it is dissolved in blood. Partial pressure is measured in millimeters of mercury (mm Hg). In the pulmonary capillaries, where PO2 is high, oxygen binds efficiently with hemoglobin, but in the tissue capillaries, where PO2 is low, oxygen is released from hemoglobin. The partial pressure affects the tendency of oxygen to bind with hemoglobin.19 The partial pressure of oxygen in arterial blood (PaO2) is usually 80 to 100 mm Hg, whereas the partial pressure of oxygen in venous blood (P O2) is usually 35 to 40 mm Hg. The amount of hemoglobin bound to oxygen relative to the total amount of hemoglobin is expressed as the oxygen saturation, in a percentage.19,20 Saturation of arterial blood with oxygen (SāO2) is normally 95% to 100%, whereas that of venous blood (S
 O2) is 60% to 80%.17–20
The oxygen-hemoglobin dissociation curve (Figure 13-14) describes the relationship between PO2 and SO2. The upper part of the curve represents oxygen uptake in the lungs and demonstrates that significant changes in PO2 result in only small changes in SO2 to help ensure adequate oxygen delivery to the tissues.18,19 On the steep lower portion of the curve, reflecting the venous blood, small changes in venous PO2 result in large changes in S O2.19 Therefore, the tissues are protected with an available oxygen reserve as large quantities of oxygen are released from the blood for relatively small decreases in PO2. Normally, tissue PO2 does not rise above 40 mm Hg to enhance diffusion of oxygen from the blood to the tissues. The strength of the bond between hemoglobin and oxygen is called the oxygen-hemoglobin affinity. For any given PO2, hemoglobin saturation will be higher when affinity is increased and saturation will be lower when affinity is decreased. Changes in hemoglobin affinity are represented by shifts in the oxyhemoglobin dissociation curve (see Figure 13-14). Shifts in the oxyhemoglobin curve affect the ability of hemoglobin to bind O2 in the lungs and release it in the tissues. The ability of hemoglobin to release oxygen to the tissues is commonly assessed at point P50 on the oxygen-hemoglobin dissociation curve. The P50 is the PO2 at which 50% of the hemoglobin is saturated. A decrease in oxygen affinity (shift to the right on the oxyhemoglobin dissociation curve) or an increase in oxygen affinity (shift to the left) can be caused by the conditions listed in Figure 13-14.18
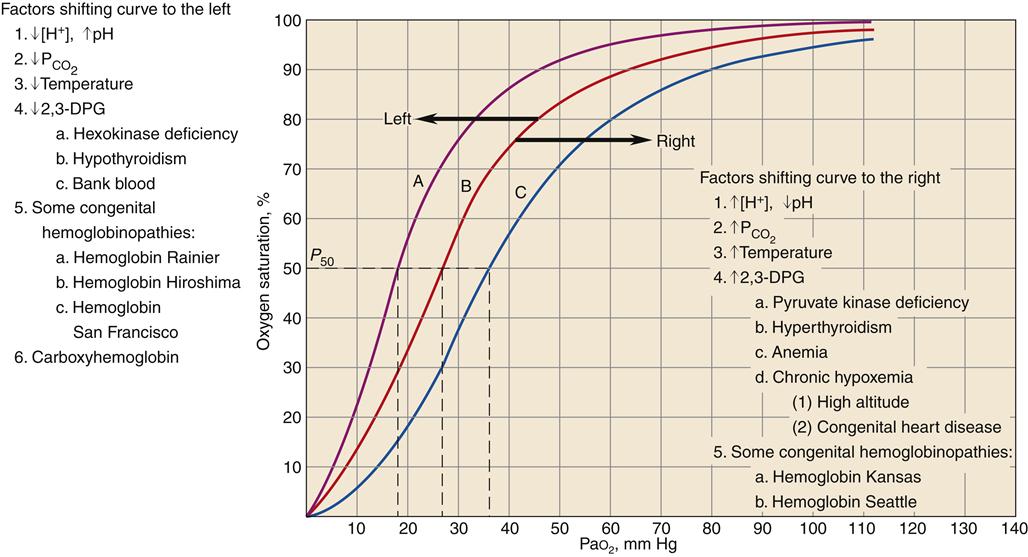
Curve B is the standard oxyhemoglobin dissociation curve. Factors that shift the curve to the left are represented in curve A; factors that shift the curve to the right are represented in curve C. 2,3-DPG, 2,3-Diphosphoglycerate. (Redrawn from Gottlieb JE: Breathing and gas exchange. In Kinney MR et al, editors: AACN’s clinical reference for critical care nursing, ed 3, New York, 1993, McGraw-Hill, p 672.)
A shift of the oxyhemoglobin dissociation curve attributable to changes in the blood levels of PCO2 and the H+ concentration is important to enhance oxygen uptake by the blood in the lungs and the release of oxygen from the hemoglobin to the body tissues. This is called the Bohr effect.17
A shift of the oxyhemoglobin dissociation curve to the right enhances oxygen release to the cell. The shift provides the increase in oxygen delivery that is needed during exercise and other types of stress, as well as in chronic disease states. A shift of the oxyhemoglobin dissociation curve to the left is seen with a decrease in H+ ion concentration, with a decrease in PCO2, with an increase in pH, with a decrease in temperature, with a decrease in 2,3-DPG concentration, in some congenital hemoglobinopathies, and with increased carboxyhemoglobin concentration.
Another important factor affecting O2 delivery to tissues is the arterial oxygen content (CaO2).17,18,20 Arterial blood oxygen content (CaO2) and venous blood oxygen content (CvO2) can be calculated by adding the amount of oxygen combined with hemoglobin, and the amount of oxygen dissolved in plasma (Table 13-4).
TABLE 13-4
GAS VALUES SIGNIFICANT TO THE OXYGENATION OF BLOOD
| GAS VALUES | DESCRIPTION | MEASUREMENT/REFLECTION | CALCULATION/FORMULA | NORMAL VALUE/FORMULA |
| CaO2 | Arterial blood oxygen content is amount of oxygen carried in arterial blood | Measured in milliliters of oxygen per deciliter of blood (ml/dl), or vol% | Sum of oxyhemoglobin (15 Hb g/100 ml × 1.34 ml O2/g Hb × 97.5% arterial saturation = 19.6 vol%) + amount of oxygen dissolved in plasma (PaO2 = 100 mm Hg × 0.003 vol%/mm Hg = 0.3 vol%) | ~20 vol% Formula: 19.6 vol% oxyhemoglobin + 0.3 vol% dissolved in plasma = 19.9 vol% |
C O2 O2 | Venous blood oxygen content is amount of oxygen carried in venous blood | Measured in milliliters of oxygen per deciliter of blood (ml/dl), or vol% | Sum of oxyhemoglobin (15 Hb/100 ml × 1.34 ml O2/g Hb × 75% venous saturation = 15.0 vol%) + amount of oxygen dissolved in plasma (C O2 = 40 mm Hg × 0.003 vol%/mm Hg = 0.12 vol%) O2 = 40 mm Hg × 0.003 vol%/mm Hg = 0.12 vol%) | ~15 vol% Formula: 15 vol% oxyhemoglobin + 0.12 vol% dissolved in plasma = approximately 15 vol% |
 | Oxygen delivery or transport is amount of oxygen delivered to tissues | Measured in milliliters of oxygen per minute (ml/min) | Normal arterial: Normal venous: Normal venous: | Normal arterial: ~1000 ml of O2/min Normal venous: ~750 ml of O2/min |
| PaO2 | Partial pressure of oxygen in arterial blood | Measured in millimeters of mercury (mm Hg) Reflects tension or pressure that is exerted by oxygen when it is dissolved in plasma | Normal PaO2 is 80-100 mm Hg | |
| PaCO2 | Partial pressure of carbon dioxide in arterial blood | Measured in millimeters of mercury (mm Hg) Reflects tension or pressure that is exerted by carbon dioxide when it is dissolved in plasma | Normal PaCO2 is 35-45 mm Hg | |
P O2 O2 | Partial pressure of oxygen in venous blood | Measured in millimeters of mercury (mm Hg) Reflects tension or pressure that is exerted by oxygen when it is dissolved in plasma | Normal P O2 is 35-40 mm Hg O2 is 35-40 mm Hg | |
P CO2 CO2 | Partial pressure of carbon dioxide in venous blood | Measured in millimeters of mercury (mm Hg) Reflects tension or pressure that is exerted by carbon dioxide when it is dissolved in plasma | Normal P CO2 is 41-51 mm Hg CO2 is 41-51 mm Hg | |
| SaO2 | Amount of hemoglobin bound to oxygen relative to total amount of hemoglobin, both reduced and bound, in arterial blood | Expressed as percentage | Normal SaO2 is 95-100% | |
S O2 O2 | Amount of hemoglobin bound to oxygen relative to total amount of hemoglobin, both reduced and bound, in venous blood | Expressed as percentage | Normal S O2 is 60-80% O2 is 60-80% | |
 | Oxygen consumption is amount of oxygen consumed by tissues | Measured in milliliters of oxygen per minute (ml/min) |  | Normal  is 200-250 ml of O2/min is 200-250 ml of O2/min |
| Oxygen consumption is derived from difference between arterial oxygen transport and venous oxygen transport |
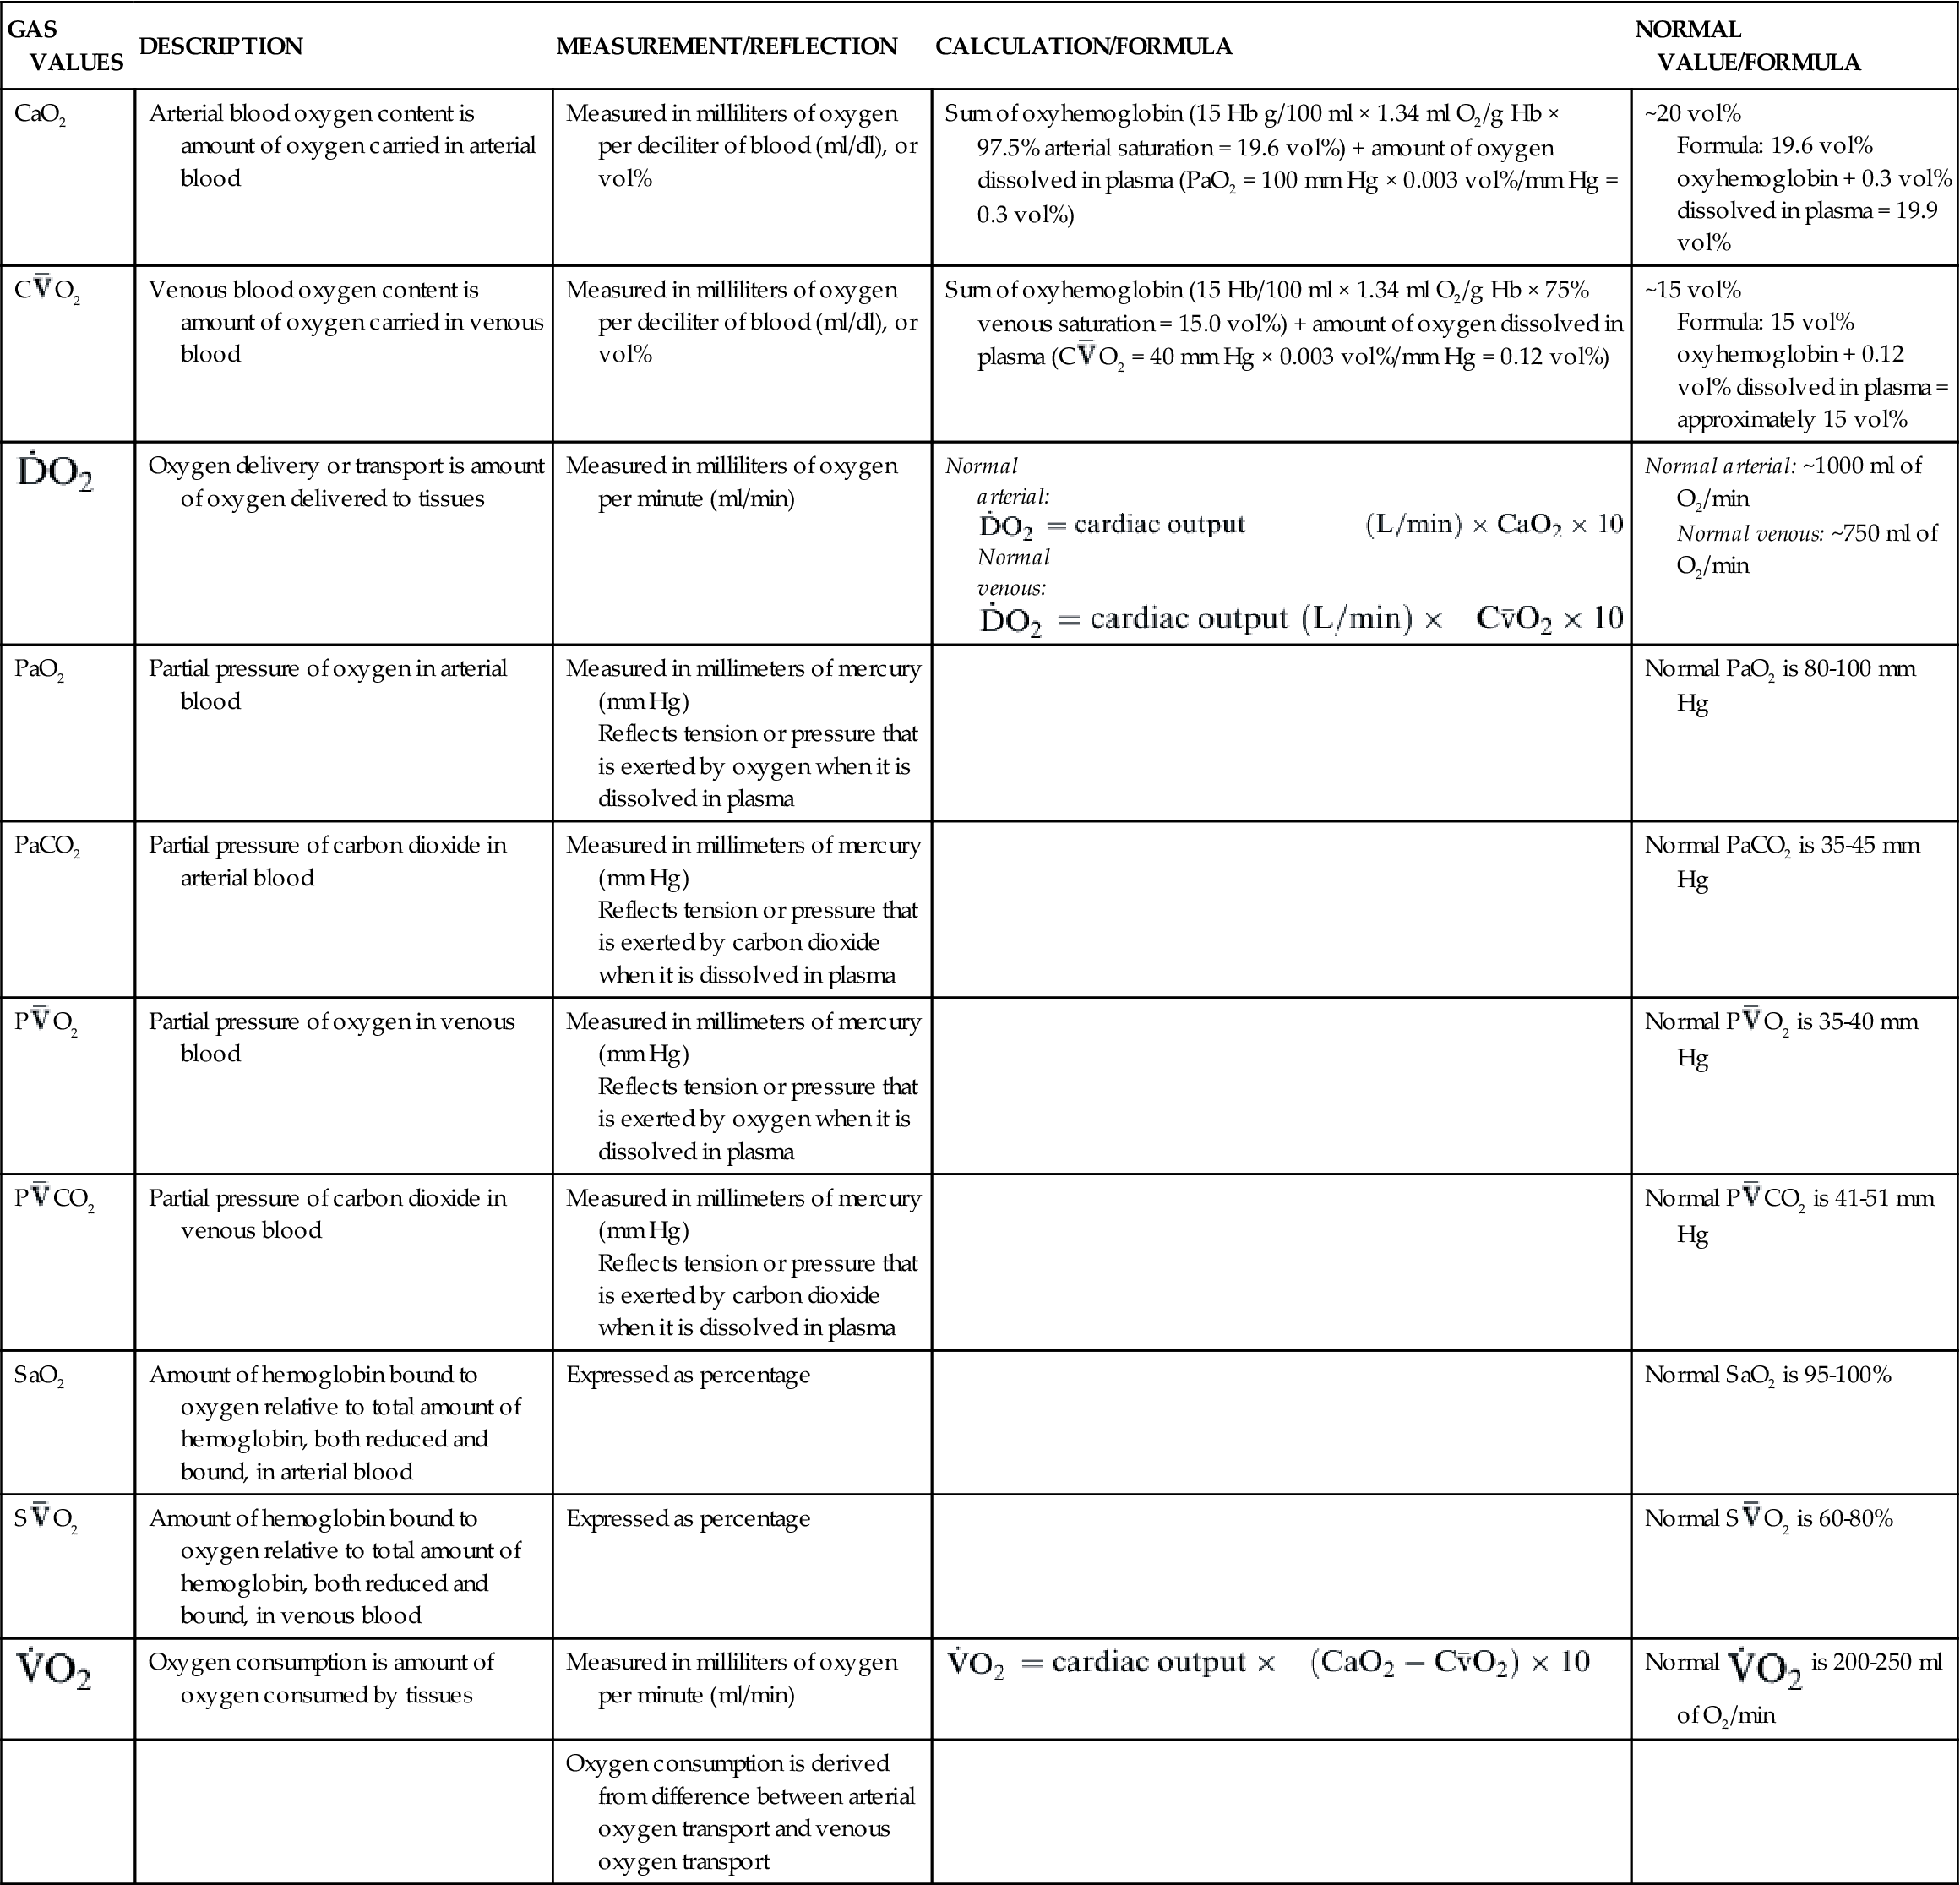
Oxygen delivery, or ( ), is the amount of oxygen (in milliliters) delivered per minute to the tissues.18 It is calculated by multiplying the arterial oxygen content (CaO2) by the cardiac output (CO). Cardiac output is usually between 4 and 8 L/min. Therefore, oxygen delivery is approximately 1000 ml/min.
Oxygen consumption ( ) is the amount of oxygen consumed by the tissues and is measured in milliliters of oxygen per minute. Once the oxygen reaches the tissues, oxygen consumption is controlled by the rate of energy expenditure within the cells or the rate at which adenosine diphosphate (ADP) is formed from ATP to provide energy. The increasing concentration of ADP enhances the metabolic utilization of oxygen.17 Oxygen consumption can be determined by subtracting the oxygen remaining in the venous blood (CvO2) from the oxygen delivered to the tissues by the arteries (CaO2), and is known as the Fick equation.20
Gas values (pressure and content) relative to the oxygenation of blood are summarized in Table 13-4.
Carbon Dioxide Transport
RBCs are also important in the transport of carbon dioxide in the blood. Carbon dioxide, a by-product of cellular metabolism, is transported in three forms in the blood: (1) as dissolved gas, (2) as bicarbonate ion (HCO3−), and (3) in association with hemoglobin (Figure 13-15).17 The partial pressure of carbon dioxide (PCO2) reflects the pressure or tension that carbon dioxide exerts when it is dissolved in the blood. Partial pressure is measured in millimeters of mercury (mm Hg). In the pulmonary capillaries, carbon dioxide easily dissociates from hemoglobin and then diffuses across the alveolar membrane into the alveolar sacs. In the body tissues, the carbon dioxide inside the cells diffuses into the blood and attaches to the hemoglobin as oxygen is released to the tissues. The partial pressure of carbon dioxide in the arterial blood (PaCO2) is usually 40 mm Hg and in the venous blood (PvCO2) it is usually 45 mm Hg.17 These differences are much smaller than those of oxygen, but carbon dioxide diffuses much more readily. Dissolved carbon dioxide combines slowly with water in the plasma to form carbonic acid (H2CO3), but in the red cell the presence of carbonic anhydrase acting as a catalyst significantly accelerates this reaction.17,20 Carbonic acid rapidly dissociates into hydrogen ions (H+) and bicarbonate ions (HCO3−).17,20 As the concentration of HCO3− in the red cell increases, it diffuses into the plasma, whereas the H+ remains. This increase in intracellular cation concentration causes the anion chloride to diffuse from the plasma into the red cell to maintain electrical neutrality. This is referred to as the chloride shift.18
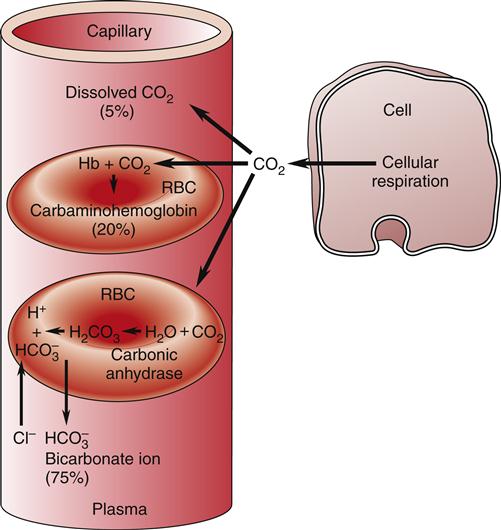
Transportation of CO2 (1) as dissolved gas, (2) as bicarbonate ion (HCO3−), and (3) in association with hemoglobin (Hb).
Hemoglobin provides an excellent acid-base buffer by reacting with the free hydrogen ions and directly with carbon dioxide to form carbaminohemoglobin (HbCO2), which is easily dissociated in the lungs to yield free carbon dioxide for exhalation.17 Unloading of oxygen in the tissue facilitates the loading of carbon dioxide and is referred to as the Haldane effect.17,18
Alterations in Oxygen Transport
There must be sufficient circulating hemoglobin mass to meet the metabolic needs of the body. A feedback mechanism ensures that when the amount of oxygen reaching the tissues decreases, a compensatory increase occurs in the production of red cells.3 The feedback mechanism regulating RBC production is under the control of erythropoietin. As stem cells differentiate into the erythroid committed line, the most primitive stem cell is referred to as the erythroid burst-forming unit (BFU-E), which is controlled by growth factors derived from T lymphocytes and macrophages and, to a lesser degree, by erythropoietin.2,4 The BFU-E further differentiates into erythroid colony-forming units (CFU-E) more responsive to erythropoietin, and subsequently into normoblasts and mature RBCs.2–4 The majority of erythropoietin is actively secreted by the kidney. Another 10% of erythropoietin is formed elsewhere in the body.2–4


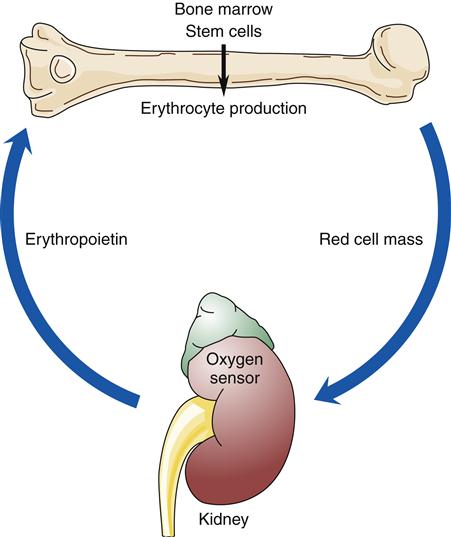
Factors that decrease hemoglobin mass (such as anemia) or decrease arterial saturation (such as hypoxia from either cardiac or pulmonary conditions) impair oxygen delivery to the body tissues. This stimulates an increased release of erythropoietin and the production of RBCs.3 Figure 13-16 illustrates the compensatory regulation of erythropoiesis that is seen in hypoxia, anemia, and polycythemia.
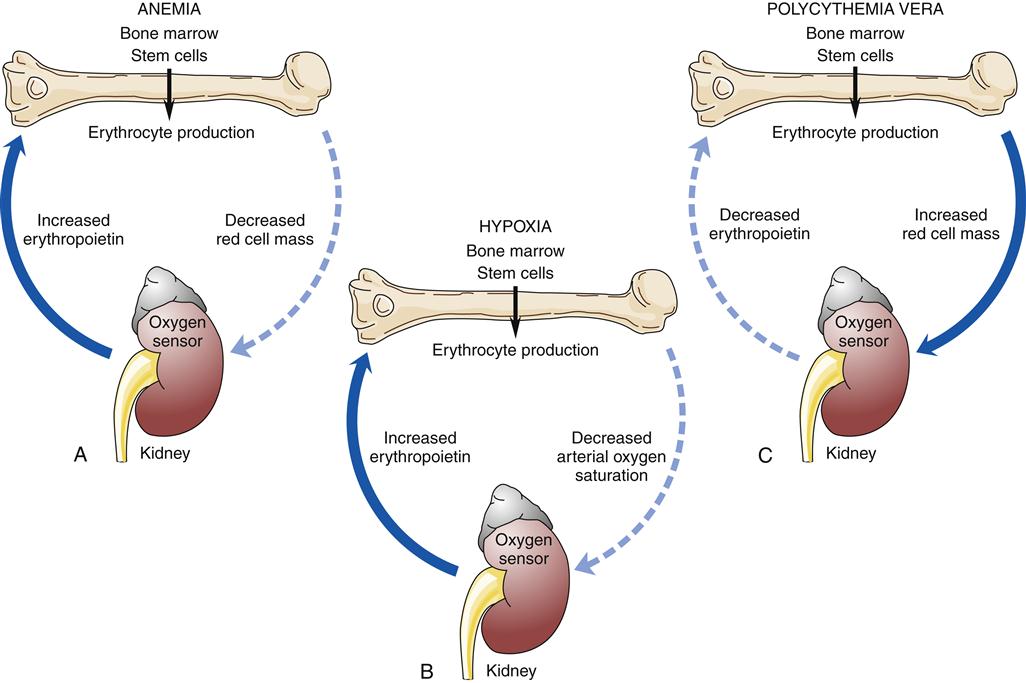
Any factor decreasing oxygen delivery to the oxygen sensor cells results in increased secretion of erythropoietin and a compensatory increase in erythrocyte production as illustrated in (A) for anemia, with a decrease in erythrocyte mass; and in (B) for hypoxia, with a decrease in arterial oxygen saturation. An increase in erythrocyte mass, as occurs with polycythemia vera (C), decreases erythropoietin production.
Anemia
Erythrocyte disorders are divided into two groups: (1) anemia, defined as a deficit of red cells, and (2) polycythemia, defined as an excess of red cells (Box 13-1).21,22 An anemic patient has tissue hypoxia attributable to the low oxygen-carrying capacity of the blood. In contrast, a patient with polycythemia has increased blood viscosity and volume attributable to the increase in the number of RBCs.22 (Polycythemia is discussed in greater detail later in this chapter.) Table 13-5 presents the laboratory findings for erythrocyte disorders in terms of relative anemia, absolute anemia caused by decreased RBC production, and absolute anemia caused by increased RBC destruction.
BOX 13-1
CLASSIFICATION OF ANEMIA AND POLYCYTHEMIA
I. Anemia
A. Absolute
1. Decreased red cell production
(a) Acquired
1) Pluripotent stem cell failure
{3} Viruses
{4} Idiopathic
b) Anemia of leukemia and myelodysplastic syndrome
c) Anemia associated with marrow infiltration
d) Anemia associated with chemotherapy
2) Erythroid progenitor cell failure
c) Acquired sideroblastic anemia
3) Functional impairment of erythroid progenitors
c) Acute megaloblastic anemia due to nitrous oxide
d) Drug-induced megaloblastic anemia
{3} Anemia from other nutritional deficiencies
{6} Anemia caused by chemical agents
{7} Anemia caused by thalassemias
(b) Hereditary
1) Pluripotent stem cell failure
{1} Fanconi anemia
2) Erythroid progenitor cell failure
{2} Congenital dyserythropoietic syndrome
3) Hereditary sideroblastic anemia
4) Thalassemias
2. Increased red cell destruction or loss
(a) Acquired
1) Mechanical
a) Macroangiopathic (artificial heart valves)
c) Parasites and microorganisms
4) Chemical and physical injury
(b) Hereditary
1) Hemoglobinopathies (sickle cell)
2) Red cell membrane disorders
4) Porphyrias
B. Relative (increased plasma volume)
2. Pregnancy
3. Athletes
Stay updated, free articles. Join our Telegram channel

Full access? Get Clinical Tree


