Thiamin1


Thiamin1


Chantal BéMeur

Roger F. Butterworth


HISTORICAL OVERVIEW

Chinese medical texts referred to the condition known as beriberi as early as 2700 BC, but it was not until 1884 AD that Takaki, a surgeon general in the Japanese navy, showed that the disease was the consequence of a dietary inadequacy. Many years later, Eijkman, a military doctor in the Dutch East Indies, discovered that fowl fed a diet of cooked, polished rice developed paralysis that he attributed to a nerve poison in the endosperm of the grain.

A colleague, Grijns, later correctly interpreted the connection between excessive consumption of polished rice and beriberi. Indeed, he concluded that rice contained an essential nutrient in the outer layers of the grain that was removed in polishing (1). In 1911, Funk isolated an antineuritic substance from rice bran that he called a “vitamine” because it contained an amino group. Dutch chemists went on to isolate and crystallize the active agent whose structure (Fig. 21.1) was determined in 1934 by Williams, a US chemist. Thiamin was synthesized in 1936.


CHEMISTRY AND METABOLISM

Thiamin, a water-soluble vitamin also known as vitamin B or aneurin, is chemically defined as 3-(4-amino-2-methylpyrimidyl-5-methyl)-5(2-hydroyethyl)-4-methylthiazolium (see Fig. 21.1) and has a molecular weight (as the hydrochloride salt) of 337.3 (2). Aqueous solutions of thiamin are stable at acid pH but are unstable in alkaline solutions or when exposed to ultraviolet light. Both the pyrimidine and thiazole moieties (see Fig. 21.1) are required for biologic activity (3). Thiamin is readily cleaved at the methylene bridge by sulfite treatment at pH 6.0.


DIETARY SOURCES AND RECOMMENDED DIETARY ALLOWANCES

Thiamin concentrations are highest in yeast and in the pericarp and germ of cereals (3, 4). Table 21.1 summarizes major dietary sources of thiamin. Nowadays, most cereals and breads are fortified with thiamin. Conversely, milk and dairy products, seafood, and most fruits are poor sources of thiamin. Thiamin is also absent from refined sugars. Thiamin is sensitive to high temperatures, and prolonged cooking of foods may result in a loss of thiamin content. Baking of bread, for example, leads to a 20% to 30% reduction in thiamin content, and pasteurization of milk may also result in thiamin losses of up to 20%. In contrast, freezing of foods does not result in significant reductions of thiamin content. Because thiamin is a watersoluble vitamin, significant amounts are lost in discarded cooking water. Thiamin is also destroyed by rays and by ultraviolet irradiation of food stuffs (3, 4). Dietary reference intake values for thiamin by life stage group (4) are shown in Table 21.2.


Fig. 21.1. The thiamin molecule consists of a pyrimidine ring and a thiazole moiety, which are linked by a methylene (CH2) bridge. Thiamin is a water-soluble white crystalline solid.


THIAMINASES AND ANTITHIAMIN COMPOUNDS IN FOODS

Certain foods contain thiaminases—thermolabile enzymes that rapidly degrade thiamin (3). Thiaminase I is encountered in some raw fish, shellfish, and ferns, as well as in microorganisms such as Clostridium thiaminolyticus. Thiaminase II, which has an action distinct from that of thiaminase I, is found in other organisms such as Candida aneurinolytica. Thiaminases act during food storage or during passage through the gastrointestinal tract. Consequently, regular consumption of raw fish (with or without fermentation), raw shellfish, and ferns is a risk factor for the development of thiamin deficiency. Antithiamin compounds are thermostable and have been identified in some ferns, teas, and betel nut, in which the toxic agents were found to be analogs of polyphenolic compounds such as tannic acid (tannin).


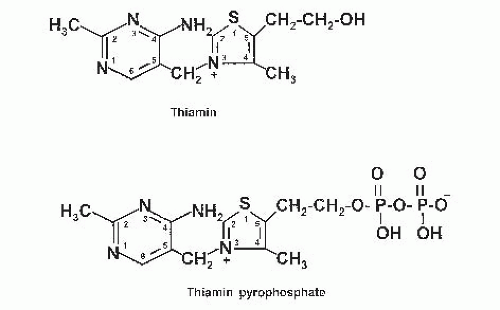


TABLE 21.1 THIAMIN CONTENT OF COMMON FOOD


FOOD TYPE


THIAMIN CONTENT (mg/100 g)


Wheat flour (whole meal)


0.4-0.5


Rice


Whole rice


0.50


Polished rice


0.03


Rice bran


2.30


Vegetables


Peas


0.36


Other legumes


0.4-0.6


Potatoes


0.10


Cow’s milk


0.04


Meats


Beef


0.3


Lamb


0.2


Pork


≤1.0


Poultry


0.1


Refined sugars


Nil


ABSORPTION, TRANSPORT, AND EXCRETION

Thiamin is absorbed by the small intestine by two distinct mechanisms, namely, active transport (at concentrations <2 µmol/L) and passive diffusion (at higher concentrations) (3). Active thiamin transport is greatest in jejunum
and ileum. Intestinal transport of thiamin is rate limiting in humans. Following uptake from the gastrointestinal tract, thiamin is transported by the portal blood to the liver.


TABLE 21.2 CRITERIA AND DIETARY REFERENCE INTAKE VALUES FOR THIAMIN BY LIFE STAGE GROUP


EARa (mg/d)


RDAb (mg/d)


LIFE STAGE GROUP


CRITERION


MALE


FEMALE


MALE


FEMALE


AIc (mg/d)


0-6 mo


Average thiamin intake from human milk


0.2


7-12 mo


Extrapolation from adult requirements


0.3


1-3 y


Extrapolation from adult EAR


0.4


0.4


0.5


0.5


4-8 y


Extrapolation from adult EAR


0.5


0.5


0.6


0.6


9-13 y


Extrapolation from adult EAR


0.7


0.7


0.9


0.9


14-18 y


Extrapolation from adult EAR


1.0


0.9


1.2


1.0


18->70 y


Depletion/repletion studies; erythrocyte transketolase activity


1.0


0.8


1.2


1.1


Pregnancy


14-50 y


Adult female EAR plus estimated daily thiamin accumulation by fetus


1.2


1.4


Lactation


14-50 y


Adolescent female EAR plus average amount of thiamin secreted in human milk


1.2


1.4


a EAR, estimated average requirement, the intake that meets the estimated nutrient needs of half the individuals in a group.

b RDA, recommended dietary allowance, the intake that meets the estimated nutrient needs of almost all (97% to 98%) individuals in a group.

c AI, adequate intake, the observed average of experimentally determined intake by a defined population or subgroup that appears to sustain a defined nutritional status, such as growth rate, normal circulating nutrient values, or other functional indicators of health. The AI is used if sufficient scientific evidence is not available to derive an EAR. For healthy infants receiving human milk, the AI is the mean intake. The AI is not equivalent to an RDA.


Reproduced with permission from Food and Nutrition Board, Institute of Medicine. Dietary Reference Intakes for Thiamin, Riboflavin, Niacin, Vitamin B6, Folate, Vitamin B12, Biotin, and Choline. Washington, DC: National Academy Press, 1998:58-86.


TABLE 21.3 THIAMIN TURNOVER RATES IN PERIPHERAL NERVE, SPINAL CORD, AND BRAIN REGIONS


THIAMIN TURNOVER RATE


(µg/g tissue/h)


Peripheral nerve


0.58


Spinal cord


0.39


Brain


Cerebellum


0.55


Medulla oblongata


0.54


Pons


0.45


Hypothalamus


0.36


Midbrain


0.29


Striatum


0.27


Cerebral cortex


0.16


Adapted from Rindi G, Patrini C, Comincioli V et al. Thiamine content and turnover rates of some rat nervous regions, using labeled thiamine as a tracer. Brain Res 1980;181:369-80, with permission.


In the normal adult human body, total thiamin concentrations have been estimated to be of the order of 25 to 30 mg. Skeletal muscle, heart, liver, kidney, and brain contain relatively high thiamin concentrations. Thiamin turnover rates in brain are region dependent (Table 21.3), with highest turnover rates evident in more caudal brain structures such as striatum and cerebral cortex (5). Given these relatively fast turnover rates and because thiamin is not stored to any large extent in tissue, a continuous dietary supply is necessary. Thiamin and its acid metabolites (2-methyl-4-amino-5-pyrimidine carboxylic acid, 4-methylthiazole-5-acetic acid, and thiamin acetic acid) are excreted principally in the urine (3).


ASSESSMENT OF THIAMIN STATUS

Measurements of blood thiamin levels and urinary thiamin excretion are not reliable indicators of thiamin status. Consequently, these measurements have been replaced by indirect assays of thiamin status based on measurement and activation of the thiamin diphosphate (TDP)-dependent enzyme transketolase in red blood cell hemolysates (6) or direct measurement of TDP in these hemolysates using high-performance liquid chromatography (HPLC) (7).


Erythrocyte Transketolase Activation Assay

The widely used erythrocyte transketolase activation assay is based on measurement of transketolase activity in hemolysates of red blood cells in the absence of (and in the presence of) added excess cofactor (TDP). The enzymatic reaction catalyzed by transketolase is as follows:


Xylulose-5-phosphate + ribose-5-phosphate D sedoheptulose-7-phosphate + glyceraldehyde-3-phosphate

Samples of hemolyzed whole blood are incubated at 37°C with the enzyme substrate (ribose-5-phosphate) in a buffer at pH 7.4, with or without added TDP (10 mM). The product, sedoheptulose-7-phosphate, produced per milliliter of blood per hour, is a measure of transketolase activity. The difference in enzymatic activity between the sample to which excess TDP has been added and the sample without added excess cofactor is then defined as the TDP effect.

In physiologically normal human volunteers, hemolysate transketolase activities are in the range of 90 to 160 µg sedoheptulose formed/mL per hour, and the TDP effect values range from 0% to 15%, depending on the levels of circulating TDP in normal subjects. Patients with marginal thiamin deficiency have TDP effect values in the 15% to 25% range, and those with values in excess of 25% are generally considered thiamin deficient. Following parenteral thiamin administration to thiamin-deficient patients, TDP effect values generally return to normal ranges within 24 hours (6).


High-Performance Liquid Chromatography

The advent of HPLC led to the publication of several procedures to measure thiamin and its phosphate esters in blood directly. One of the most reliable of these methods makes use of HPLC and precolumn derivatization. Blood samples are hemolyzed and deproteinized with perchloric acid, and supernatants are then oxidized to their thiochrome derivatives following the addition of potassium ferricyanide and sodium hydroxide and subsequent neutralization. When this technique is used, analysis times are short and recovery is excellent. The reference value for TDP in healthy volunteers is 120 ± 17.5 nmol/L (8). The HPLC method is precise and yields results similar to those of the erythrocyte activation assay (9).


FUNCTIONS OF THIAMIN IN METABOLISM


Enzyme Cofactor

After uptake into the cell, thiamin is rapidly phosphorylated to its diphosphate ester (TDP), previously referred to as thiamin pyrophosphate. TDP is an essential cofactor for enzymes involved in glucose and amino acid metabolism (10, 11, 12). Such enzymes include the following: transketolase, a key component of the pentose shunt pathway; pyruvate dehydrogenase complex, an enzyme complex situated at the point of entry of pyruvate carbon into the tricarboxylic acid cycle; α-ketoglutarate dehydrogenase (α-KGDH), a rate-limiting enzyme and constituent of the tricarboxylic acid cycle; and branched-chain keto acid dehydrogenases. The first three of these TDP-dependent enzymes are implicated in glucose and energy metabolism by the cell, as shown in simplified schematic form in Figure 21.2.

Only gold members can continue reading. Log In or Register to continue

Stay updated, free articles. Join our Telegram channel

Jul 27, 2016 | Posted by in PUBLIC HEALTH AND EPIDEMIOLOGY | Comments Off on Thiamin1

Full access? Get Clinical Tree

Get Clinical Tree app for offline access