- The information flow in organisms moves from the genome to the transcriptome to the proteome. On various levels, there are control mechanisms. The system is highly dynamic, and the study of the total system is called systems biology.
- Cancers are systems diseases in which tumor cells are critically reliant on a strong supporting cast of stromal and immune cells and the whole performance is executed within the highly individualized setting of a specific organ in a particular individual and over a protracted time course during which the entire cast has lived through a variety of different environments. Each contributor is invaluable in realizing the whole, and if cancers were awarded Oscars then every tumor would get a myriad of nominations.
- New technologies colloquially summarized as “omics” (e.g. genomics, transcriptomics, proteomics, and metabolomics) aim at system-wide (viz., cell-, tissue-, or body-wide) recording of genetic, transcriptional, translational, posttranslational, and metabolic alterations relating to disease or any physiological process of interest. Omics data represent statistical averages of large populations of cells, or entire tissues or sections thereof. They lack spatiotemporal information on what happens when and where, and they lack information on the interactions of the recorded factors. Such information can in parts be obtained by cellular or subcellular fraction and time-lapse experiments which, however, are difficult to realize in vivo. Toponomics provides data with spatiotemporal resolution, including information on protein interactions directly in situ.
- Proteomics analyzes the protein content of cells, tissue, or plasma and derivatives thereof. It usually involves the separation of the proteins by SDS-PAGE to reduce the complexity of the protein mixtures or 2D electrophoresis (isoelectric focusing plus SDS-PAGE) to isolate individual proteins, followed by the identification of the proteins by mass spectrometry (MS). The identification is done by fragmentation of the proteins with enzymes such as trypsin, determination of the masses of the fragments by MS to obtain a peptide mass fingerprint (PMF) of every protein, and/or further fragmentation of the fragments by physical means such as collision with inert gases (collision-induced disintegration (CID)) or disintegration upon high-intensity laser excitation (postsource decay (PSD)) and mass spectrometry of the resulting subfragments with subsequent correlation of the spectra with theoretical spectra computed from a reference protein sequence database.
- Mass spectrometry is among the important tools for systems biology and is used in proteomics, peptidomics, glycomics, lipodomics, metabolomics, and so on to address the corresponding classes of biomolecules. The principles of this technology are ionization and vaporization of the analytes, separation of the resulting ions, determination of their mass-to-charge ratios, and detection of the ions. Accordingly, a mass spectrometer consists of three parts: an ion source, a mass analyzer, and a detector.
- Transcriptomics deals with the analysis of transcriptomes (i.e. the RNA content of cells). Transcriptomics provides information on the expression of genes and splice variations of the gene products. Most often, DNA arrays are used for genome-wide or focused transcriptome analyses. More recently, next-generation sequencing is used for the purpose. It has the advantages that genome-wide analyses are possible without prior definition of the target genes and that it provides sequence-level information on splice variants. In contrast, quantification of the expression levels is more indirect than with the microarray hybridization technologies. The main disadvantage, however, is the high costs compared to microarray hybridization.
- Next-generation sequencing is highly parallel sequencing of DNA which covers the human genome several-fold in a single run within a few days. The separation of amplified DNA by gel or capillary electrophoresis, as with conventional DNA sequencing, is replaced by stepwise sequencing reactions on templates fixed to plane surfaces or particles where light is emitted and recorded at every step. The reactions are done in successive rounds for the four nucleotides or with nucleotides carrying different color fluorochromes. The succession of light signals translates into the nucleotide sequences. Read lengths per run are, depending on the technology used, in the order of 35 to several hundred. Genome sequences are generated by projecting these short sequences onto a human genome reference sequence. Next-generation sequencing is employed for genome sequencing or resequencing for identification of mutations, for expression analysis, and for promoter and DNA methylation analysis. Because of the short reads, it is not well suited for the identification of chromosomal aberration, where array comparative genomic hybridization would be the method of choice.
- Systems biology seeks to integrate omics data into models for a disease or any other biological state or process of interest. This involves large-scale data collection and processing and the development of biomathematical models suitable for experimental testing.
- Research in systems biology is often undertaken on model organisms such as yeast, Drosophila melanogaster (fruit fly), and mouse or in cell cultures.
- Cancer genomes, as revealed by next-generation sequencing and comparative genomic hybridization, deviate to varying extents from the genomes of normal somatic cells.
- The number and nature of genetic or chromosomal aberrations differ greatly across different types of tumor. Thus, around 30–40 tumor-specific mutations have been found in childhood neuroblastoma compared to about 50 000 in breast cancer or colon carcinoma. Chromosomes may appear intact in many cancers, whereas in CML, the aberrant Philadelphia chromosome is both pathognomonic and a marker for the presence of the BCR–ABL fusion protein. On the other hand, in cutaneous T-cell lymphomas large numbers of chromosomal aberrations, sometimes involving all chromosomes, occur without known oncogenic products.
- Cancer cells express unique protein networks that allow them to organize themselves successfully in order to realize the hallmark features described in this book. Such networks are likely to be specific for each cancer cell type and to determine their specific behavior.
- Theoretically, different cancer cell types can form myriads of different protein networks with the identical proteins simply by differentially assembling them as different protein clusters to execute different cellular functionalities. For example, given 20 different proteins (#1 to #20), all expressed in two different cell types with the same abundance, cell type 1 may assemble proteins #1 + #5 + #20 to form a functional protein cluster at the cell surface membrane to initiate and control cell migration. Cell type 2 may assemble the same proteins plus proteins #15 and #16 (hence #1 + #5 + #20 + #15 + #16) to encode the opposite function, namely, stop migration and enter cell division, and an assembly of proteins #8 + #9 + #11 in this latter cell type may encode the opposite: initiation of the protein network that induces migration. Each of these protein clusters would have a unique subcellular topology that is essential for the execution of said functionalities.
- Protein arrangements and differential assembly rather than regulation of expression (up- or downregulation) may be the essential cell biological mechanism in (cancer) cells controlling their function.
- Protein networks cannot be predicted by current large-scale ex vivo expression-profiling technologies because these techniques average protein (proteomics) or messenger RNA (mRNA) abundances (transcriptomics) in millions of pooled and homogenized cells or in entire tissues. Subcellular topologies of the proteins and, in many cases, protein clusters of interest are destroyed in the process.
- Toponomics is a branch of systems biology addressing the toponome, defined as the entire protein network code of morphologically intact cells and tissues.
- Toponomics is based on the capability to map the subcellular combinatorial molecular structure of a large number of distinct proteins and other molecular species with subcellular resolution.
- Although it is hoped that in the future new developments in matrix-assisted laser desorption ionization (MALDI) imaging or other in situ proteomics techniques will help address these questions, at this time limited resolution limits their use.
- An exciting alternative possibility results from the high resolution of microscopy and the exquisite sensitivity of antibodies for their cognate protein epitope targets. Traditionally, these techniques have been invaluable in unraveling the spatiotemporal expression of one or a very small number of proteins but have been unable to study sufficient numbers of proteins concurrently to be genuine systems biology tools.
- Robotic workstations have now been developed to include microscopic technologies (Toponome Imaging System (TIS)) capable of running fluorescence cycles of protein or molecule tagging, imaging, and bleaching in situ on morphologically intact cells and tissues, thereby overcoming the spectral and wavelength limitations of traditional fluorescence microscopy.
- These techniques’ data sets, which can be used for co-mapping 100 different molecular species or more in one experiment, contain information on protein abundance (regulation), protein arrangement or rearrangement, and subcellular or transcellular protein network structures at currently 120 to 200 nm subcellular resolution in up to 6000 cells simultaneously.
- A three-symbol code for rapid detection and quantification is one of several approaches to denominate multiplex protein-imaging data and detect functional hierarchies of the toponome code.
Introduction
The best way to get a good idea is to get a lot of ideas.
Linus Pauling
The sequencing of the human genome and the genomes of model organisms such as rat, mouse, the nematode worm Caenorhabditis elegans, and the fruit fly D. melanogaster as well as phylogenetically related organisms has revolutionized biology. The impact of this revolution will not only be felt in the biological sciences but also ultimately transform clinical medicine. Non-invasive diagnosis and treatment, disease prediction, and personalized medicine are expected developments resulting from the genomics revolution.
Interaction between chemistry, biology, bioinformatics, mathematics, statistics, and physics is necessity to deal with the complicated biological systems and the large quantities of data acquired with high-throughput techniques. To understand why a cancer cell differs functionally from a normal cell, among others, one must consider the complex interplay between molecular networks involved in regulating gene expression, signaling, protein synthesis, and metabolism across time and space, and how these processes are affected by mutations, and epigenetic and chromosomal alterations. The complexity of the networks, the existence of feedforward and feedback loops, and multiple interaction points provide ample opportunities for the application of the evolving discipline of systems biology comprising informatics, computational modeling, mathematics, and statistics in conjunction with large-scale omics-type data generation, and high-content molecule-imaging technologies. A quote by Paul Nurse, Nobel laureate, illustrates this best:
[P]erhaps a proper understanding of the complex regulatory networks making up cellular systems like the cell cycle will requires a … shift from common sense thinking. We might need to move into a strange more abstract world, more readily analyzable in terms of mathematics than our present imaginings of cells operating as a microcosm of our everyday world.
Information Flow in Cells
Information is not knowledge.
Albert Einstein
It is a very sad thing that nowadays there is so little useless information.
Oscar Wilde
Human life starts as a single cell, a fertilized egg, which develops into a complex organism that contains trillions of cells and thousands of cell types. Cancer too starts as a single cell, a cell with Darwinian tendencies. The information needed for the creation and functioning of a human being is, as with other organisms, largely encoded in the genome. In essence, a genome is an encrypted encyclopedia of life, albeit a very difficult one. The mouse, human, and Drosophila genomes are remarkably similar, and most genes are conserved between species. It is not so much the genes in the genome but the regulatory networks that are responsible for the differences between species. Also, this information is encoded in the genome. The high homology between species explains why, for example, the mouse or the fruit fly can be a useful “model organism” to unravel human physiology and disease.
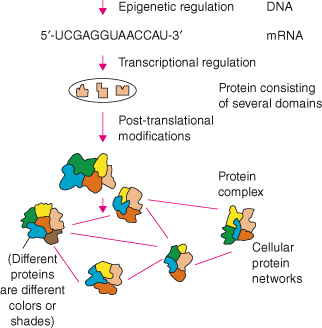
The genome is transcribed into mRNA, and the mRNA is then translated into proteins. The human genome codes for at least 30 000 genes (the number of functional genes is still a matter of much debate), which are transcribed into many more mRNAs that code for a suggested well over 100 000 proteins. At each level, many variations occur making the system very complex (Fig. 20.1). Individuals differ on the genome level by approximately 10 million DNA single-nucleotide polymorphisms (SNPs), but this amounts to only around 0.1% of the genome. However, small changes in the DNA can have fatal effects. Cystic fibrosis, for example, is an endocrine gland disorder that is caused by mutations in the cystic fibrosis transmembrane conductance regulator (CFTR) gene and affects several organs. The CFTR protein functions as an ATP-regulated chloride channel, and deletion of three base pairs in the CFTR gene results in deletion of the amino acid phenylalanine. The mutated chloride channel is dysfunctional, which causes the production of abnormally viscous mucus. In lungs, the viscous mucus is an ideal growth medium for bacteria, and the continuous bacterial growth results in chronic respiratory infections. Ultimately, the permanent tissue damage leads to a range of complications resulting in death.
Figure 20.1 Information flow in the cell – from genome to proteome to cellular networks. On each level, variation has an effect on cell function, and abnormal variation can underlie cancer.
Breast cancer, among other cancers, is also associated with specific mutations in the genome, but its relationship to a single-gene mutation is not as clear as in cystic fibrosis. Many mutations in BRCA1 and BRCA2 genes have been linked to increased chances of developing breast cancer, but these mutations do not predict all cases of breast cancer. This highlights our limited understanding of gene mutations and genetic variation between individuals (including SNPs and other polymorphisms). Many diseases are multifactorial, and different gene mutations conspire with environmental factors (e.g. lifestyle) to influence disease development and outcome. Attributing the role of SNPs and gene mutations to different diseases is a field of much research.
The next level of systems regulation is in the structure of DNA. Expression of genes is not just regulated by transcription factors. Chemical modifications of DNA can alter chromatin structure and therefore gene expression without changing the DNA sequence. The enzyme DNA methyltransferase methylates DNA, especially in CG nucleotide-rich areas called CpG islands, and methylation of DNA and in particular CpG islands alters chromatin structure. Methylated DNA forms condensed chromatin, which is not accessible to transcription factors and leads to gene silencing. Epigenetic regulation involves DNA methylation and demethylation, chromatin remodeling, methyl-binding domain proteins, and histone deacetylation and acetylation (see Chapter 11).
When chromatin is accessible to transcription factors, a gene can be transcribed into mRNA. Each gene can potentially give rise to a number of mRNAs which in turn can be posttranscriptionally regulated. Posttranscriptional regulation usually means splicing of the mRNA transcript, but lifetime and the translation of these transcripts into protein are also regulated. It is now increasingly apparent that much of what has been termed noncoding DNA may direct the production of small RNAs that have profound effects on gene expression and may silence the expression of many genes by a variety of mechanisms, including the formation of double-stranded RNA, which is targeted for destruction by enzymes such as Dicer as described in Chapter 11.
Transcripts are translated into proteins, but much debate still surrounds how this is related to protein levels. Synthesized proteins are often posttranslationally modified. The original protein product can be modified after synthesis by, for example, the attachment of a phosphate group (phosphorylation), methyl group (methylation), sugar moiety (glycosylation), or ubiquitin group (ubiquitination). There are hundreds of protein modifications possible which can be either permanent or temporary. Posttranslational modifications have a multitude of effects and control many cellular processes. Synthesized proteins have an N-terminal sequence tag or are tagged with a modification to ensure that they are transported to the correct cellular compartment. Such tag is akin to a postal code on a letter and guarantees punctual and correct delivery of the protein. As with postal services, this is not flawless. These modifications, ubiquitinylation and sumoylation in particular, can also determine when and how rapidly a protein is degraded, and thus control lifetime and expression levels in the cell. Proteins can also be modified to perform a specific action in a signal transduction pathway. Protein kinases play a crucial role in activating signal transduction pathways by phosphorylating tyrosine, threonine, or serine residues in proteins. Such posttranslational modifications are transient and activate the protein or induce its association with other proteins for a short period of time. Termination of this phosphorylation-induced cellular signal often occurs through de-phosphorylation by protein phosphatases.
Each posttranslationally modified protein is a different protein because it has a different function and may have different interaction partners. Hence, the roughly 30 000 genes probably encode for over a million functionally different proteins. However, proteins rarely function independently in a cell but usually form complexes that function as sometimes complex functional units. Proteins are the individual parts of these functional units, and protein complexes interact with each other forming protein networks. It is these networks that are essential for cellular communication. One of the largest functional units in cells is the well-known spliceosome. The spliceosome consists of approximately 145 proteins and five small RNA molecules. The spliceosome complex is dynamic and undergoes multiple assembly stages and conformational changes during the splicing process. Identifying and characterizing protein complexes, and unraveling pathways and cellular networks, are of critical importance to understand cell biology.
Fig. 20.1 illustrates the complexity of cells and organisms. The integrated study of a biological model is termed “systems biology.” Although systems are often seen as cells, organs, organisms or even ecosystems, a systems approach can also focus on a cellular pathway or a tumor. Biological systems are highly dynamic, and organisms adapt and change constantly to respond to external influences. A sudden large amount of exercise leads to muscle ache due to muscle adaptation and the immune system is activated to deal with infections. This all leads to changes at various levels in, for example, an organism, and a biological system is therefore never static.
Studying dynamic systems such as cells, cancers, or organs is extremely challenging and requires much expertise. Fig. 20.1 summarizes the informational hierarchy and the flow of information in biological systems: the central dogma of molecular biology. This chapter roughly follows this flow of information and will focus on new techniques that play an important role in cancer research. Important discoveries and developments will be discussed and linked to previous chapters. Many technical advances in life science research are pioneered in cancer research. Moreover, cancer research plays a crucial role in the translation of laboratory techniques into clinical applications; key examples will be discussed. At the end of the chapter, a number of Internet resources are given as additional information.
Model Organisms and Cancer Models
Flies, worms, and flowers exceed me still.
Isaac Watts
Yeast, the fruit fly D. melanogaster, zebra fish, puffer fish, mouse, rat, and the nematode worm C. elegans are all established as model organisms. These organisms have been extensively used to study and understand biology. Much information is available on these organisms, and our understanding of human biology has increased by studying them. Each organism is used for different reasons, and an organism is often either a genetic, experimental, or genomic model. The mouse is a particularly interesting model because it is phylogenetically much closer to humans than other model species and its genome is organized similar to the human genome. Much has been learned about normal physiology and cancer using mouse models.
Two premises underlie the use of various animal models in cancer biology. Firstly, such models can contribute to our knowledge of cancer mechanisms, particularly when informed by knowledge derived from studies of human cancers, and thereby can serve for testing hypotheses on oncogenesis and other aspects of cancer. Secondly, such models can be crucial test beds for evaluating therapeutic targets and strategies, aimed at treating, curing, or preventing cancer. In fact, recent advances in regulatable genetic systems allow testing hypotheses of inactivating specific cancer genes or proteins even before a suitable drug has been developed (see Appendix 20.1).
Mice have been employed in cancer research since 1894. Initially, studies focused on same-species tumor transplantations and drug treatment studies. In the 1920s, inbred strains that had been shown to be prone to cancer were first disseminated among cancer researchers. Many more strains of mice were identified following the founding of the Jackson Laboratory in Bar Harbor, Maine, now a preeminent source of mouse cancer models for the research community. In 1962, the identification of the “nude” mutant mouse, which has lowered immunity, largely lacks T lymphocytes, and therefore has minimal tissue rejection capacity, enabled studies with transplanted human tumors which led to major advances in cancer research. More recently, breakthroughs in molecular biology resulted in the development of genetically altered mice in the 1980s. Oncogenes, or other genes that have been hypothesized to cause cancer, could now be investigated in much greater detail. Engineering of genetically altered mice made it possible to create models to address specific processes.
It has been suggested that transforming a normal cell into a cancer cell requires an estimated four to seven rate-limiting genetic events that confer specific properties to the evolving cancer cell. These have been elegantly construed as the hallmark features of cancer, described in previous chapters:
- Capacity to proliferate irrespective of exogenous mitogens;
- Refractoriness to growth-inhibitory signals;
- Resistance to apoptosis;
- Unrestricted proliferative potential (immortality);
- Capacity to recruit a vasculature (angiogenesis);
- Invasion of tumor cells into surrounding tissue;
- Ability to invade surrounding tissue, and metastatic dissemination of tumor cells to distant organs.
To these we may now add the Warburg effect, evasion of immune control, and tissue remodeling.
In humans, the molecular analysis of these multiple steps is rarely possible due to the limited availability of tumor specimens obtained prospectively from all tumor stages. Also, many of these properties involve the entire organism which cannot be directly accessed in patients. In contrast, mouse models of tumorigenesis allow the reproducible isolation of different tumor stages, in addition to normal tissue, which are then amenable to pathological, genetic, and biochemical analyses. The list of specific mouse models available is continuously expanding and includes those with various checkpoint and tumor suppressor proteins knocked out or mutated, with oncogenes overexpressed or with alterations in caretaker and apoptosis-regulating genes. Moreover, increasingly, modern systems enable the control of such genetic alterations in specific tissue- and time-dependent fashion (see Chapters 6 and 7 for discussions of cancer models in the study of oncogenes and tumor suppressor genes, respectively).
One of the most insidious and nefarious properties of scientific models is their tendency to take over, and sometimes supplant, reality.
Erwin Chargaff
Mice have proved invaluable as cancer models, in particular in the following areas:
- The many well-characterized inbred strains allow the mapping and identification of cancer susceptibility genes.
- They are a rich source of transforming viruses, carrying oncogenes.
- Transgenic mice carrying candidate oncogenes provided direct evidence for the oncogenic potential of these genes.
- Knockout (KO) mice of tumor suppressor genes have given insight into the normal (i.e. developmental) function of these genes and permitted assessment of their oncogenic potential when mutated.
- Cross-breeding of different genetically altered mice allows the identification of consecutive steps in the transformation process like oncogene collaboration.
During the last decade, much effort has been directed at improving mouse models to make them resemble human cancer more closely. In particular, we are increasingly paying attention to the introduction of similar mutations in a suitable genetic background, and also to achieving appropriate spatiotemporal control of gene expression and the extent to which a particular oncogene is overexpressed or a tumor suppressor gene is inactivated in a particular cell or tissue.
These newer systems may help to overcome some of the limitations of traditional transgenic and KO mice as models of sporadic cancers in the following ways:
- Most cancer-related genes are not mutated throughout the ontogeny of the organism but instead arise as somatic mutations in the adult.
- The widespread expression of the mutated gene creates a different microenvironment than can be expected during initiation of sporadic cancers where a few mutant cells are surrounded by many normal cells. In these situations, the effect of cell–cell contact or paracrine signaling may be very different.
- Many tumor suppressor gene knockouts show severe developmental defects or early embryonic lethality, precluding study of their role in cancer.
- Many knockouts show a very distinct tumor predisposition pattern not or not necessarily corresponding to the tumor spectrum seen in humans. This is exemplified by many earlier P53 knockouts and is being addressed by a number of researchers.
- One cannot test whether the genetic alteration is required for maintenance as well as initiation of the cancer. This requires the capacity to switch genes on and off.
- One needs to be able to follow the tumorigenic process in vivo. Therefore, imaging techniques permitting monitoring of tumor growth are useful – including use of luciferase or other light-emitting reporters that can be monitored in the living animal. This improves the utility of spontaneous mouse models for conducting therapeutic intervention trials.
- It is useful to be able to track cells during tumorigenesis in vivo in order to identify the originating cell for cancer formation and to address the requirement for stem cells in this process. Lineage pulse-chase tracking tools have been developed to achieve this.
To identify multiple polymorphic regulators of cancer development, the effects of gene alterations can be examined in mouse strains of different backgrounds. In the ideal model, one should have a defined strain background (or several for comparison), and one should be able to switch genes on and off, ideally in a small subset of cells in a tissue in a time-dependent manner. Combining the Cre–Lox P techniques with hormone-inducible chimeric proteins (see Appendix 20.1) may allow this to be achieved, alongside new developments for gene knockdown with small interfering RNA (siRNA) that are already extensively used in cell culture systems and may soon be more readily employed in vivo.
All these important advancements notwithstanding, it should be remembered that a cancer model is a model and not the real human cancer. In the evolution of cancer cells, the kinetics of the genetic alterations and their manifestation, and not least the spatiotemporal manifestation of the disease, there are many differences between the species. These differences may relate to differences in the regulatory molecular networks. When working with animal models of human cancer, it is therefore important to establish systems-level marker sets for the cellular and molecular denominators of the human pathology and to monitor these markers in the model system and compare them with the information from the human disease.
Array-Based Technologies: Genomics, Epigenomics, and Transcriptomics
Do not read, think!
Arthur Schopenhauer
The first array experiment was performed in 1995 and measured mRNA expression levels in the small flowering plant Arabidopsis thaliana. The array used contained 48 probes to measure differences in mRNA levels between wild-type plants and a transgenic line overexpressing the transcription factor HAT4. Current technologies allow measurement of mRNA levels covering complete genomes in a fraction of the time the first experiment took. The most established array types are DNA microarray chips for measuring mRNA expression levels and SNP microarray chips (SNP chips) to identify polymorphic variation in the population (see Box 20.1). However, other array types and applications have been developed like comparative genomic hybridization arrays (CGH arrays), CpG island microarrays (CGI arrays), and the ChIP-on-Chip approach (see Box 20.2). The latter array systems are mostly custom built, and their use is not as widespread as microarrays for mRNA expression analysis. Over the past few years, genome-wide sequencing technologies, called next-generation sequencing (NGS), have been developed that utilize array platforms for highly parallel sequence analysis. NGS is now in extensive use in cancer molecular biology to analyze mutation patterns, DNA methylation, and the specific patterns and levels of transcripts in tumor cells, including splice variants.
SNPs, the HapMap, and the Identification of Cancer Genes
Quality is never an accident. It is always the result of intelligent effort.
John Ruskin
Linking a monogenic (single-gene) variation to a phenotype (i.e. disease) is relatively straightforward, and numerous examples have been described in Chapters 3 and 7. However, diseases are seldom the result of either single-gene defects or a single polymorphism. In fact, most common diseases are multigenic (i.e. having genetically complex traits), and the process of identifying these complex traits is difficult and involves several steps: (a) linkage or association analysis, (b) fine mapping of the genetic changes, (c) comparative sequence analysis, and (d) functional tests of the candidate genes. Identifying genes in the genome that underlie disease starts with either linkage or association analyses. Linkage or association studies identify regions, not a gene, on a chromosome – not necessarily on a single chromosome – that are linked or associated to disease or disease susceptibility.
Linkage studies are generally successful in familial monogenic disorders which are often high-risk but rare mutations or gene variants. The selection of families with a rare disease from the population serves as a filter and selects for the specific mutated allele. Genomic variation of the diseased family members is compared to members of the family without the specific disease. However, linkage studies are not very powerful for identifying alleles relating to common diseases such as cardiovascular disease, diabetes, and most cancers. Association studies are more useful in finding candidate disease genes in common diseases.
Genomic regions identified by linkage or association analyses, called “quantitative trait loci,” are still large and can correspond to 200 to 300 genes in the DNA sequence. Fine mapping is required to reduce this large number of candidate genes that might be associated with the disease and to zoom into the region of interest. This reduction is needed to make functional studies feasible. Studying 300 genes extensively in relation to a disease with current technology would simply take too much time and resources. This fine mapping results in identification of what is called “minimal quantitative trait loci” covering several genes and numerous polymorphic variants. DNA sequence analysis is needed to identify these candidate variations. Each nucleotide variant and combinations of nucleotide variants in a single gene and between genes have to be identified, ranked, and ultimately tested in a population to confirm the association. All these steps can be undertaken by microarray analysis, and specific microarrays are commercially available. Because of the variations and the large number of polymorphisms in any genome, custom arrays are popular. The stepwise approach works as a filter reducing a full genome to a small number of genes and nucleotide variants. Identification of candidate genes and nucleotide variants is in itself not conclusive evidence, and functional tests are needed. This is perhaps the most difficult step because methods to demonstrate the link between phenotype and nucleotide variant are limited. The best conclusive experiment is experimentally changing phenotypes by genetic intervention. Phenotype “swaps” are successful only if the correct nucleotide variant or correct combination of variants has been identified and is changed, and if the pathological phenotype is caused only by the one altered candidate gene.
Association studies are an emerging field, and much effort has been directed at improving techniques and resources for researchers active in this area. The International HapMap consortium was set up to determine common patterns of DNA sequence variation in the human genome, the HapMap, to facilitate the identification of disease genes and mutations. Discovering genetic variation will contribute to advances in understanding pathogenesis, diagnosis, treatment, drug response, and metabolism. Identifying all possible SNPs in the genome at once by the before-mentioned approaches would be an impossible task and, given the ongoing evolution of the genome, never achievable. Taking advantage of our understanding of genetics, a genomic map with genetic markers can be constructed to facilitate the discovery of genetic factors underlying disease. These genetic markers are SNPs (tagSNPs), and a small number of tagSNPs identifies a haplotype.
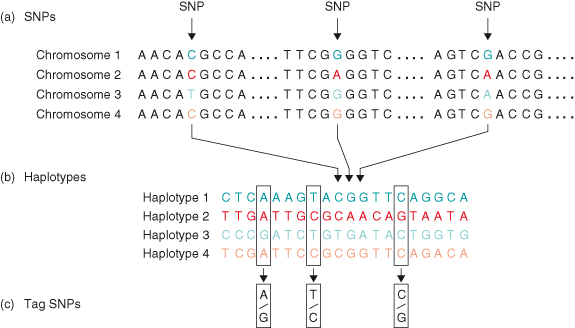
Haplotypes are stretches of DNA sequence that are inherited as an uninterrupted block of sequence. These stretches of sequence contain many SNPs, and a combination of a small number of these SNPs (tagSNPs) can unequivocally identify a haplotype (Fig. 20.2). An understanding of meiosis is crucial to appreciate how haplotypes and therefore the HapMap can be used for discovery of genetic factors underlying disease. Meiosis is the generation of cells with a haploid (i.e. a single set of chromosomes and basis for the recombination of the paternal and maternal chromosomes during sex cell formation). This recombination event results in a new hybrid genome combining alleles of parental genomes, but the merging of the chromosomes does not happen from gene to gene. The recombination occurs in genomic blocks (i.e. large stretches of DNA coding for many genes), and SNPs in that block travel together. Therefore, a combination of a number of marker SNPs may suffice to identify a genomic block, a haplotype. Due to the relatively short existence of human species, the number of haplotypes per chromosomal region is limited. New haplotypes can be formed by recombination events and new mutations. Different haplotypes can be identified by determining which tagSNPs are present in the particular genomic region. By haplotype mapping people’s genomes on the basis of tagSNPs, we can detect if certain haplotypes occur more frequently in a diseased population compared to a normal population. If one haplotype is predominantly present in the diseased population, the disease-associated polymorphism or mutation is on that specific haplotype. By identifying the haplotype and thereby the region of the genome that is associated with the disease of interest, more focused analyses of the genetic factors relating to a particular disease are possible.
Figure 20.2 SNPs, haplotypes, and tag SNPs. (a) SNPs. Shown is a short stretch of DNA from four versions of the same chromosome region in different people. Most of the DNA sequence is identical in these chromosomes, but three bases are shown where variation occurs. Each SNP has two possible alleles; the first SNP in panel A has the alleles C and T. (b) Haplotypes. A haplotype is made up of a particular combination of alleles at nearby SNPs. Shown here are the observed genotypes of 20 SNPs that extend across 6000 bases of DNA. Only the variable bases are shown, including the three SNPs that are shown in panel (a). For this region, most of the chromosomes in a population survey turn out to have haplotypes 1–4. (c) Tag SNPs. Genotyping just the three tag SNPs out of the 20 SNPs is sufficient to identify these four haplotypes uniquely. For instance, if a particular chromosome has the pattern A–T–C at these three tag SNPs, this pattern matches the pattern determined for haplotype 1. Note that many chromosomes carry the common haplotypes in the population.
From HapMap Consortium (2003). The International HapMap Project. Nature, 426: 789–96. Reproduced by permission of Nature.
As discussed in the introduction to this chapter, not all breast cancer cases can be explained by SNPs or mutations in the known hereditary breast cancer genes BRCA1, BRCA2, TP53, CHK2, and ATM. Yet, chance alone cannot account for the many cases of breast cancer that occur in some families. Although this suggests that genetic correlates should exist, the search for genes that account for the many cases of hereditary breast cancer not explained by known mutations has been largely unsuccessful. The HapMap will make association studies easier and will help to identify new genes that underlie common cancers such as breast cancer. Microarray chips will be used that contain all the tagSNPs selected by the HapMap project to identify the haplotypes. Subsequent microarray experiments will be undertaken to identify the SNPs or mutations in the haplotype region relating to the diseases followed by fine mapping, sequence analysis, and functional testing of candidate genes.
In the future, a patient’s genome may be screened for all disease-associated SNPs by SNP arrays which will allow for personalized medicine. The very recently developed whole-genome NGS may soon complement or even replace SNP arrays for analysis of genetic variants and provide the means for even higher resolution diagnosis. Many diseases, in particular cancer, are thought to be combinations of genetic predisposition and environmental factors, including lifestyle. If patients are aware of disease susceptibility, they can act upon it by, for example, taking medication or changing their lifestyle. This already happens for breast cancer: women with a familial history of breast cancer are screened for BRCA1 and BRCA2 mutations. In case of increased risk as by disease-related gene variants, preventative mastectomy is often carried out and markedly reduces incidence of breast cancer.
Cancer MRNA Expression Analysis
Before the development of microarray technology, cellular mRNA levels were studied comparing expression levels between, for example, normal and diseased cells after amplifying the complementary DNA (cDNA) of mRNA by polymerase chain reaction (PCR). Identifying in this way gene transcription levels for many genes that might play a role in a cellular pathway or disease is very time consuming, especially if no prior knowledge is available of which gene should be chosen. The use of microarrays to study expression levels has revolutionized biology, but has come with many challenges. The advantage of microarrays is that all genes in a genome and, with some technologies, splice variants can be screened for expression. This gives a relatively complete overview of the cellular transcriptome. Most genes in the genome are known, but a number are bioinformatically predicted yet not confirmed genes. Less is known about splice variants that are often only predicted from DNA sequence. Coverage of the splice variants will be possible through more refined DNA arrays and NGS.
Expression analysis studies have confirmed many findings of and prediction from cancer research. Moreover, these studies have resulted in many new insights into cancer biology, and mRNA expression analysis is proving to be very useful for cancer classification, cancer diagnosis, and, in future, disease outcome prediction.
Challenges in mRNA expression analysis and other microarray-based techniques are extensive. The large data sets require new statistical methods to analyze the data (see Box 20.3), to extract useful information, to remove random variation or biases, and to confirm the findings. Highly important in arrays analyses is the proper selection and preparation of the cellular material to be analyzed. Tumors by and large are complex tissues comprising a number of different cell types where the tumor cells themselves can be present in low frequencies, sometimes below 1%. Often, the bulk of the tumors are tumor stroma cells, connective tissue cells, and immune cells. Bulk tumor mRNA preparations, therefore, may be very misleading, and approaches to specifically isolate the tumor cells are often stressful for the cells with the effect that the transcriptomes might be altered. Transcriptome analysis on single cells picked from tissue sections might be a way around this problem but is technically challenging. Cells in tissue sections are often cut open, and the fraction of cellular mRNA actually subjected to analysis is difficult to control, plus the cDNAs need to be amplified linearly to ensure sufficient detection levels without changing the ratio of the different cDNAs, which is difficult to achieve. To circumvent these difficulties, larger numbers of cells are commonly used for analysis. As cellular systems are highly complex, heterogeneous, and dynamic, transcriptome data acquired that way average many cells and cell states, and miss important information, especially information on the spatial and spatiotemporal organization of cells and tissues. On top of all this, the major challenge perhaps is to make biological sense of the large bodies of transcriptome data acquired. This can be partly addressed by undertaking time course experiments, but this is possible only with cultured cells, and the full dynamics of cells may never be captured. Research, therefore, increasingly incorporates in silico experimentation using the experimentally obtained data sets and prior knowledge of the biological system for mathematical modeling. Such models attempt to describe the biological system and derive biologically relevant predictions that can be tested using conventional laboratory techniques.
Comparing mRNA expression patterns of tumor cells from cancer tissue with appropriate control cells identifies gene expression changes associated with cancer. Changes in cellular growth pathways can be detected where growth signals increase and growth inhibitory signals decrease. As examples, changes in gene expression relating to evasion of programmed cell death (apoptosis) or to induction of angiogenesis and tissue invasion pathways, genes involved in the extracellular matrix remodeling and increased activity of proliferation genes can be detected. These changes can be identified by increased or decreased levels of single-gene transcripts, but often several genes are affected that contribute to the same biological process or pathway. Besides cellular pathways, cell types can be distinguished in microarray data when tissue biopsies are analyzed. Human tissues are heterogeneous, and cell types present can be identified by clustering cell types’ specifically expressed genes.
Many microarray experiments have been undertaken to identify differences in mRNA expression between normal and cancerous tissue. In most cases, molecular signatures based on mRNA expression patterns can be deduced that are specific for cancer. Analyzing these datasets together in meta-analyses allows for identifying common transcriptional changes in cancers that relate to neoplastic transformation. Moreover, common differences between differentiated and undifferentiated cancers have been identified for some cancer types. Such differences in mRNA expression may translate into the clinical outcome. Undifferentiated cancers are more aggressive than differentiated cancers, and chances of survival are significantly lower for undifferentiated cancers. Microarray experiments have shed light on what the molecular origin of this phenomenon may be. Undifferentiated cancers maintain a more disordered state than differentiated cancers, and an increased level of cellular proliferation and invasion. The heterogeneous and unstable cell state results in a greater tumor aggressiveness ultimately leading to poor outcome. Three genes play a particularly important role in maintaining the undifferentiated phenotype: EZH2, H2AFX, and H2AFZ are overexpressed in undifferentiated cancers. The corresponding proteins are involved in chromatin remodeling and broad-spectrum transcriptional regulation. The protein EZH2 is involved in transcriptional memory, and H2AFX and H2AFZ are histone variant proteins known to relate to euchromatin–heterochromatin transition. These three genes modulate the expression of potentially hundreds of genes and likely play a role in maintaining the undifferentiated cancer phenotype.
Microarrays can be used for diagnostic purposes and are well suited for molecular classification of cancers. Breast cancer, for example, can have very different clinical outcomes, and although breast cancers cannot always be separated by morphology using histopathological techniques, these different cancers of the breast can be assumed to be different diseases. Using microarrays in combination with advanced statistical analysis techniques has improved cancer diagnosis in many cases. Microarray analysis not only allows for differentiation between cancer and normal tissue or cells, but also can subclassify cancers. There are ample examples that demonstrate the usefulness of microarrays in cancer diagnosis (Perou et al., 2000; Shipp et al., 2002; Sorlie et al., 2003), and for breast cancer this subclassification has also been correlated to clinical outcome. Breast tumor gene expression profiles proved useful for predicting the overall survival and the probability of remaining metastasis free. The main advance of microarray approaches is their information content translating into better prediction of outcome compared to other criteria for classifying high- and low-risk cancer, and survival (see the “Structure, code, and semantics” section for a discussion of Zipf’s law). Compared to the tumor gene expression signature, the standard National Institutes of Health (NIH) and St. Gallen diagnostic criteria misclassified a clinically significant number of patients leading to under- or overtreatment in many cases. Interestingly and importantly, microarray data suggest that the ability of a tumor to metastasize is probably an inherent genetic property of (breast) cancer and not a potential acquired in later stages of tumorigenesis.
Stay updated, free articles. Join our Telegram channel

Full access? Get Clinical Tree


