38
Regulation of Gene Expression
OBJECTIVES
After studying this chapter, you should be able to:
![]() Explain that the many steps involved in the vectorial processes of gene expression, which range from targeted modulation of gene copy number, to gene rearrangement, to transcription, to mRNA processing and transport from the nucleus, to translation, to protein post-translational modification and degradation, are all subject to regulatory control, both positive and negative. Changes in any, or multiple of these processes, can increase or decrease the amount and/or activity of the cognate gene product.
Explain that the many steps involved in the vectorial processes of gene expression, which range from targeted modulation of gene copy number, to gene rearrangement, to transcription, to mRNA processing and transport from the nucleus, to translation, to protein post-translational modification and degradation, are all subject to regulatory control, both positive and negative. Changes in any, or multiple of these processes, can increase or decrease the amount and/or activity of the cognate gene product.
![]() Appreciate that DNA binding transcription factors, proteins that bind to specific DNA sequences that are often located near to transcriptional promoter elements, can either activate or repress gene transcription.
Appreciate that DNA binding transcription factors, proteins that bind to specific DNA sequences that are often located near to transcriptional promoter elements, can either activate or repress gene transcription.
![]() Recognize that DNA binding transcription factors are often modular proteins that are composed of structurally and functionally distinct domains, which can directly or indirectly control mRNA gene transcription, either through contacts with RNA polymerase and its cofactors, or through interactions with coregulators that modulate nucleosome structure via covalent modifications and/or displacement.
Recognize that DNA binding transcription factors are often modular proteins that are composed of structurally and functionally distinct domains, which can directly or indirectly control mRNA gene transcription, either through contacts with RNA polymerase and its cofactors, or through interactions with coregulators that modulate nucleosome structure via covalent modifications and/or displacement.
![]() Understand that nucleosome-directed regulatory events typically increase or decrease the accessibility of the underlying DNA such as enhancer or promoter sequences, although nucleosome modification can also create new binding sites for other coregulators.
Understand that nucleosome-directed regulatory events typically increase or decrease the accessibility of the underlying DNA such as enhancer or promoter sequences, although nucleosome modification can also create new binding sites for other coregulators.
![]() Understand that the processes of transcription, RNA processing, and nuclear export of RNA are all coupled.
Understand that the processes of transcription, RNA processing, and nuclear export of RNA are all coupled.
BIOMEDICAL IMPORTANCE
Organisms adapt to environmental changes by altering gene expression. The mechanisms controlling gene expression have been studied in detail and often involve modulation of gene transcription. Control of transcription ultimately results from changes in the mode of interaction of specific regulatory molecules, usually proteins, with various regions of DNA in the controlled gene. Such interactions can either have a positive or negative effect on transcription. Transcription control can result in tissue-specific gene expression, and gene regulation is influenced by hormones, heavy metals, and chemicals. In addition to transcription level controls, gene expression can also be modulated by gene amplification, gene rearrangement, posttranscriptional modifications, RNA stabilization, translational control, protein modification, and protein stabilization. Many of the mechanisms that control gene expression are used to respond to developmental cues, growth factors, hormones, environmental agents, and therapeutic drugs. Dysregulation of gene expression can lead to human disease. Thus, a molecular understanding of these processes will lead to development of agents that alter pathophysiologic mechanisms or inhibit the function or arrest the growth of pathogenic organisms.
REGULATED EXPRESSION OF GENES IS REQUIRED FOR DEVELOPMENT, DIFFERENTIATION, & ADAPTATION
The genetic information present in each normal somatic cell of a metazoan organism is practically identical. The exceptions are found in those few cells that have amplified or rearranged genes in order to perform specialized cellular functions or cells that have undergone oncogenic transformation. Expression of the genetic information must be regulated during ontogeny and differentiation of the organism and its cellular components. Furthermore, in order for the organism to adapt to its environment and to conserve energy and nutrients, the expression of genetic information must be cued to extrinsic signals and respond only when necessary. As organisms have evolved, more sophisticated regulatory mechanisms have appeared which provide the organism and its cells with the responsiveness necessary for survival in a complex environment. Mammalian cells possess about 1000 times more genetic information than does the bacterium Escherichia coli. Much of this additional genetic information is probably involved in regulation of gene expression during the differentiation of tissues and biologic processes in the multicellular organism and in ensuring that the organism can respond to complex environmental challenges.
In simple terms, there are only two types of gene regulation: positive regulation and negative regulation (Table 38-1). When the expression of genetic information is quantitatively increased by the presence of a specific regulatory element, regulation is said to be positive; when the expression of genetic information is diminished by the presence of a specific regulatory element, regulation is said to be negative. The element or molecule mediating negative regulation is said to be a negative regulator, a silencer or repressor; that mediating positive regulation is a positive regulator, an enhancer or activator. However, a double negative has the effect of acting as a positive. Thus, an effector that inhibits the function of a negative regulator will appear to bring about a positive regulation. Many regulated systems that appear to be induced are in fact derepressed at the molecular level. (See Chapter 9 for explanation of these terms.)
TABLE 38–1 Effects of Positive and Negative Regulation on Gene Expression
BIOLOGIC SYSTEMS EXHIBIT THREE TYPES OF TEMPORAL RESPONSES TO A REGULATORY SIGNAL
Figure 38–1 depicts the extent or amount of gene expression in three types of temporal response to an inducing signal. A type A response is characterized by an increased extent of gene expression that is dependent upon the continued presence of the inducing signal. When the inducing signal is removed, the amount of gene expression diminishes to its basal level, but the amount repeatedly increases in response to the reappearance of the specific signal. This type of response is commonly observed in prokaryotes in response to sudden changes of the intracellular concentration of a nutrient. It is also observed in many higher organisms after exposure to inducers such as hormones, nutrients, or growth factors (Chapter 42).
FIGURE 38–1 Diagrammatic representations of the responses of the extent of expression of a gene to specific regulatory signals (such as a hormone as a function of time).
A type B response exhibits an increased amount of gene expression that is transient even in the continued presence of the regulatory signal. After the regulatory signal has terminated and the cell has been allowed to recover, a second transient response to a subsequent regulatory signal may be observed. This phenomenon of response-desensitization recovery characterizes the action of many pharmacologic agents, but it is also a feature of many naturally occurring processes. This type of response commonly occurs during development of an organism, when only the transient appearance of a specific gene product is required although the signal persists.
The type C response pattern exhibits, in response to the regulatory signal, an increased extent of gene expression that persists indefinitely even after termination of the signal. The signal acts as a trigger in this pattern. Once expression of the gene is initiated in the cell, it cannot be terminated even in the daughter cells; it is therefore an irreversible and inherited alteration. This type of response typically occurs during the development of differentiated function in a tissue or organ.
Simple Unicellular and Multicellular Organisms Serve as Valuable Models for the Study of Gene Expression in Mammalian Cells
Analysis of the regulation of gene expression in prokaryotic cells helped establish the principle that information flows from the gene to a messenger RNA to a specific protein molecule. These studies were aided by the advanced genetic analyses that could be performed in prokaryotic and lower eukaryotic organisms such as baker’s yeast, Saccharomyces cerevisiae, and the fruit fly, Drosophila melanogaster, among others. In recent years, the principles established in these studies, coupled with a variety of molecular biology techniques, have led to remarkable progress in the analysis of gene regulation in higher eukaryotic organisms, including mammals. In this chapter, the initial discussion will center on prokaryotic systems. The impressive genetic studies will not be described, but the physiology of gene expression will be discussed. However, nearly all of the conclusions about this physiology have been derived from genetic studies and confirmed by molecular genetic and biochemical experiments.
Some Features of Prokaryotic Gene Expression Are Unique
Before the physiology of gene expression can be explained, a few specialized genetic and regulatory terms must be defined for prokaryotic systems. In prokaryotes, the genes involved in a metabolic pathway are often present in a linear array called an operon, for example, the lac operon. An operon can be regulated by a single promoter or regulatory region. The cistron is the smallest unit of genetic expression. As described in Chapter 9, some enzymes and other protein molecules are composed of two or more nonidentical subunits. Thus, the “one gene, one enzyme” concept is not necessarily valid. The cistron is the genetic unit coding for the structure of the subunit of a protein molecule, acting as it does as the smallest unit of genetic expression. Thus, the one gene, one enzyme idea might more accurately be regarded as a one cistron, one subunit concept. A single mRNA that encodes more than one separately translated protein is referred to as a polycistronic mRNA. For example, the polycistronic lac operon mRNA is translated into three separate proteins (see below). Operons and polycistronic mRNAs are common in bacteria but not in eukaryotes.
An inducible gene is one whose expression increases in response to an inducer or activator, a specific positive regulatory signal. In general, inducible genes have relatively low basal rates of transcription. By contrast, genes with high basal rates of transcription are often subject to downregulation by repressors.
The expression of some genes is constitutive, meaning that they are expressed at a reasonably constant rate and not known to be subject to regulation. These are often referred to as housekeeping genes. As a result of mutation, some inducible gene products become constitutively expressed. A mutation resulting in constitutive expression of what was formerly a regulated gene is called a constitutive mutation.
Analysis of Lactose Metabolism in E coli Led to the Operon Hypothesis
Jacob and Monod in 1961 described their operon model in a classic paper. Their hypothesis was to a large extent based on observations on the regulation of lactose metabolism by the intestinal bacterium E coli. The molecular mechanisms responsible for the regulation of the genes involved in the metabolism of lactose are now among the best-understood in any organism. β-Galactosidase hydrolyzes the β-galactoside lactose to galactose and glucose. The structural gene for β-galactosidase (lacZ) is clustered with the genes responsible for the permeation of lactose into the cell (lacY) and for thiogalactoside transacetylase (lacA). The structural genes for these three enzymes, along with the lac promoter and lac operator (a regulatory region), are physically associated to constitute the lac operon as depicted in Figure 38–2. This genetic arrangement of the structural genes and their regulatory genes allows for coordinate expression of the three enzymes concerned with lactose metabolism. Each of these linked genes is transcribed into one large polycistronic mRNA molecule that contains multiple independent translation start (AUG) and stop (UAA) codons for each of the three cistrons. Thus, each protein is translated separately, and they are not processed from a single large precursor protein.
FIGURE 38–2 The positional relationships of the structural and regulatory genes of the lac operon. lacZ encodes β-galactosidase, lacY encodes a permease, and lacA encodes a thiogalactoside transacetylase. lacI encodes the lac operon repressor protein.
It is now conventional to consider that a gene includes regulatory sequences as well as the region that encodes the primary transcript. Although there are many historical exceptions, a gene is generally italicized in lower case and the encoded protein, when abbreviated, is expressed in roman type with the first letter capitalized. For example, the gene lacI encodes the repressor protein LacI. When E coli is presented with lactose or some specific lactose analogs under appropriate nonrepressing conditions (eg, high concentrations of lactose, no or very low glucose in media; see below), the expression of the activities of β-galactosidase, galactoside permease, and thiogalactoside transacetylase is increased 100-fold to 1000-fold. This is a type A response, as depicted in Figure 38–1. The kinetics of induction can be quite rapid; lac-specific mRNAs are fully induced within 5-6 min after addition of lactose to a culture; β-galactosidase protein is maximal within 10 min. Under fully induced conditions, there can be up to 5000 β-galactosidase molecules per cell, an amount about 1000 times greater than the basal, uninduced level. Upon removal of the signal, that is, the inducer, the synthesis of these three enzymes declines.
When E coli is exposed to both lactose and glucose as sources of carbon, the organisms first metabolize the glucose and then temporarily stop growing until the genes of the lac operon become induced to provide the ability to metabolize lactose as a usable energy source. Although lactose is present from the beginning of the bacterial growth phase, the cell does not induce those enzymes necessary for catabolism of lactose until the glucose has been exhausted. This phenomenon was first thought to be attributable to repression of the lac operon by some catabolite of glucose; hence, it was termed catabolite repression. It is now known that catabolite repression is in fact mediated by a catabolite gene activator protein (CAP) in conjunction with cAMP (Figure 17–5). This protein is also referred to as the cAMP regulatory protein (CRP). The expression of many inducible enzyme systems or operons in E coli and other prokaryotes is sensitive to catabolite repression, as discussed below.
The physiology of induction of the lac operon is well understood at the molecular level (Figure 38–3). Expression of the normal lacI gene of the lac operon is constitutive; it is expressed at a constant rate, resulting in formation of the subunits of the lac repressor. Four identical subunits with molecular weights of 38,000 assemble into a tetrameric Lac repressor molecule. The LacI repressor protein molecule, the product of lacI, has a high affinity (dissociation constant, Kd about 10-13 mol/L) for the operator locus. The operator locus is a region of double-stranded DNA that exhibits a twofold rotational symmetry and an inverted palindrome (indicated by arrows about the dotted axis) in a region that is 21 bp long, as shown below:
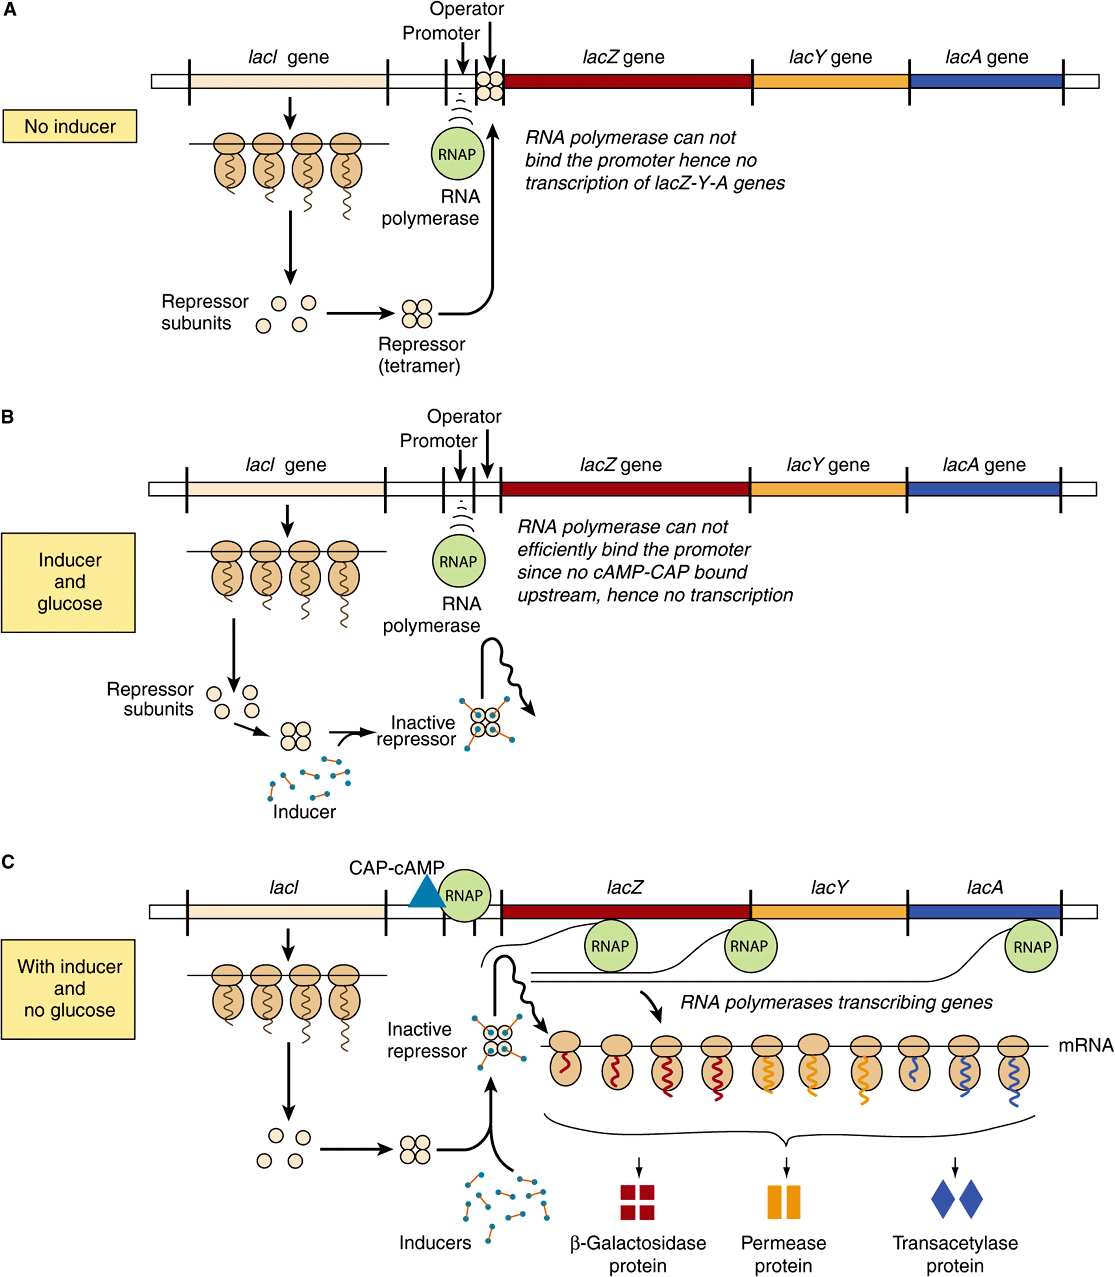
FIGURE 38–3 The mechanism of repression and derepression of the lac operon. When no inducer is present (A) the constitutively synthesized lacI gene products forms a repressor tetramer molecule that binds at the operator locus. Repressor-operator binding prevents the binding of RNA polymerase and consequently prevents transcription of the lacZ, lacY, and lacA structural genes into a polycistonic mRNA. When inducer is present, but glucose is also present in the culture medium (B), the tetrameric repressor molecules are conformationally altered by inducer, and cannot efficiently bind to the operator locus (affinity of binding reduced >1000-fold). However, RNA polymerase will not efficiently bind the promoter and initiate transcription, therefore the operon is not transcribed. However, when inducer is present and glucose is depleted from the medium (C) adenyl cylase is activated and cAMP is produced. This cAMP binds with high affinity to its binding protein the Cyclic AMP Activator Protein, or CRP. The camp-CAP complex binds to its recognition sequence (CRE, the cAMP Response Element) located ~15 bp upstream of the promoter. Direct protein-protein contacts between the CRE-bound CAP and the RNA polymerase increases promoter binding >20-fold; hence RNAP will efficiently transcribe the structural genes lacZ, lacY, and lacA, and the polycistronic mRNA molecule formed can be translated into the corresponding protein molecules β-galactosidase, permease, and transacetylase as shown, whick allows for the catabolism of lactose as the sole carbon source for growth.
At any one time, only two of the four subunits of the repressor appear to bind to the operator, and within the 21-base-pair region nearly every base of each base pair is involved in LacI recognition and binding. The binding occurs mostly in the major groove without interrupting the base-paired, doublehelical nature of the operator DNA. The operator locus is between the promoter site, at which the DNA-dependent RNA polymerase attaches to commence transcription, and the transcription initiation site of the lacZ gene. the structural gene for β-galactosidase (Figure 38–2). When attached to the operator locus, the LacI repressor molecule prevents transcription of the distal structural genes, lacZ, lacY, and lacA by interfering with the binding of RNA polymerase to the promoter; RNA polymerase and LacI repressor cannot be effectively bound to the lac operon at the same time. Thus, the LacI repressor molecule is a negative regulator; in its presence (and in the absence of inducer; see below), expression from the lacZ, lacY, and lacA genes is very, very low. There are normally 20-40 repressor tetramer molecules in the cell, a concentration of tetramer sufficient to effect, at any given time, >95% occupancy of the one lac operator element in a bacterium, thus ensuring low (but not zero) basal lac operon gene transcription in the absence of inducing signals.
A lactose analog that is capable of inducing the lac operon while not itself serving as a substrate for β-galactosidase is an example of a gratuitous inducer. An example is isopropylthiogalactoside (IPTG). The addition of lactose or of a gratuitous inducer such as IPTG to bacteria growing on a poorly utilized carbon source (such as succinate) results in prompt induction of the lac operon enzymes. Small amounts of the gratuitous inducer or of lactose are able to enter the cell even in the absence of permease. The LacI repressor molecules—both those attached to the operator loci and those free in the cytosol—have a high affinity for the inducer. Binding of the inducer to repressor molecule induces a conformational change in the structure of the repressor and causes it to dissociate from operator DNA because its affinity for the operator is now 104 times lower (Kd about 10-9 mol/L) than that of LacI in the absence of IPTG. DNA-dependent RNA polymerase can now bind to the promoter (ie, Figures 36-3 and 36-8), and transcription will begin, although this process is relatively inefficient (see below). In such a manner, an inducer derepresses the lac operon and allows transcription of the structural genes for β-galactosidase, galactoside permease, and thiogalactoside transacetylase. Translation of the polycistronic mRNA can occur even before transcription is completed. Derepression of the lac operon allows the cell to synthesize the enzymes necessary to catabolize lactose as an energy source. Based on the physiology just described, IPTG-induced expression of transfected plasmids bearing the lac operator-promoter ligated to appropriate bioengineered constructs is commonly used to express mammalian recombinant proteins in E coli.
In order for the RNA polymerase to form a PIC at the promoter site most efficiently, there must also be present the CAP to which cAMP is bound. By an independent mechanism, the bacterium accumulates cAMP only when it is starved for a source of carbon. In the presence of glucose—or of glycerol in concentrations sufficient for growth—the bacteria will lack sufficient cAMP to bind to CAP because the glucose inhibits adenylyl cyclase, the enzyme that converts ATP to cAMP (see Chapter 41). Thus, in the presence of glucose or glycerol, cAMP-saturated CAP is lacking, so that the DNA-dependent RNA polymerase cannot initiate transcription of the lac operon at the maximal rate. However, in the presence of the CAP-cAMP complex, which binds to DNA just upstream of the promoter site, transcription occurs at maximal levels (Figure 38–3). Studies indicate that a region of CAP directly contacts the RNA polymerase α-subunit, and these protein-protein interactions facilitate the binding of RNAP to the promoter. Thus, the CAP-cAMP regulator is acting as a positive regulator because its presence is required for optimal gene expression. The lac operon is therefore controlled by two distinct, ligand-modulated DNA binding trans-factors; one that acts positively (cAMP-CRP complex) to facilitate productive binding of RNA polymerase to the promoter and one that acts negatively (LacI repressor) that antagonizes RNA polymerase promoter binding. Maximal activity of the lac operon occurs when glucose levels are low (high cAMP with CAP activation) and lactose is present (LacI is prevented from binding to the operator).
When the lacI gene has been mutated so that its product, LacI, is not capable of binding to operator DNA, the organism will exhibit constitutive expression of the lac operon. In a contrary manner, an organism with a lacI gene mutation that produces a LacI protein which prevents the binding of an inducer to the repressor will remain repressed even in the presence of the inducer molecule, because the inducer cannot bind to the repressor on the operator locus in order to derepress the operon. Similarly, bacteria harboring mutations in their lac operator locus such that the operator sequence will not bind a normal repressor molecule constitutively express the lac operon genes. Mechanisms of positive and negative regulation comparable to those described here for the lac system have been observed in eukaryotic cells (see below).
The Genetic Switch of Bacteriophage Lambda (λ) Provides Another Paradigm for Protein-DNA Interactions and Transcriptional Regulation in Eukaryotic Cells
Like some eukaryotic viruses (eg, herpes simplex virus and HIV), some bacterial viruses can either reside in a dormant state within the host chromosomes or can replicate within the bacterium and eventually lead to lysis and killing of the bacterial host. Some E. coli harbor such a “temperate” virus, bacteriophage lambda (λ). When lambda infects an organism of that species, it injects its 45,000-bp, double-stranded, linear DNA genome into the cell (Figure 38–4). Depending upon the nutritional state of the cell, the lambda DNA will either integrate into the host genome (lysogenic pathway) and remain dormant until activated (see below), or it will commence replicating until it has made about 100 copies of complete, protein-packaged virus, at which point it causes lysis of its host (lytic pathway). The newly generated virus particles can then infect other susceptible hosts. Poor growth conditions favor lysogeny while good growth conditions promote the lytic pathway of lambda growth.
FIGURE 38–4 Infection of the bacterium E. coli by phage lambda begins when a virus particle attaches itself to specific receptors on the bacterial cell (1) and injects its DNA (dark green line) into the cell (2, 3). Infection can take either of two courses depending on which of two sets of viral genes is turned on. In the lysogenic pathway, the viral DNA becomes integrated into the bacterial chromosome (red) (4,5), where it replicates passively as the bacterial DNA and cell divides. This dormant genomically integrated virus is called a prophage, and the cell that harbors it is called a lysogen. In the alternative lytic mode of infection, the viral DNA replicates itself (6) and directs the synthesis of viral proteins (7). About 100 new virus particles are formed. The proliferating viruses induce lysis of the cell (8). A prophage can be “induced” by a DNA damaging agent such as ultraviolet radiation (9). The inducing agent throws a switch, so that a different set of genes is turned on. Viral DNA loops out of the chromosome (10) and replicates; the virus proceeds along the lytic pathway. (Reproduced, with permission, from Ptashne M, Johnson AD, Pabo CO: A genetic switch in a bacterial virus. Sci Am [Nov] 1982;247:128.)
When integrated into the host genome in its dormant state, lambda will remain in that state until activated by exposure of its bacterial host to DNA-damaging agents. In response to such a noxious stimulus, the dormant bacteriophage becomes “induced” and begins to transcribe and subsequently translate those genes of its own genome that are necessary for its excision from the host chromosome, its DNA replication, and the synthesis of its protein coat and lysis enzymes. This event acts like a trigger or type C (Figure 38–1) response; that is, once dormant lambda has committed itself to induction, there is no turning back until the cell is lysed and the replicated bacteriophage released. This switch from a dormant or prophage state to a lytic infection is well understood at the genetic and molecular levels and will be described in detail here; though less well understood at the molecular level, HIV and herpes viruses can behave similarly.
The lytic/lysogenic genetic switching event in lambda is centered around an 80-bp region in its double-stranded DNA genome referred to as the “right operator” (OR) (Figure 38–5A). The right operator is flanked on its left side by the structural gene for the lambda repressor protein, cI, and on its right side by the structural gene encoding another regulatory protein called cro. When lambda is in its prophage state—that is, integrated into the host genome—the cI repressor gene is the only lambda gene that is expressed. When the bacteriophage is undergoing lytic growth, the cI repressor gene is not expressed, but the cro gene—as well as many other lambda genes—is expressed. That is, when the repressor gene is on, the cro gene is off, and when the cro gene is on, the cI repressor gene is off. As we shall see, these two genes regulate each other’s expression and thus, ultimately, the decision between lytic and lysogenic growth of lambda. This decision between repressor gene transcription and cro gene transcription is a paradigmatic example of a molecular transcriptional switch.
FIGURE 38–5 Right operator (OR) is shown in increasing detail in this series of drawings. The operator is a region of the viral DNA some 80 bp long (A). To its left lies the gene encoding lambda repressor (cI), to its right the gene (cro) encoding the regulator protein Cro. When the operator region is enlarged (B), it is seen to include three subregions, OR1, OR2, and OR3, each 17 bp long. They are recognition sites to which both repressor and Cro can bind. The recognition sites overlap two promoters—sequences of bases to which RNA polymerase binds in order to transcribe these genes into mRNA (wavy lines), that are translated into protein. Site OR1 is enlarged (C) to show its base sequence. Note that in the OR region of the lambda chromosome, both strands of DNA act as a template for transcription. (Reproduced, with permission, from Ptashne M, Johnson AD, Pabo CO: A genetic switch in a bacterial virus. Sci Am [Nov] 1982;247:128.)
The 80-bp lambda right operator, OR, can be subdivided into three discrete, evenly spaced, 17-bp cis-active DNA elements that represent the binding sites for either of two bacteriophage lambda regulatory proteins. Importantly, the nucleotide sequences of these three tandemly arranged sites are similar but not identical (Figure 38–5B). The three related cis-elements, termed operators OR1, OR2, and OR3, can be bound by either cI or Cro proteins. However, the relative affinities of cI and Cro for each of the sites vary, and this differential binding affinity is central to the appropriate operation of the lambda phage lytic or lysogenic “molecular switch.” The DNA region between the cro and repressor genes also contains two promoter sequences that direct the binding of RNA polymerase in a specified orientation, where it commences transcribing adjacent genes. One promoter directs RNA polymerase to transcribe in the rightward direction and, thus, to transcribe cro and other distal genes, while the other promoter directs the transcription of the cI repressor gene in the leftward direction (Figure 38–5B).
The product of the repressor gene, the 236-amino-acid, 27 kDa cI repressor protein, exists as a two-domain molecule in which the amino terminal domain binds to operator DNA and the carboxyl terminal domain promotes the association of one repressor protein with another to form a dimer. A dimer of repressor molecules binds to operator DNA much more tightly than does the monomeric form (Figure 38–6A to 38-6C).
FIGURE 38–6 Schematic molecular structures of cI (lambda repressor, shown in A, B, and C) and Cro (D). The lambda repressor protein is a polypeptide chain 236 amino acids long. The chain folds itself into a dumbbell shape with two substructures: an amino terminal (NH2) domain and a carboxyl terminal (COOH) domain. The two domains are linked by a region of the chain that is less structured and susceptible to cleavage by proteases (indicated by the two arrows in A). Single repressor molecules (monomers) tend to reversibly associate to form dimers. (B) A dimer is held together mainly by contact between the carboxyl terminal domains (hatching). Repressor dimers bind to (and can dissociate from) the recognition sites in the operator region; they display differential affinites for the three operator sites, ![]() (C). It is the DBD of the repressor molecule that makes contact with the DNA (hatching). Cro (D) has a single domain with sites that promote dimerization and other sites that promote binding of dimers to operator, cro exhibits the highest affinity for OR3, opposite the sequence binding preference of the cI protein. (Reproduced, with permission, from Ptashne M, Johnson AD, Pabo CO: A genetic switch in a bacterial virus. Sci Am [Nov] 1982;247:128.)
(C). It is the DBD of the repressor molecule that makes contact with the DNA (hatching). Cro (D) has a single domain with sites that promote dimerization and other sites that promote binding of dimers to operator, cro exhibits the highest affinity for OR3, opposite the sequence binding preference of the cI protein. (Reproduced, with permission, from Ptashne M, Johnson AD, Pabo CO: A genetic switch in a bacterial virus. Sci Am [Nov] 1982;247:128.)
The product of the cro gene, the 66-amino-acid, 9-kDa Cro protein, has a single domain but also binds the operator DNA more tightly as a dimer (Figure 38–6D). The Cro protein’s single domain mediates both operator binding and dimerization.
In a lysogenic bacterium—that is, a bacterium containing an integrated dormant lambda prophage—the lambda repressor dimer binds preferentially to OR1 but in so doing, by a cooperative interaction, enhances the binding (by a factor of 10) of another repressor dimer to OR2 (Figure 38–7). The affinity of repressor for OR3 is the least of the three operator subregions. The binding of repressor to OR1 has two major effects. The occupation of OR1 by repressor blocks the binding of RNA polymerase to the rightward promoter and in that way prevents expression of cro. Second, as mentioned above, repressor dimer bound to OR1 enhances the binding of repressor dimer to OR2. The binding of repressor to OR2 has the important added effect of enhancing the binding of RNA polymerase to the leftward promoter that overlaps OR3 and thereby enhances transcription and subsequent expression of the repressor gene. This enhancement of transcription is mediated through direct protein-protein interactions between promoter-bound RNA polymerase and OR2-bound repressor, much as described above for CAP protein and RNA polymerase on the lac operon. Thus, the lambda repressor is both a negative regulator, by preventing transcription of cro, and a positive regulator, by enhancing transcription of its own gene, cI. This dual effect of repressor is responsible for the stable state of the dormant lambda bacteriophage; not only does the repressor prevent expression of the genes necessary for lysis, but it also promotes expression of itself to stabilize this state of differentiation. In the event that intracellular repressor protein concentration becomes very high, this excess repressor will bind to OR3 and by so doing diminish transcription of the repressor gene from the leftward promoter, by blocking RNAP binding to the cI promoter, until the repressor concentration drops and repressor dissociates itself from OR3. Interestingly, similar examples of repressor proteins also having the ability to activate transcription have been observed in eukaryotes.
FIGURE 38–7 Configuration of the lytic/lysogenic switch is shown at four stages of the lambda life cycle
Stay updated, free articles. Join our Telegram channel

Full access? Get Clinical Tree


