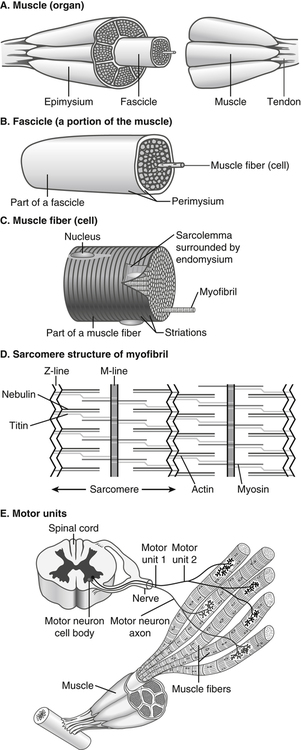
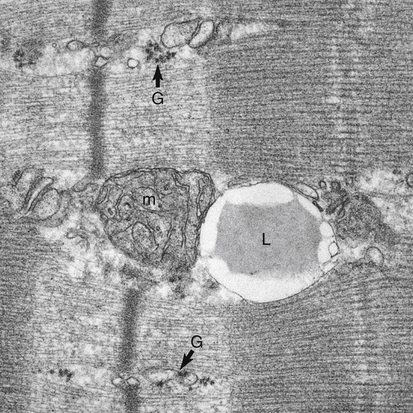
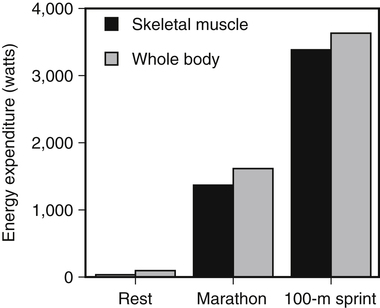
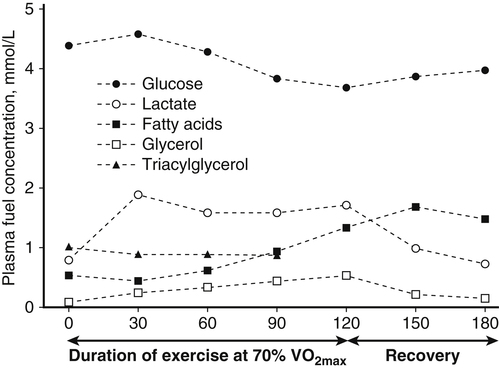
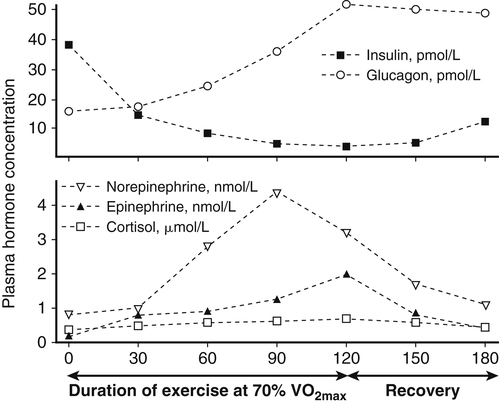
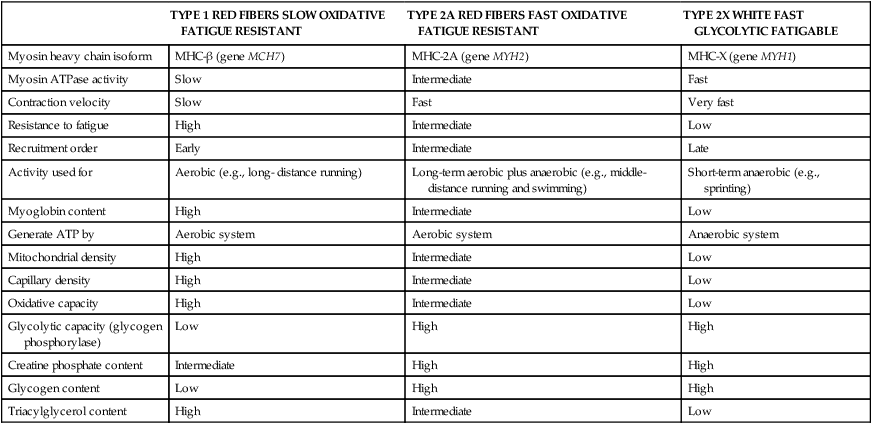
Muscle cells are called muscle fibers. Each skeletal muscle fiber is produced by the fusion of many immature myoblasts to form a multinucleated cylinder-shaped cell. The muscle fiber is contained within the cell’s plasma membrane covered by an outer connective tissue sheath; the muscle fiber’s plasma membrane is called the sarcolemma, and the outer layer of connective tissue is called the endomysium (Figure 20-1, C). The endomysium contains capillaries, nerves, and lymphatics. The sarcoplasm of each muscle fiber contains an array of cylindrical contractile filaments called myofibrils that are stacked lengthwise and run the entire length of the fiber, being connected to the cell surface membrane at each end. The nuclei are pressed against the outer edges of the fiber, adjacent to the sarcolemma. The mitochondria are located between the myofibrils, as are the intramyocellular lipid droplets and glycogen granules (Figure 20-2). At each end of the muscle fiber, the surface layer of the sarcolemma fuses with a tendon fiber, and the tendon fibers in turn collect into bundles to form the muscle tendons that then attach to bones. Each myofibril is about 1 μm in diameter, extends along the complete length of the muscle fiber, and is composed of contractile units called sarcomeres that are attached end to end (Figure 20-1, D). Each sarcomere contains thick filaments (diameter of ~15 nm) that contain myosin and thin filaments (diameter of ~5 nm) that contain actin, with the thick and thin filaments overlapping in a structured way. In addition to actin and myosin, skeletal muscle sarcomeres also contain other proteins, such as troponin and tropomyosin, which are necessary for muscle contraction, and nebulin and titin, which give structure and stability to the sarcomere. In skeletal muscle, the sarcomeric subunits of one myofibril are in nearly perfect alignment with those of the myofibrils next to it. This alignment forms bands of alternating high and low refractive index that gives skeletal muscle its striated appearance. Ten to more than 100 muscle fibers are bundled into fascicles, and each fascicle is covered by a sheath of connective tissue called perimysium (see Figure 20-1, B). Fascicles are, in turn, grouped together to form a muscle, which is covered by a layer of connective tissue that ensheathes the entire muscle and is continuous with the tendons (see Figure 20-1, A). The size, number, and arrangement of fascicles within the muscle determine the strength and range of movement of a muscle. Tunnel-like extensions of the sarcolemma, called tranverse tubules or simply T tubules, pass through the muscle fiber from one side of it to the other, forming rings around every sarcomere. The sarcoplasmic reticulum of the muscle fiber consists of tubules that run parallel to the sarcomeres from T tubule to T tubule. The sarcoplasmic reticulum serves as a repository for calcium ions (Ca2+). When a signal comes from the motor nerve activating the fiber, the neurotransmitter acetylcholine is released and travels across the neuromuscular junction. The action potential then travels along the T tubules until it reaches the sarcoplasmic reticulum, where it changes the permeability of the sarcoplasmic reticulum. Once a cell is sufficiently stimulated, the cell’s sarcoplasmic reticulum releases Ca2+, which then interacts with the regulatory protein troponin. Calcium binding by troponin results in a conformational change in troponin that leads to the movement of tropomyosin, uncovering the myosin-binding sites on actin. In resting muscle, myosin-binding sites on actin are obscured and myosin exists in a high-energy conformational state poised to carry out a contractile cycle. When myosin binding sites on actin are exposed, myosin and actin form a crossbridge or complex, which is followed by the dissociation of inorganic phosphate (Pi) and a conformational change in myosin that propels the attached actin filament toward the center (M-line) of the sarcomere (see Figure 20-1, D). The actomyosin complex then releases ADP, which is followed by ATP binding to the myosin of the actomyosin complex and breaking of the crossbridges. As soon as detachment occurs, myosin splits the ATP, reversing the conformational change performed while it was attached to actin and returning myosin back to its high-energy state. Repetition of these processes allows for myosin and actin crossbridge cycling, which in turn leads to the generation of tension or fiber contraction. Individual human muscles are a mixture of muscle fiber types that are differentiated by their myosin heavy chain isoform expression (Canepari et al., 2010). A particular motor unit innervates only one type of muscle fiber within the muscle (see Figure 20-1, E). In fact, the muscle fiber type and myosin heavy chain (MHC) isoform expression depends on the motor neuron axon supplying that particular fiber. Myosin is a motor protein that moves along actin filaments while hydrolyzing ATP. The skeletal muscles of human adults contain three isoforms of MHC: MHC-1, MHC-2A, and MHC-X, which are encoded by MYH7, MYH2, and MYH1, respectively. Rodents, but not adult humans, express MHC-2B. The myosin heavy chain isoforms are important determinants of the contractile characteristics of the muscle fibers, because the heavy chain is the portion of myosin that attaches to actin and hydrolyzes ATP. The myosin isoforms differ in their rate of release of ADP during the attachment to actin and therefore have different attachment times. Characteristics of muscle fibers that express type 1, type 2A, and type 2X MHC are given in Table 20-1. Hybrid fibers that contain type 1/2A or type 2A/2X MHC isoforms also exist in human muscles. TABLE 20-1 Characteristics of Major Skeletal Muscle Fiber Types It has traditionally been assumed that type 2 fibers are specialized to perform sprinting exercise, whereas type 1 fibers are more suited to perform endurance exercise. In agreement with this, the better sprinters tend to have a high percentage of type 2 fibers, whereas a marathoner may have a much higher percentage of type 1 fibers. Certainly, genetic factors play a role in determining fiber type distribution. In addition, muscle fibers display a degree of plasticity that allows them to reversibly change their biochemical and morphologic properties when exposed to different functional demands. For example, strength or resistance (low repetition, high load) training can lead to an increase in the myofibrillar volume (hypertrophy) of both type 1 and type 2 fibers. High-intensity endurance (high repetition, low load) training can increase the proportion of type 1 fibers (increase in mitochondrial and capillary density), but it does not result in an increase in fiber size. It is thought that both metabolic and mechanical signals are involved in bringing about these changes (Putman et al., 2004; Hoppeler and Flück, 2002). At rest, whole-body energy expenditure of humans is about 80 watts or 68 kcal/hour (comparable to that of a light bulb), with approximately 25% (20 watts or 17 kcal/hour) being expended in the skeletal muscles. Energy expenditure during a marathon run covering 42 km in a little over 2 hours is about 20 times resting energy expenditure (1,600 watts or 1,377 kcal/hour). Because more than 90% of the increase in energy expenditure originates from fuel oxidation in the active muscle (part is needed for the cardiovascular response), and assuming that maximally about one half of skeletal muscle mass is actively used in running a marathon, the energy expenditure of this active half of skeletal muscle can be estimated to increase by more than 130-fold (from 10 watts to 1,368 watts), as shown in Figure 20-3. Skeletal muscle must therefore have powerful mechanisms to increase the rates of ATP synthesis and fuel oxidation. In an individual running a marathon, most of the required ATP is produced by aerobic oxidation of carbohydrate and fat. Skeletal muscle oxidizes a mixture of carbohydrate and fat even at rest. Although the impact of resting skeletal muscle gas exchange on the whole-body respiratory quotient (RQ) is small, measurements of the arteriovenous difference for oxygen and carbon dioxide across skeletal muscle have demonstrated the relative importance of fat and carbohydrate as fuels for the resting muscle. Himwich and Rose (1927), using such techniques in dogs, observed that the RQ of skeletal muscle in fed dogs was about 0.92, whereas the RQ of skeletal muscle in starved dogs was 0.80 and lower. The RQ is defined as moles CO2 produced/moles O2 consumed, and it is usually measured as volume of CO2 produced/volume of O2 consumed (see Chapter 21). Because an RQ of 1.00 indicates 100% carbohydrate oxidation and a value of 0.70 indicates 100% fat oxidation, it is clear that skeletal muscle at rest always oxidizes a mixture of carbohydrate and fat, even though the proportions vary substantially. This finding has been confirmed in humans on many occasions, using the same technique. As discussed in Chapter 19, skeletal muscle of insulin-sensitive individuals is able to adapt to changes in fuel availability in response to meal intake or fasting and uses proportionately more glucose during the postprandial period and more fatty acids during the postabsorptive period. Carbohydrate is the main fuel for resting skeletal muscle in the fed situation, whereas fat oxidation accounts for two thirds or more of oxygen consumption in the postabsorptive and fasted situation. The transition from the fed to the fasted state is carefully controlled, as described in Chapters 12, 16, and 19. With the onset of exercise, there is a fall in plasma glucose level (Figure 20-4). In response to the fall in the plasma glucose level, glucagon secretion from the pancreatic alpha cells increases during exercise, whereas insulin secretion from the pancreatic beta cells decreases (Figure 20-5). The increase in glucagon is the primary stimulator of hepatic glucoenogenesis during exercise. Berglund et al. (2009) showed that increasing glucagon in sedentary mice to levels similar to those seen during exercise caused a marked discharge of hepatic energy stores so that the AMP to ATP ratio increased. This increase in the AMP to ATP ratio presumably acts at least partially through activation of AMP-activated protein kinase (AMPK), as well as through allosteric mechanisms, to stimulate breakdown of glycogen in the liver. Glucagon is released from the pancreas into the portal circulation and may be largely removed by the liver before the blood reaches the arterial circulation, so that an increase in glucagon levels in the systemic circulation may not always be detected (Wasserman et al., 2011). Catecholamines do not seem to directly play an important role in increasing hepatic glucose production during exercise, although catecholamines can increase glucagon secretion. Thus during exercise, glucagon is important in stimulating hepatic glycogenolysis to maintain plasma glucose levels. The main stimuli to fat mobilization during exercise are the catecholamines, epinephrine and norepinephrine. Circulating catecholamine levels are regulated by the sympathoadrenal system. Current evidence indicates that the adrenergic stimulation of lipolysis during exercise is due mainly to circulating catecholamines rather than to sympathetic innervation of adipose tissue (Stallknecht et al., 2001; de Glisezinski et al., 2009). As shown in Figure 20-5, plasma catecholamine concentrations increase markedly with exercise (Hiscock et al., 2005; Febbraio et al., 2004). The fall in plasma insulin levels during exercise also creates a lipolytic environment and likely reinforces the effects of catecholamines. Growth hormone and glucocorticoids may also play a role, especially in prolonged exercise. The consequence of this stimulation of adipose lipolysis during exercise is an increase in the rate of free fatty acid appearance in the plasma. The release of fatty acids into the plasma is typically two to three times that observed at rest. Because the release of free fatty acids is greater than the rate of total free fatty acid oxidation by the whole body, the plasma free fatty acid level increases above resting levels (see Figure 20-5). A portion of the free fatty acids released by adipose lipolysis can be reesterified, mainly in the liver where triacylglycerol synthesis is important for secretion of very-low- density lipoprotein (VLDL) triacylglycerol. Thus increased adipose lipolysis during exercise results in increased provision of both plasma free fatty acids (i.e., bound to albumin) and esterified fatty acids in the triacylglycerols of plasma lipoproteins. The increase in free AMP level leads to activation of AMPK in skeletal muscle. AMPK acts as a sensor of cellular energy status and is activated by metabolic stresses, such as a decrease in substrate supply (as discussed in Chapter 19) or an increase in energy demand (such as muscle contraction), both of which increase the AMP/ATP ratio. The increases in cytosolic Ca2+ that accompany muscle contraction can also activate AMPK independently of adenine nucleotide changes. Once activated, AMPK acts on its downstream target proteins to alter metabolism in the working muscle to promote utilization of both glucose and fatty acids as fuels.
Regulation of Fuel Utilization in Response to Physical Activity
Muscle Structure
Muscle Fiber Types
TYPE 1 RED FIBERS SLOW OXIDATIVE FATIGUE RESISTANT
TYPE 2A RED FIBERS FAST OXIDATIVE FATIGUE RESISTANT
TYPE 2X WHITE FAST GLYCOLYTIC FATIGABLE
Myosin heavy chain isoform
MHC-β (gene MCH7)
MHC-2A (gene MYH2)
MHC-X (gene MYH1)
Myosin ATPase activity
Slow
Intermediate
Fast
Contraction velocity
Slow
Fast
Very fast
Resistance to fatigue
High
Intermediate
Low
Recruitment order
Early
Intermediate
Late
Activity used for
Aerobic (e.g., long- distance running)
Long-term aerobic plus anaerobic (e.g., middle-distance running and swimming)
Short-term anaerobic (e.g., sprinting)
Myoglobin content
High
Intermediate
Low
Generate ATP by
Aerobic system
Aerobic system
Anaerobic system
Mitochondrial density
High
Intermediate
Low
Capillary density
High
Intermediate
Low
Oxidative capacity
High
Intermediate
Low
Glycolytic capacity (glycogen phosphorylase)
Low
High
High
Creatine phosphate content
Intermediate
High
High
Glycogen content
Low
High
High
Triacylglycerol content
High
Intermediate
Low
The Energy Cost of Movement
Skeletal Muscle Fuel Utilization During Rest
Fuel Utilization by Working Muscle
Physiological Changes that Accompany Physical Activity
Glucagon Increases Hepatic Glucose Production
Catecholamines Stimulate Lipolysis and Use of Intracellular Fuels
Stimulation of Muscle Contraction Results in Increases in Muscle Cytosolic Ca2+ Concentration and AMP/ATP Ratio
AMPK Overrides the Fatty Acid–Glucose Cycle and Permits Upregulation of Both Glucose and Fat Utilization
![]()
Stay updated, free articles. Join our Telegram channel

Full access? Get Clinical Tree


Regulation of Fuel Utilization in Response to Physical Activity