Time (min)
Total flow (mL/min)
Pump B concentration (%)
0
5
0.4
0.6
5
0.5
0.6
50
1.9
0.6
50
2.0
0.6
100
2.6
0.6
100
2.8
1.0
100
2.9
1.0
100
3.0
1.0
5
3.5
1.0
5
2.
Autosampler injects 40 μL on to the C18 Monolithic silica HPLC column equilibrated at 5 % methanol (5 % mobile phase B) and flowing initially at 1 mL/min (see Note 5 ).
3.
After 30 s, the methanol concentration is rapidly increased to 50 % and held there while flow is decreased to 0.6 mL/min to allow for separation of cortisol peaks from other compounds.
4.
The Mobile Phase B concentration is raised to 100 % methanol at 1.0 mL/min to wash away any late-eluting components, and prepare for the next injection. At 3 min the concentration returns to 5 % B to equilibrate column for the next injection.
5.
For the first 1.4 min of the run, column eluate is diverted to waste, then the diverter valve directs flow into the API-5000 until 3.0 min of run time, when flow again returns to waste.
6.
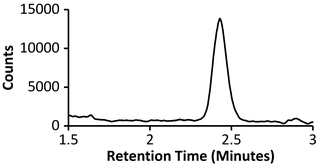
Chromatography is performed at ambient temperature; Cortisol elutes at about 2.4 min, and total run time is 3.5 min.
4 MS Method
1.
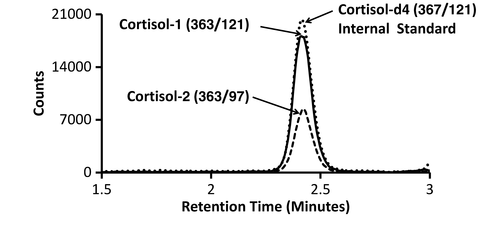
MS/MS parameters for gas, temperature, and voltage settings are summarized in Table 2. The MRM transitions and corresponding parameters for Cortisol and Internal Standard fragment ions monitored in the assay are shown in Table 3 (see Note 6 ).
Table 2
MS/MS operating parameters
Ionization mode | Positive |
|---|---|
Ion source | Turboionspray (ESI) |
Curtain gas | 25 |
CAD gas | Med |
Ionspray voltage | 3000 V |
Temperature | 500 °C |
Gas 1 | 40 |
Gas 2 | 40 |
Declustering potential | 125 |
Entrance potential | 10 |
Table 3
MRM transitions and corresponding parameters
Compound | Q1 mass | Q3 mass | Dwell time (ms) | CE | CXP |
|---|---|---|---|---|---|
Cortisol 1 | 363.4 | 121.1 | 100 | 36 | 18 |
Cortisol 2 | 363.4 | 97.4 | 100 | 42 | 15 |
D4-cortisol | 367.4 | 121.1 | 75 | 33 | 15 |
2.
Get Clinical Tree app for offline access

A representative LC-MS/MS total ion chromatogram of Cortisol and the MRM transitions of cortisol and the internal standard are shown in Figs. 1 and 2, respectively.


Fig. 1
Total ion chromatogram of cortisol assay with cortisol eluted at 2.42 min

Fig. 2


MRM transitions of cortisol (363/121 and 363/97) and the internal standard (367/121)
Stay updated, free articles. Join our Telegram channel

Full access? Get Clinical Tree


