Ion
Mass (amu)
Charge state
Mass accuracy
IGF-1 analyte
1093.5209
+7
10 ppm
1093.3475
+7
10 ppm
1093.6640
+7
10 ppm
Rat IGF-1Ox IS
1098.9622
+7
10 ppm
Compound parameters
Capillary voltage
5000 V
Nozzle voltage
500 V
Nebulizer
50 psi
Sheath gas temperature
250 °C
Sheath gas
5 L/min
Scan width (at full scan)
m/z 900–1100
3.4 Data Analysis and Quantitation
1.
Data is quantitated using the Mass Hunter Quant software (Agilent, Santa Clara, CA).
2.
Calibration curves are established for every day of analytical run based on linear fit regression of IS peak area/IS concentration (x-axis) vs. analyte concentration/IS peak area (y axis). See Note 4 .
3.
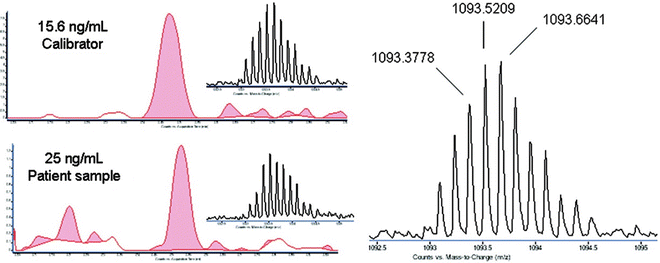
Three “fingers” in the IGF-1 isotopic envelope (1093.5249, 1093.3475, and 1093.6640) with narrow mass extraction width of 5 ppm are used for quantitation.
4.
Calibration curve is acceptable if correlation coefficient is ≥0.99. If one of the calibrators are out of range by greater than ±20 % of expected value, then the curve may be plotted after eliminating the calibrator. The lowest and the highest calibrator may not be removed as it will affect the LOQ and reportable range.
5.
QC values are acceptable if found to be with ±2SD of the established mean for the lot.
6.
The chromatographic retention times are monitored closely. A ±0.03 min shift in retention time on each LC system is considered acceptable.
7.
Get Clinical Tree app for offline access

A representative chromatograph is given in Fig. 1.


Fig. 1


Example chromatograms and averaged spectra for IGF-1 in calibrators (15.6 ng/mL) and patient samples (25 ng/mL). The isotopic resolution of the most abundant charge state (7+) for IGF-1 is shown with the quantifier (m/z 1093.5209) and two qualifier ions (m/z 1093.3778 and 1093.6641) indicated. Published in: Cory E. Bystrom; Shijun Sheng; Nigel J. Clarke; Anal. Chem. 2011, 83, 9005–9010. Reprinted (adapted) with permission from (Anal. Chem. 2011, 83, 9005–9010). Copyright (2011) American Chemical Society. Copyright permission obtained
Stay updated, free articles. Join our Telegram channel

Full access? Get Clinical Tree


