Chapter Fourteen
Quality Improvement and the Medication Use System
Learning Objectives
After completing this chapter, the reader will be able to
• Explain the changing environment for quality measurement and performance reporting in health care.
• Define quality and value in the context of health care services.
• Delineate the concepts of structure, process, and outcomes for quality assessment.
• Describe a systematic method for quality improvement.
• Explain the role of performance indicators in quality improvement.
• Draft a performance indicator related to the medication use system.
• Discuss quality improvement techniques applied in drug information practice.
![]()
Key Concepts
![]() The term value has been assigned many definitions, but within health care, it usually reflects the ratio of quality and costs (value = quality/cost).
The term value has been assigned many definitions, but within health care, it usually reflects the ratio of quality and costs (value = quality/cost).
![]() Significant drivers for greater transparency in the quality and value of health care services include the federal government, employers that provide health care benefits, and accreditation organizations such as The Joint Commission (TJC).
Significant drivers for greater transparency in the quality and value of health care services include the federal government, employers that provide health care benefits, and accreditation organizations such as The Joint Commission (TJC).
![]() Quality improvement is prospective, continuous, team oriented, nonpunitive, systems oriented, customer focused, and data driven.
Quality improvement is prospective, continuous, team oriented, nonpunitive, systems oriented, customer focused, and data driven.
![]() A common methodology for quality improvement is known as FOCUS-PDCA (Find, Organize, Clarify, Understand, Select, Plan, Do, Check, Act).
A common methodology for quality improvement is known as FOCUS-PDCA (Find, Organize, Clarify, Understand, Select, Plan, Do, Check, Act).
![]() The Donabedian framework for quality assessment in health care includes the key elements of structure, process, and outcomes.
The Donabedian framework for quality assessment in health care includes the key elements of structure, process, and outcomes.
![]() Performance indicators are used to measure quality as part of the check function of quality improvement. The indicators typically focus on the process or outcomes of a care system.
Performance indicators are used to measure quality as part of the check function of quality improvement. The indicators typically focus on the process or outcomes of a care system.
![]() Performance indicators can be subdivided into sentinel (occurrence of a serious event) or aggregate categories. Aggregate indicators are further divided into continuous or rate-based indicators.
Performance indicators can be subdivided into sentinel (occurrence of a serious event) or aggregate categories. Aggregate indicators are further divided into continuous or rate-based indicators.
![]() Medication use evaluation is often part of an organization’s overall performance improvement program that uses definitions of safe and effective use of medications to assess components of the medication use process.
Medication use evaluation is often part of an organization’s overall performance improvement program that uses definitions of safe and effective use of medications to assess components of the medication use process.
![]() Performance, as demonstrated by data collected in the performance improvement process, not meeting the defined standard or threshold or falling outside the control limits (for ongoing or follow-up assessments) indicates that intervention to improve performance is necessary.
Performance, as demonstrated by data collected in the performance improvement process, not meeting the defined standard or threshold or falling outside the control limits (for ongoing or follow-up assessments) indicates that intervention to improve performance is necessary.
Introduction
Value-driven health care is being touted as the future model for health care in the United States.1 ![]() The term value has been assigned many definitions, but within health care, it usually reflects the ratio of quality and costs (value =quality/cost). Thus, value is optimized by enhancing quality while minimizing cost. Although it was traditionally assumed that higher quality would only be possible through higher expenditures, the medical community has learned that improving the quality of care may lead to long-term control of health care costs. Health care administrators have long been attentive to measuring expenditures on care and have developed cost-accounting systems that have allowed determination of costs of procedures, drugs, and various care models. However, the health care system has only recently developed explicit measures of quality. By measuring this missing piece of the value equation, it is now possible to achieve a more balanced perspective on health system performance.
The term value has been assigned many definitions, but within health care, it usually reflects the ratio of quality and costs (value =quality/cost). Thus, value is optimized by enhancing quality while minimizing cost. Although it was traditionally assumed that higher quality would only be possible through higher expenditures, the medical community has learned that improving the quality of care may lead to long-term control of health care costs. Health care administrators have long been attentive to measuring expenditures on care and have developed cost-accounting systems that have allowed determination of costs of procedures, drugs, and various care models. However, the health care system has only recently developed explicit measures of quality. By measuring this missing piece of the value equation, it is now possible to achieve a more balanced perspective on health system performance.
The Changing Environment for Health Care Quality
The measurement of quality within health care settings has expanded rapidly during the previous two decades. ![]() Significant drivers for greater transparency in the quality and value of health care services include the federal government, employers that provide health care benefits, and accreditation organizations such as The Joint Commission (TJC). Accreditation standards for many providers have been amended to require providers to collect performance data, and many reports are now publically available on the quality of hospitals,2 long-term care facilities,3 health plans,4 and prescribers.5 Additionally, many public and private purchasers (e.g., insurance companies) of health care services have begun to demand evidence of quality and value.6 The most notable exception to these trends has been community pharmacy, but this is starting to change.
Significant drivers for greater transparency in the quality and value of health care services include the federal government, employers that provide health care benefits, and accreditation organizations such as The Joint Commission (TJC). Accreditation standards for many providers have been amended to require providers to collect performance data, and many reports are now publically available on the quality of hospitals,2 long-term care facilities,3 health plans,4 and prescribers.5 Additionally, many public and private purchasers (e.g., insurance companies) of health care services have begun to demand evidence of quality and value.6 The most notable exception to these trends has been community pharmacy, but this is starting to change.
In 2006, the Centers for Medicare & Medicaid Services (CMS) facilitated the creation of the Pharmacy Quality Alliance (PQA) to create standards for performance measurement and reporting for prescription drug plans and community pharmacies. The initial testing of these performance measures took place in 2007,7 and several demonstration projects have been conducted to show how community pharmacies can be included in performance measurement systems.8 Although CMS is not publicly reporting on the quality of individual pharmacies, it has included several PQA-developed quality measures within the Medicare Part D Plan ratings. As the scrutiny of prescription drug plans increases, plans are likely to begin requiring participation of their network pharmacies in quality measurement programs and to begin reporting pharmacy performance data to the public. Thus, all sectors of health care will be affected by the rapidly expanding trend of quality measurement and public reporting of performance data.
This chapter will focus on the measurement of quality in the medication use system and the use of these measures in improving the quality of medication use. The term performance will be used interchangeably with quality within this chapter, although understanding that performance can also refer to the overall value of the health care system is important.
Purpose of Measuring Quality
Quality, like value, has been defined in many different ways. Although the definitions for quality may vary, the purpose of measuring quality is to identify problems in a system (also known as opportunities for improvement) and monitor improvements in quality as systems are modified.9 Although quality improvement is the goal of collecting performance data, the mechanisms for using performance data in achieving quality improvement may vary. For example, the performance data may be used directly by a health care organization to identify opportunities for improvement and to gauge the impact of changes in its policies or procedures.
Performance data may also be used by external entities (e.g., a regulatory or accrediting body) to determine whether a health care organization should retain its accreditation or certification. The data may also be used to determine payments to providers (e.g., pay for performance), or the data may be used by employers, governments, or the public for determining which providers to use.
When comparative data on the performance of health care providers are released to payers and patients, it is presumed that the providers in a competitive environment will improve quality to maintain market share.
Quality Improvement
Practitioners are sometimes confused when faced with the myriad of quality-related acronyms being used today, such as CQI (continuous quality improvement), QI (quality improvement), QA (quality assurance), TQM (total quality management), SPC (statistical process control), and PDCA (plan, do, check, act). Things become even murkier when many different quality-related philosophies are added—along with blurry distinctions between quality improvement, quality assurance, and quality control.
Quality improvement can generally be characterized by certain attributes, which are listed in Table 14–1. Concisely stated,![]() quality improvement is prospective, continuous, team oriented, nonpunitive, systems oriented, customer focused, and data driven. Although there are a variety of methods, the quality improvement process is typically implemented via the PDCA Cycle, also called the Deming Cycle (although Deming referred to it as the Shewhart Cycle).10,11 This cyclical process involves four key elements: Plan, Do, Check, and Act.
quality improvement is prospective, continuous, team oriented, nonpunitive, systems oriented, customer focused, and data driven. Although there are a variety of methods, the quality improvement process is typically implemented via the PDCA Cycle, also called the Deming Cycle (although Deming referred to it as the Shewhart Cycle).10,11 This cyclical process involves four key elements: Plan, Do, Check, and Act.
TABLE 14–1. ATTRIBUTES OF CONTINUOUS QUALITY IMPROVEMENT
To apply PDCA to a new healthcare service, Plan would entail designing a new approach for providing the service that leads to an improvement in quality. This approach would include guidelines or procedures for how care will be provided, and also plans for how the care process will be evaluated. The Do step in the cycle concerns the implementation of the new plan, while Check refers to an objective evaluation of the plan. Once the performance of the plan has been checked, the performance data can be Acted upon to standardize the new plan (assuming that it led to improvement) or the existing plan can be further revised and the PDCA cycle can be repeated.
![]() A common methodology for quality improvement is known as FOCUS-PDCA (Find, Organize, Clarify, Understand, Select, Plan, Do, Check, Act). It is an extension of the PDCA cycle (Figure 14–1).8 This approach was developed by the Hospital Corporation of America to facilitate quality improvement efforts in their hospitals. The first step of FOCUS-PDCA is to Find the process that will be targeted for improvement (e.g., the pharmacokinetic service referral process). The second step is to Organize a team to study the problem (e.g., pharmacists, physicians, nurses, unit clerks). Next, Clarify the team’s understanding of the process (i.e., ensure that everyone has a common understanding of how the referral process is actually being carried out, perhaps through the use of a flow diagram). Then, seek to Understand the root causes of variation in performance (i.e., identify problems such as a poorly designed workflow, inadequate training, or unclear roles and determine why they occur). Finally, Select the parts of the structure or process to change. Once the target for change has been selected, a new Plan can be formulated for how the process will change and then continue the PDCA cycle through the Do, Check, and Act steps.
A common methodology for quality improvement is known as FOCUS-PDCA (Find, Organize, Clarify, Understand, Select, Plan, Do, Check, Act). It is an extension of the PDCA cycle (Figure 14–1).8 This approach was developed by the Hospital Corporation of America to facilitate quality improvement efforts in their hospitals. The first step of FOCUS-PDCA is to Find the process that will be targeted for improvement (e.g., the pharmacokinetic service referral process). The second step is to Organize a team to study the problem (e.g., pharmacists, physicians, nurses, unit clerks). Next, Clarify the team’s understanding of the process (i.e., ensure that everyone has a common understanding of how the referral process is actually being carried out, perhaps through the use of a flow diagram). Then, seek to Understand the root causes of variation in performance (i.e., identify problems such as a poorly designed workflow, inadequate training, or unclear roles and determine why they occur). Finally, Select the parts of the structure or process to change. Once the target for change has been selected, a new Plan can be formulated for how the process will change and then continue the PDCA cycle through the Do, Check, and Act steps.
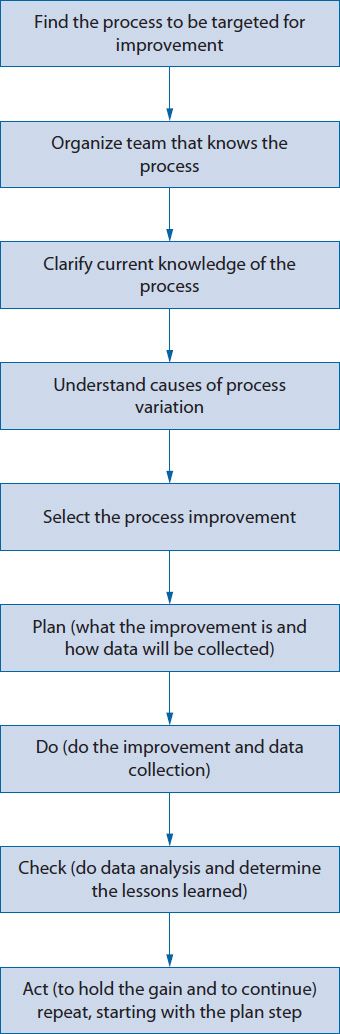
Figure 14–1. FOCUS-PDCA®.
MEASURING QUALITY IN THE MEDICATION USE SYSTEM
One of the most challenging elements of quality improvement is measuring the quality of care. Donabedian12 suggested that the evaluation of medical care quality could be best accomplished by subdividing care into three parts.![]() The Donabedian framework for quality assessment in health care includes the key elements of structure, process, and outcome. The Donabedian framework also can be used to evaluate the quality of the medication use system.13
The Donabedian framework for quality assessment in health care includes the key elements of structure, process, and outcome. The Donabedian framework also can be used to evaluate the quality of the medication use system.13
Structure refers to the characteristics of providers, the tools and resources at their disposal, and the physical or organizational settings in which they work.12 Examples include professional licensure or certification, computer systems for tracking patient information, patient counseling areas, and human resource policies. The elements of structure create the environment for care. These structural elements may be necessary to provide optimal care, but their presence does not ensure optimal care.
Process refers to the set of activities that occur between the patient and the provider, encompassing the services and products that are provided to patients and the manner in which the services are provided. Experts often group the specific elements of care processes within two domains: technical or interpersonal. The technical domain of patient care may include gathering patient information, entering prescription information into computers, reviewing patient records, checking prescription labels, evaluating a patient’s laboratory results, identifying and resolving potential drug-related problems, and answering patient questions. The interpersonal domain of patient care includes the ability of the practitioner to express empathy, listen attentively, and develop a caring relationship with the patient.12 The process of care is often the primary focus of quality improvement efforts as practitioners strive to do what is best for patients. Care processes can be directly evaluated by using the norms or standards that exist across the health care system (e.g., what is commonly accepted as good care) or indirectly evaluated by determining their impact on outcomes.
The term outcomes was originally defined by Donabedian as “a change in a patient’s current and future health status that can be attributed to antecedent health care.”12 Lohr also characterized outcomes in terms of the consequences of medical care for patients (death, disability, disease, discomfort, and dissatisfaction).14 In later years, the use of this term has broadened to encompass the economic, clinical, and humanistic consequences of health care processes (ECHO model).15 In the ECHO model, outcomes may include economic consequences (e.g., costs of care), clinical measures or endpoints (e.g., blood pressure, glycosylated hemoglobin [HgbA1c], pain, mortality—see Chapters 4 and 5), and humanistic issues (patient satisfaction or health-related quality of life). Outcomes are sometimes classified as intermediate or long term.16 This terminology results from considering the link between process and numerous outcomes as a causal chain of events. Intermediate outcomes may occur between the health care process and long-term or ultimate outcomes. For example, providing pharmacist counseling services regarding the appropriate use of blood glucose meters (the process) will lead to better adherence to the meter (an intermediate outcome), which leads to more appropriate adjustments of medications (another intermediate outcome) that leads to better glycemic control (another intermediate outcome) that could, in turn, lead to better health-related quality of life (the long-term outcome). Thus, when evaluating the linkage of the process with long-term outcomes, identifying potential intermediate outcomes along the causal path between the process and long-term outcomes may be useful.
PERFORMANCE INDICATORS
Within the cycle for CQI, quality is often monitored through the use of performance indicators.17 ![]() Performance indicators are used to measure quality as part of the check function of quality improvement. The indicators typically focus on the process or outcomes of a care system, although they can also focus on structure. Typically, they measure specific processes, or steps within a process, that are known to be associated with an important outcome. For example, to evaluate the process of responding to a drug information request, one could identify a few key steps within the process that can be easily measured (e.g., in what percentage of cases was the desired timeline for a response documented, or in what percentage of cases was the desired timeline met?).
Performance indicators are used to measure quality as part of the check function of quality improvement. The indicators typically focus on the process or outcomes of a care system, although they can also focus on structure. Typically, they measure specific processes, or steps within a process, that are known to be associated with an important outcome. For example, to evaluate the process of responding to a drug information request, one could identify a few key steps within the process that can be easily measured (e.g., in what percentage of cases was the desired timeline for a response documented, or in what percentage of cases was the desired timeline met?).
Although one might think that outcomes are the ideal indicator of health care performance, they are often more difficult to measure than specific health care functions and may not always be directly, or independently, caused by the process of interest. Process indicators are useful for quality improvement when the:
• Outcome is difficult to measure.
• Outcome is far removed in time from the process (e.g., 10-year survival in cancer).
• Outcome is influenced by many factors other than the process.
• Process, by itself, is of interest (e.g., TJC says it is required to be measured for accreditation, or because it reflects an issue of social justice, such as racial inequities in receiving specific elements of care).
Therefore, if one wanted to improve the quality of care for patients with diabetes, it may be more useful to assess the appropriateness of adjustments in insulin doses than to measure the rate of hospitalizations during a 5-year period for patients in the diabetes care program. This is not to suggest that evaluating outcomes is unwise. If outcomes can be directly linked to the process and can be evaluated in a timely, efficient, and reliable manner, they become powerful tools for quality improvement.
![]() Performance indicators are typically categorized as either sentinel or aggregate measures.18 Sentinel indicators reflect the occurrence of a serious event that requires further investigation (e.g., adverse drug-related event, death), whereas aggregate indicators provide a summary of the frequency, or timeliness, of a process by aggregating numerous cases. Aggregate indicators are further divided into continuous or rate-based indicators. Continuous indicators provide a simple count, or time estimate, related to a process (e.g., average turnaround time on medication orders), whereas rate-based indicators usually measure the proportion of activities, or patients, that conform to a desired standard (e.g., the proportion of stat orders that are dispensed within 15 minutes). Thus, the rate-based indicators are generally expressed as a ratio. The denominator within the ratio should be the total number of patients within the target population, while the numerator should be the number of patients who received (or failed to receive) the desired test or who achieved a specified goal. For example, if it is necessary to construct an indicator for medication errors, the numerator would be the number of medication errors within a defined time period and the denominator would be the total number of error opportunities (e.g., number of prescriptions filled) during the same time period. This facilitates the comparison of error rates over time even as prescription volume fluctuates.
Performance indicators are typically categorized as either sentinel or aggregate measures.18 Sentinel indicators reflect the occurrence of a serious event that requires further investigation (e.g., adverse drug-related event, death), whereas aggregate indicators provide a summary of the frequency, or timeliness, of a process by aggregating numerous cases. Aggregate indicators are further divided into continuous or rate-based indicators. Continuous indicators provide a simple count, or time estimate, related to a process (e.g., average turnaround time on medication orders), whereas rate-based indicators usually measure the proportion of activities, or patients, that conform to a desired standard (e.g., the proportion of stat orders that are dispensed within 15 minutes). Thus, the rate-based indicators are generally expressed as a ratio. The denominator within the ratio should be the total number of patients within the target population, while the numerator should be the number of patients who received (or failed to receive) the desired test or who achieved a specified goal. For example, if it is necessary to construct an indicator for medication errors, the numerator would be the number of medication errors within a defined time period and the denominator would be the total number of error opportunities (e.g., number of prescriptions filled) during the same time period. This facilitates the comparison of error rates over time even as prescription volume fluctuates.
Selecting and Defining an Indicator
Characteristics for an ideal indicator have been proposed by several authors and organizations.17–19 In general, it is necessary to seek indicators that are clearly defined, quantitative, reliable, clinically meaningful, and actionable. Kerr and associates20 also suggest using indicators where the link between process and outcome is clearly established and the link between an indicator and a potential quality improvement response is evident. Thus, the indicator provides clinically meaningful and actionable information. Indicators should be selected on the basis of their usefulness to quality improvement efforts. The indicator should help determine where potential problems are occurring within the process. For example, it may be useful to know that only 30% of patients reported that they were provided with adequate answers to their questions about medications. The way drug-related information is provided to patients can then be changed. However, knowing that only 30% of patients with diabetes had received a microalbumin test would not be as helpful if there is no control of when that test is ordered.
Providing definitions for any variables that are not intuitive will also be necessary. Medication error means different things to different people; therefore, if it is necessary to construct an indicator for medication errors, the staff would need to be informed what constitutes an error (see Chapter 16). It is also necessary to identify inclusion or exclusion criteria. The patients to be included within an indicator must be determined. Even for disease-specific indicators, it is necessary to decide whether to combine data for all patients with the disease or to subdivide the analyses for different types of patients with that disease. For example, it may be possible to divide patients with diabetes into at least three subgroups: Type 1, Type 2, and gestational. Other questions include the following: are people of all ages included? Are only those who attended all diabetes education sessions or anyone who completed even a portion of the program included? The answers to these questions may depend on the particular indicator. The key is to compare apples to apples. If, for example, the standard for HgbA1c testing is different for patients with gestational diabetes compared with Type 1 or Type 2 diabetes, then a person would not want to combine HgbA1C data from all these patients into a single indicator.
To judge the quality of performance from the indicator data, having a frame of reference will be necessary. Thus, current performance data can be compared with previous performance (i.e., was there an improvement over time?) or with an external criterion or standard (i.e., benchmark); both comparisons can be useful. For example, it is possible to track the proportion of patients who reached the target HgbA1C during the previous 2 years (e.g., 45% of patients last year versus 62% of patients this year). However, whether this year’s result, 62% of patients reaching the target, is considered good, fair, or poor performance is less clear. To determine this, compare the success rate with that of other programs. If the latest data from surrounding health plans indicate that 60% of their enrollees with diabetes have achieved the same target for HgbA1C, the person could assert that performance is at least as good as the standard. Ideally, the goal will be to continually improve success rate, regardless of the minimal standard.
Sources for Indicator Data
Data for constructing indicators can come from numerous sources. The most common sources of performance data are (1) medical or prescription records, (2) administrative claims, (3) operations records, and (4) patient reports. Each of these sources has strengths and weaknesses. Medical records provide rich information about an individual patient; however, the aggregation of data from written documents can be very slow and labor intensive. As advances in health information technology lead to widespread adoption of electronic medical records, the use of medical records for performance review will become increasingly attractive.
Administrative claims are available in electronic format, so data across providers and across an entire patient population can be easily aggregated and analyzed. However, administrative claims lack in-depth information and may contain some inaccuracies in coding. Thus, indicators built solely on administrative claims are limited in their usefulness for problem solving.
Operations records refer to data that are collected as part of the process of care. For example, a hospital pharmacy may document the time that a medication order was received and the time that the medication was dispensed. If the pharmacy has a predetermined standard for the timeliness of medication order turnaround, then a performance indicator could be developed to show the proportion of medications that were dispensed within the designated timeframe.
Patient-reported data can also be valuable in assessing several subdomains of quality. Patient satisfaction measures are the most common way of collecting patient feedback on care. Satisfaction is an important outcome of care because patients who are dissatisfied with services are more likely to complain to external entities (e.g., regulatory agencies or employers) and are more likely to discontinue using services. Patients can also be asked questions about specific steps in the process of care to identify the source of quality deficits (e.g., were you asked if you had any questions about your medication?). The most commonly used tools for gathering patient feedback are within the Consumer Assessment of Healthcare Providers and Systems (CAHPS) family of surveys (http://www.cahps.ahrq.gov/).21 CAHPS contains surveys for health systems, physicians and other facilities and clinicians. PQA has developed a CAHPS-like survey tool to gather patient feedback on ambulatory pharmacy services (http://pqaalliance.org/measures/default.asp).22,23
The best method for collecting performance data is to use a hybrid approach wherein several different sources of data are used to examine the same care process. This allows for a more reliable and broad-based perspective on performance. This is important because different data sources have been found to provide different estimates of the quality of care.24,25
The collection of performance data is good, but data are most useful when transformed into interpretable and actionable information. Several tools can help transform data into easily interpreted information. These tools include Pareto charts, bar charts, scatter diagrams, regression analyses, run charts, and control charts. Detailed information on the use of these tools can be found below and Appendix 14–1;9,26 however, examples for a few of the tools are shown in Figures 14–2 through 14–6.
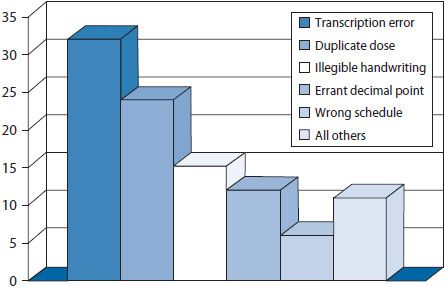
Figure 14–2. Pareto chart: factors contributing to improper dose errors.
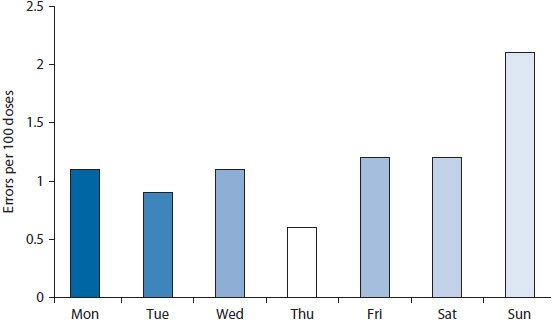
Figure 14–3. Bar chart showing percent of doses dispensed in error.
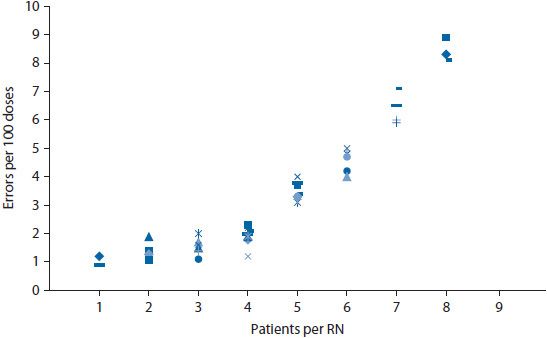
Figure 14–4. Scatter diagram to depict relationship of error rate and workload.
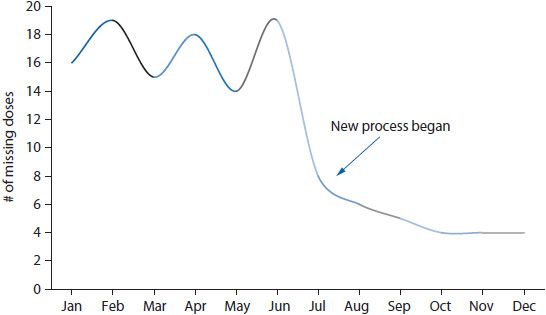
Figure 14–5. Run chart depicting rate of missing doses over time.
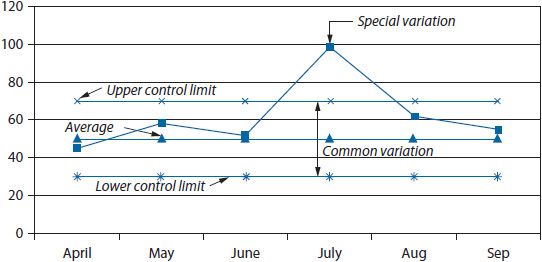
Figure 14–6. Control chart.
Pareto charts are vertical bar graphs with the data presented so that the bars are arranged from left to right on the horizontal axis in their order of decreasing frequency. This arrangement helps identify which problems to address in what order. By addressing the data represented in the tallest bars (e.g., the most frequently occurring problems or contributing factors) efforts can be focused on areas where the most gain can be realized. Pareto charts are commonly used to identify issues to address, delineate potential causes of a problem, and monitor improvements in processes. An example of a Pareto chart is shown in Figure 14–2. This example illustrates frequently occurring factors contributing to improper dose medication errors. By looking at transcription errors as a contributing factor on which to focus quality improvement efforts, the quality improvement team will generally gain more than by tackling the smaller bars.
Bar charts and scatter diagrams are particularly useful for displaying data for sentinel events. If a pharmacy wanted to evaluate data on medication errors, a bar chart could show the distribution of errors by day of the week or by time of day (Figure 14–3). Displaying the rate (i.e., percent of doses dispensed in error) rather than a simple count of errors helps control for fluctuations in the workload across days of the week. This might help pinpoint whether errors were more likely to occur during particular days or shifts. If so, the staff could then investigate why the errors were higher at particular times. The frequency of errors could also be depicted on a scatter diagram. A scatter diagram illustrates the relationship of two variables. For example, a nursing home might be interested in whether the frequency of errors is related to staffing levels. A scatter diagram could be constructed wherein the number of errors was shown on the vertical (y) axis and the staffing level on the horizontal (x) axis (Figure 14–4). The data points are plotted to show the number of errors at each level of staffing.
Run charts and control charts are useful for depicting trends in rate-based indicators. Both charts illustrate the trend in a variable over time; however, the control chart also shows the extent of variation in the trend by placing control limits above and below the trend line (typically at two standard deviations from the mean). In most cases, a simple run chart will suffice for visualizing a trend. For example, if a health system wanted to examine the impact of changing the medication delivery process on the rate of missing doses of medications, the rate could be calculated for each month and trended over time (Figure 14–5).
A Stepwise Approach to Constructing a Rate-Based, Process Indicator27
1. Identify an area of concern.
The area of concern may be identified from internal reports of quality-related problems or from external mandates (e.g., requirements for accreditation). Often, these concerns relate to areas in which errors have occurred with great frequency or in which the clinical consequences of suboptimal quality are substantial. For illustrative purposes, patient’s understanding of a medication regimen will be used as the area of concern for a community pharmacy.
2. Select the process, or segments of a process, to study.
The process most directly related to the area of concern should be examined, and a specific segment of the process may be selected for performance measurement. For patient’s understanding of a medication regimen, the relevant process within a community pharmacy may be the dispensing process and the specific segment of the process for assessment may be patient counseling.
3. Determine what can be measured to evaluate the process.
For patient counseling, it is possible to measure the frequency of patient counseling events, the accuracy of information provided to patients, or the patient’s knowledge about the drug regimen. Those performing the assessment should then select the measures that are most likely to be reliable, are feasible to collect, and facilitate a valid assessment of the quality of the counseling segment of the dispensing process. In this example, the rate of patient counseling might first be selected for measurement because it should be easily and reliably collected and will provide a valid assessment of whether counseling was occurring (although it would not tell the effectiveness of counseling).
4. Define the numerator for your indicator.
For an indicator, the numerator should reflect the number of times that a selected event occurred. For the patient counseling indicator, the numerator could be the number of patient counseling events within a specified time interval (e.g., 1 month). To accurately determine the number of counseling events, defining what is and what is not a counseling event is important. For example, must a counseling event involve oral communication between the patient and the pharmacist or will the provision of a written pamphlet suffice? If oral communication is required, how much communication is necessary to be considered a counseling event? Do certain elements of drug information need to be conveyed for the event to be counted? Ensuring that all employees have a clear understanding of the definition of counseling is important to reduce inaccuracies in counting the events.
5. Define the denominator for your indicator.
For an indicator, the denominator should represent the eligible population or the total number of opportunities in which the numerator could have occurred. For the counseling indicator, the denominator could simply be defined as the number of prescriptions dispensed in a time period (e.g., 1 month). However, it is necessary to refine this number to enhance the validity of our inferences about the quality of counseling. Should both new and refill prescriptions be included in the denominator? If the patient declines the offer to counsel, should they be included in the denominator? If the patient receives five prescriptions at one time, will they be counted as one counseling opportunity or as five counseling opportunities? Having clear inclusion and exclusion criteria will be important to the interpretability of the indicator.
6. Determine the method for data collection.
Stay updated, free articles. Join our Telegram channel

Full access? Get Clinical Tree


