FIGURE 7.1 Modular chemistry/immunoassay analyzers. (A) Siemens Dimension Vista 500. (Photograph courtesy of Siemens.) (B) Roche MODULAR ANALYTICS. (Photograph courtesy of Roche Diagnostics.) (C) Abbott ARCHITECT ci8200. (Photograph courtesy of Abbott Diagnostics.) (D)Beckman Coulter Synchron LXi 725. (Photograph courtesy of Beckman Coulter.)
Other forces are also driving the market toward more focused automation. Higher volume of testing and faster turnaround time have resulted in fewer and more centralized core laboratories performing more comprehensive testing.4 The use of laboratory panels or profiles has declined, with more diagnostically directed individual tests as dictated by recent policy changes from Medicare and Medicaid. Researchers have known for many years that chemistry panels only occasionally lead to new diagnoses in patients who appear healthy.5 The expectation of quality results with higher accuracy and precision is ever present with the regulatory standards set by the Clinical Laboratory Improvement Amendments, the Joint Commission (formerly the Joint Commission on Accreditation of Healthcare Organizations), the College of American Pathologists, and others. Intense competition among instrument manufacturers has driven automation into more sophisticated analyzers with creative technologies and unique features. Furthermore, escalating costs have spurred healthcare reform and, more specifically, managed care and capitation environments within which laboratories are forced to operate.
BASIC APPROACHES TO AUTOMATION
There are many advantages to automating procedures. One purpose is to increase the number of tests performed by one laboratorian in a given period. Labor is an expensive commodity in clinical laboratories. Through mechanization, the labor component devoted to any single test is minimized, and this effectively lowers the cost per test. A second purpose is to minimize the variation in results from one laboratorian to another. By reproducing the components in a procedure as identically as possible, the coefficient of variation is lowered, and reproducibility is increased. Accuracy is then not dependent on the skill or workload of a particular operator on a particular day. This allows better comparison of results from day to day and week to week. Automation, however, cannot correct for deficiencies inherent in methodology. A third advantage is gained because automation eliminates the potential errors of manual analyses such as volumetric pipetting steps, calculation of results, and transcription of results. A fourth advantage accrues because instruments can use very small amounts of samples and reagents. This allows less blood to be drawn from each patient, and the use of small amounts of reagents decreases the cost of consumables. In addition, automation facilitates better space utilization thru consolidation.
There are three basic approaches with instruments: continuous flow, centrifugal analysis, and discrete analysis. All three can use batch analysis (i.e., large number of specimens in one run), but only discrete analyzers offer random access, or stat, capabilities.
In continuous flow, liquids (reagents, diluents, and samples) are pumped through a system of continuous tubing. Samples are introduced in a sequential manner, following each other through the same network. A series of air bubbles at regular intervals serve as separating and cleaning media. Continuous flow, therefore, resolves the major consideration of uniformity in the performance of tests because each sample follows the same reaction path. Continuous flow also assists the laboratory that needs to run many samples requiring the same procedure. The more sophisticated continuous flow analyzers used parallel single channels to run multiple tests on each sample—for example, SMA. The major drawbacks that contributed to the eventual demise of traditional continuous flow analyzers (i.e., AA and SMA) in the marketplace were significant carryover problems and wasteful use of continuously flowing reagents. Technicon’s (now Siemens) answer to these problems was a noncontinuous flow discrete analyzer (the RA1000), using random access fluid (a hydrofluorocarbon liquid to reduce surface tension between samples/reagents and their tubing) and, thereby, reducing carryover. Later, the Chem 1 was developed by Technicon to use Teflon tubing and Teflon oil, virtually eliminating carryover problems. The Chem 1 was a continuous flow analyzer but only remotely comparable to the original continuous flow principle.
Centrifugal analysis uses the force generated by centrifugation to transfer and then contain liquids in separate cuvettes for measurement at the perimeter of a spinning rotor. Centrifugal analyzers are most capable of running multiple samples, one test at a time, in a batch. Batch analysis is their major advantage because reactions in all cuvettes are read virtually simultaneously, taking no longer to run a full rotor of about 30 samples than it would take to run a few. Laboratories with a high workload of individual tests for routine batch analysis may use these instruments. Again, each cuvette must be uniformly matched to each other to maintain quality handling of each sample. The Cobas-Bio (Roche Diagnostics), with a xenon flash lamp and longitudinal cuvettes,6 and the IL Monarch, with a fully integrated walk-away design, are two of the more successful centrifugal analyzers.
Discrete analysis is the separation of each sample and accompanying reagents in a separate container. Discrete analyzers have the capability of running multiple tests one sample at a time or multiple samples one test at a time. They are the most popular and versatile analyzers and have almost completely replaced continuous flow and centrifugal analyzers. However, because each sample is in a separate reaction container, uniformity of quality must be maintained in each cuvette so that a particular sample’s quality is not affected by the particular space that it occupies. The analyzers listed in Table 7.1 are examples of current discrete analyzers with random access capabilities.
TABLE 7.1 Summary of Features for Selected Mid- and High-Volume Clinical Chemistry Analyzers
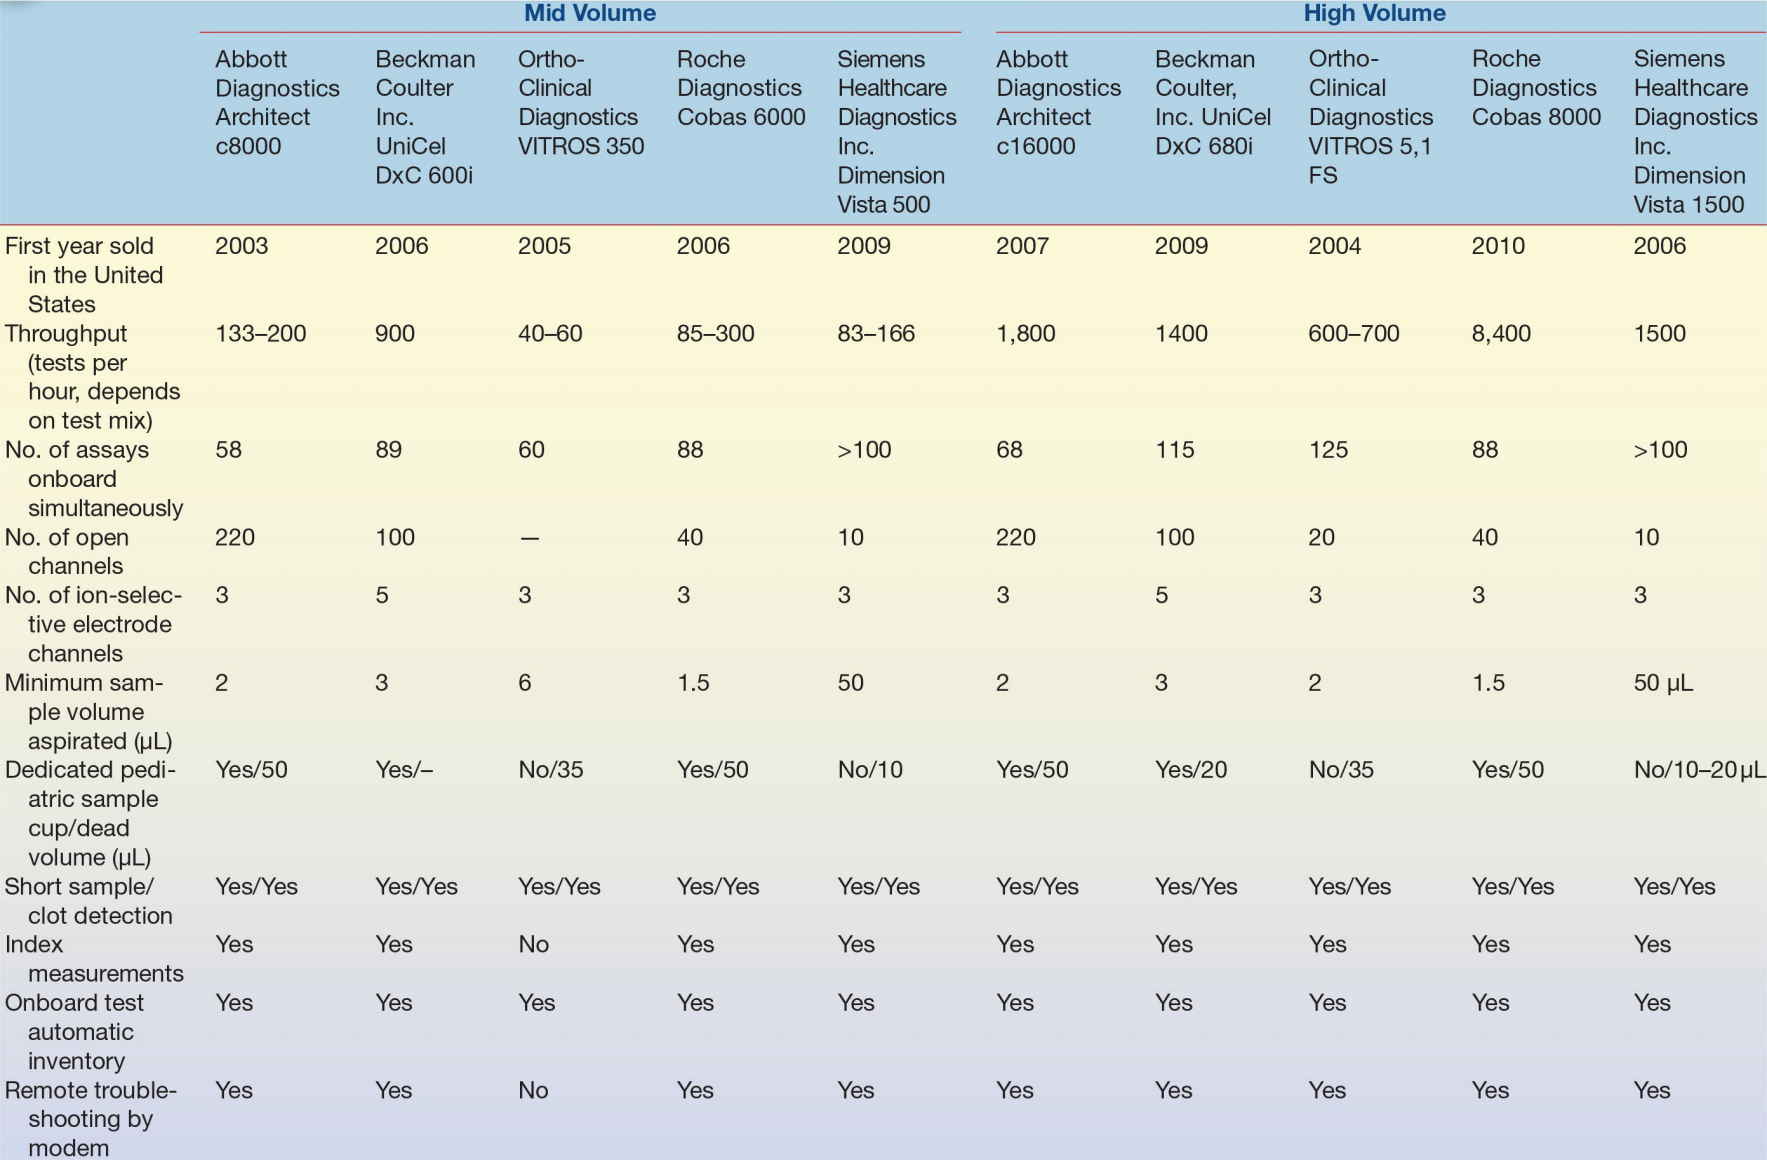
Information obtained from Dabkowski B. Vendors toil and tinker to refine chemistry analyzers. CAP Today. 2011;July:56–71 and directly from vendors.
STEPS IN AUTOMATED ANALYSIS
In clinical chemistry, automation is the mechanization of the steps in a procedure. Manufacturers design their instruments to mimic manual techniques. The major processes performed by an automated analyzer can be divided into specimen identification and preparation, chemical reaction, and data collection and analysis. An overview of these processes is provided in Table 7.2.
TABLE 7.2 Summary of Chemistry Analyzer Operations
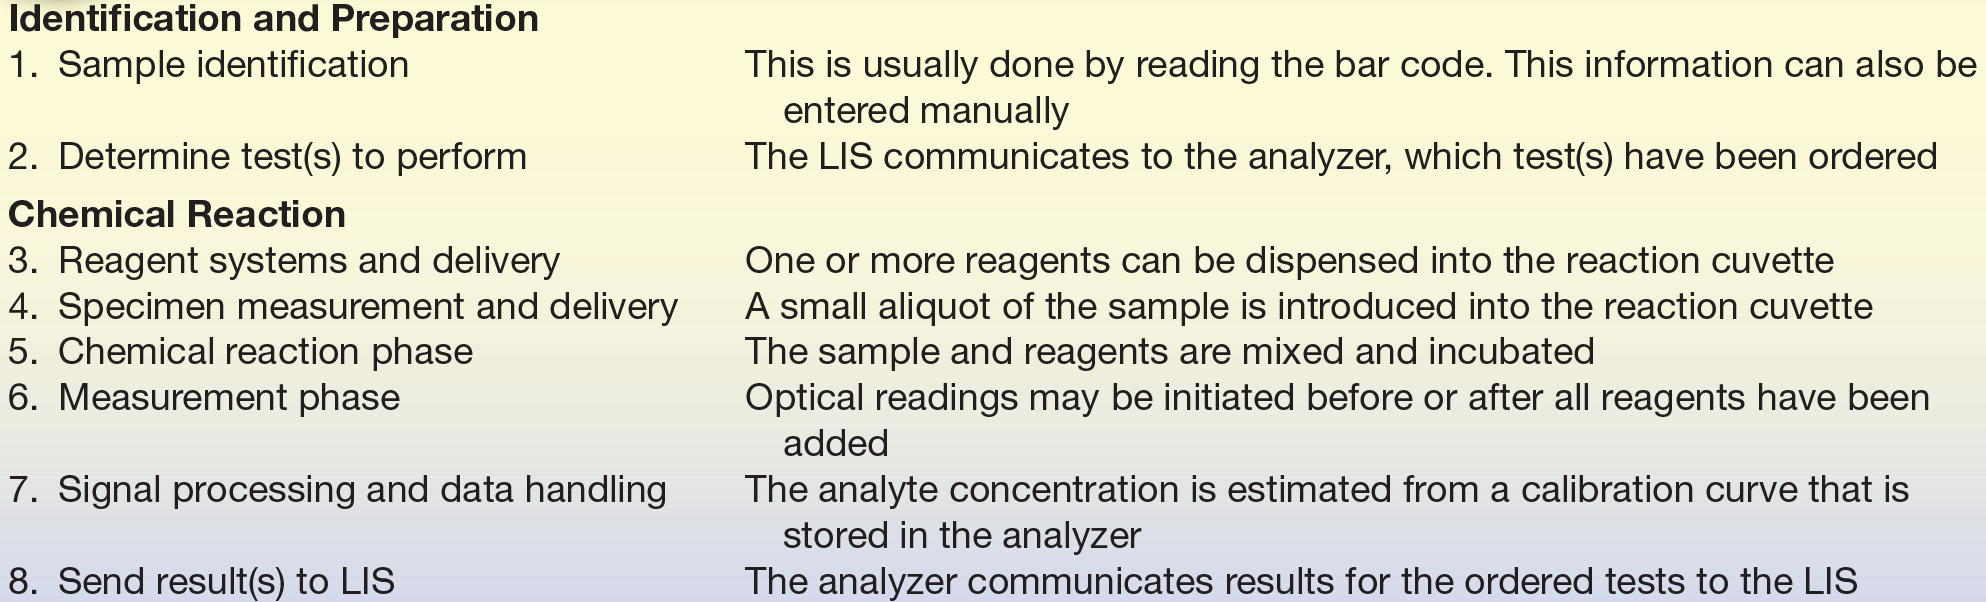
Operations generally occur in the order listed from 1 to 8. However, there may be slight variations in the order. Some steps may be deleted or duplicated. Most analyzers have the capability to dilute the sample and repeat the testing process if the analyte concentration exceeds the linear range of the assay.
Each step of automated analysis is explained in this section, and several different applications are discussed. Several instruments have been chosen because they have components that represent either common features used in chemistry instrumentation or a unique method of automating a step in a procedure. None of the representative instruments is completely described, but rather the important components are described in the text as examples.
Specimen Preparation and Identification
Preparation of the sample for analysis has been and remains a manual process in most laboratories. The clotting time (if using serum), centrifugation, and the transferring of the sample to an analyzer cup (unless using primary tube sampling) cause delay and expense in the testing process. One alternative to manual preparation is to automate this process by using robotics, or front-end automation, to “handle” the specimen through these steps and load the specimen onto the analyzer. Another option is to bypass the specimen preparation altogether by using whole blood for analysis— for example, Abbott-Vision. Robotics for specimen preparation has already become a reality in some clinical laboratories in the United States and other countries. Another approach is to use a plasma separator tube and perform primary tube sampling with heparin plasma. This eliminates the need both to wait for the sample to clot and to aliquot the sample. More discussion about preanalytic specimen processing, or front-end automation, appears later in this chapter.
The sample must be properly identified, and its location in the analyzer must be monitored throughout the test. The simplest means of identifying a sample is by placing a manually labeled sample cup in a numbered analysis position on the analyzer, in accordance with a manually prepared worksheet or a computer-generated load list. The most sophisticated approach that is commonly used today employs a bar code label affixed to the primary collection tube. This label contains patient demographics and also may include test requests.
The bar code–labeled tubes are then transferred to the loading zone of the analyzer, where the bar code is scanned and the information is stored in the computer’s memory. The analyzer is then capable of monitoring all functions of identification, test orders and parameters, and sample position. Certain analyzers may take test requests downloaded from the laboratory information system (LIS) and run them when the appropriate sample is identified and ready to be pipetted.
Specimen Measurement and Delivery
Most instruments use either circular carousels or rectangular racks as specimen containers for holding disposable sample cups or primary sample tubes in the loading or pipetting zone of the analyzer. These cups or tubes hold standards, controls, and patient specimens to be pipetted into the reaction chambers of the analyzers. The slots in the trays or racks are usually numbered to aid in sample identification. The trays or racks move automatically in one-position steps at preselected speeds. The speed determines the number of specimens to be analyzed per hour. As a convenience, the instrument can determine the slot number containing the last sample and terminate the analysis after that sample. The instrument’s microprocessor holds the number of samples in memory and aspirates only in positions containing samples.
On the VITROS analyzer, sample cup trays are quadrants that hold 10 samples each in cups with conical bottoms. The four quadrants fit on a tray carrier (Fig. 7.2). Although the tray carrier accommodates only 40 samples, more trays of samples can be programmed and then loaded in place of completed trays while tests on other trays are in progress. A disposable sample tip is hand loaded adjacent to each sample cup on the tray. Roche/Hitachi analyzers can use five-position racks to hold samples (Fig. 7.3). A modular analyzer can accommodate as many as 60 of these racks at one time.
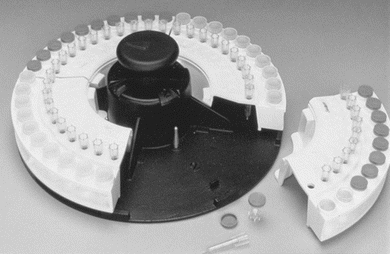
FIGURE 7.2 VITROS. The four quadrant trays, each holding ten samples, fit on a tray carrier. (Photograph courtesy of Ortho-Clinical Diagnostics.)
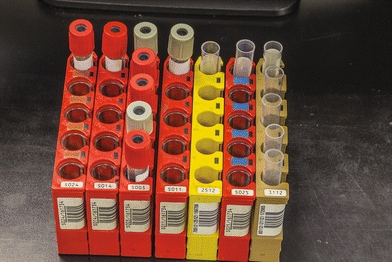
FIGURE 7.3 Roche/Hitachi five-position rack.
Nearly all contemporary chemistry analyzers sample from primary collection tubes, or for limited volume samples, there are microsample tubes. The tubes are placed in either racks or carousels. Bar code labels for each sample, which include the patient name and identification number, can be printed on demand by the operator (Fig. 7.4). This allows samples to be loaded in any order. The Dimension analyzers make use of a continuous belt of flexible, disposable plastic cuvettes carried through the analyzer’s water bath on a main drive track. The cuvettes are loaded onto the analyzer from a continuous spool. These cuvettes index through the instrument at the rate of one every 5 seconds and are cut into sections or groups as required. A schematic of the Dimension RxL cuvette production and reading system is shown in Figure 7.5. Exposure of the sample to air can lead to sample evaporation and produce errors in analysis. Evaporation of the sample may be significant and may cause the concentration of the constituents being analyzed to rise 50% in 4 hours.7 Instruments measuring electrolytes, the carbon dioxide present in the samples, will be lost to the atmosphere, resulting in low carbon dioxide values. Manufacturers have devised a variety of mechanisms to minimize this effect—for example, lid covers for trays and individual caps that can be pierced, which includes closed-tube sampling from primary collection tubes.8
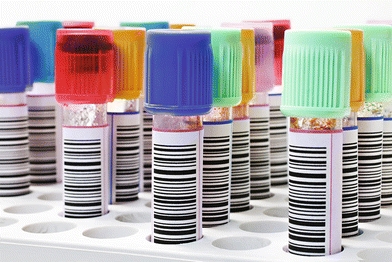
FIGURE 7.4 Sample collection tubes are identified with bar code labels. (Photograph courtesy of Siemens.)
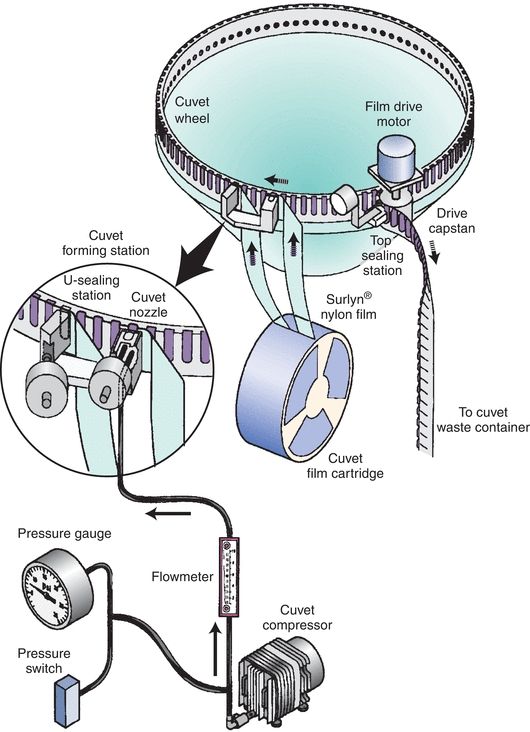
FIGURE 7.5 Analyzer production system for sealed cuvettes. (Photograph courtesy of Siemens.)
The actual measurement of each aliquot for each test must be accurate. This is generally accomplished through aspiration of the sample into a probe. When the discrete instrument is in operation, the probe automatically dips into each sample cup and aspirates a portion of the liquid. After a preset, computer-controlled time interval, the probe quickly rises from the cup. Sampling probes on instruments using specific sampling cups are programmed or adjusted to reach a prescribed depth in those cups to maximize the use of available sample. Those analyzers capable of aspirating sample from primary collection tubes usually have a parallel liquid level–sensing probe that will control entry of the sampling probe to a minimal depth below the surface of the serum, allowing full aliquot aspiration while avoiding clogging of the probe with serum separator gel or clot (Fig. 7.6).
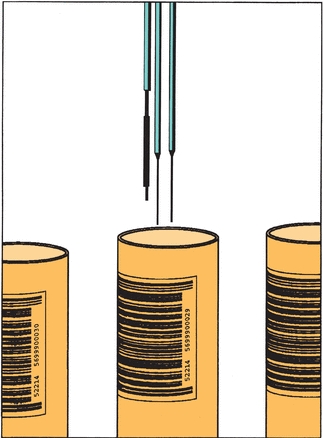
FIGURE 7.6 Dual sample probes of a chemistry analyzer. Note the liquid level sensor to the left of probes. (Photograph courtesy of Roche Diagnostics.)
In continuous flow analyzers, when the sample probe rises from the cup, air is aspirated for a specified time to produce a bubble in between sample and reagent plugs of liquid. Then the probe descends into a container where wash solution is drawn into the probe and through the system. The wash solution is usually deionized water, possibly with a surfactant added. Remembering that all samples follow the same reaction path, the necessity for the wash solution between samples becomes obvious. Immersion of the probe into the wash reservoir cleanses the outside, whereas aspiration of an aliquot of solution cleanses the lumen. The reservoir is continually replenished with an excess of fresh solution. The wash aliquot, plus the previously mentioned air bubble, maintains sample integrity and minimizes sample carryover.
Certain pipetters use a disposable tip and an air displacement syringe to measure and deliver reagent. When this is used, the pipetter may be reprogrammed to measure sample and reagent for batches of different tests comparatively easily. Besides eliminating the effort of priming the reagent delivery system with the new solution, no reagent is wasted or contaminated because nothing but the pipette tip contacts it.
The cleaning of the probe and tubing after each dispensing to minimize the carryover of one sample into the next is a concern for many instruments. In some systems, the reagent or diluent is also dispersed into the cuvette through the same tubing and probe. Deionized water may be dispensed into the cuvette after the sample to produce a specified dilution of the sample and also to rinse the dispensing system. In the Technicon RA1000, a random access fluid is the separation medium. The fluorocarbon fluid is a viscous, inert, immiscible, nonwetting substance that coats the delivery system. The coating on the sides of the delivery system prevents carryover due to the wetting of the surfaces and, forming a plug of the solution between samples, prevents carryover by diffusion. A small amount (10 μL) of this fluid is dispensed into the cuvette with the sample. Surface tension leaves a coating of the fluid in the dispensing system.
If a separate probe or tip is used for each sample and discarded after use, as in the VITROS, the issue of carryover is a moot point. VITROS has a unique sample dispensing system. A proboscis presses into a tip on the sample tray, picks it up, and moves over the specimen to aspirate the volume required for the tests programmed for that sample. The tip is then moved over to the slide-metering block. When a slide is in position to receive an aliquot, the proboscis is lowered so that a dispensed 10-μL drop touches the slide, where it is absorbed from the nonwetting tip. A stepper motor-driven piston controls aspiration and drop formation. The precision of dispensing is specified at ±5%.
In several discrete systems, the probe is attached by means of nonwettable tubing to precision syringes. The syringes draw a specified amount of sample into the probe and tubing. Then the probe is positioned over a cuvette and the sample is dispensed. The Hitachi 736 used two sample probes to simultaneously aspirate a double volume of sample in each probe immersed in one specimen container and, thereby, deliver sample into four individual test channels, all in one operational step (Fig. 7.7). The loaded probes pass through a fine mist shower bath before delivery to wash off any sample residue adhering to the outer surface of the probes. After delivery, the probes move to a rinse bath station for cleaning the inside and outside surfaces of the probes.
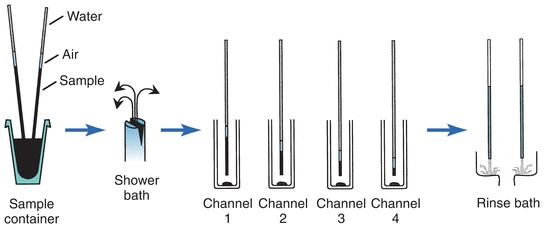
FIGURE 7.7 Sampling operation of the Hitachi 736 analyzer. (Courtesy of Roche Diagnostics.)
Many chemistry analyzers use computer-controlled stepping motors to drive both the sampling and washout syringes. Every few seconds, the sampling probe enters a specimen container, withdraws the required volume, moves to the cuvette, and dispenses the aliquot with a volume of water to wash the probe. The washout volume is adjusted to yield the final reaction volume. If a procedure’s range of linearity is exceeded, the system will retrieve the original sample tube, repeat the test using one-fourth the original sample volume for the repeat test, and calculate a new result, taking the dilution into consideration.
Economy of sample size is a major consideration in developing automated procedures, but methodologies have limitations to maintain proper levels of sensitivity and specificity. The factors governing sample and reagent measurement are interdependent. Generally, if sample size is reduced, then either the size of the reaction cuvette and final reaction volume must be decreased or the reagent concentration must be increased to ensure sufficient color development for accurate photometric readings.
Reagent Systems and Delivery
Reagents may be classified as liquid or dry systems for use with automated analyzers. Liquid reagents may be purchased in bulk volume containers or in unit dose packaging as a convenience for stat testing on some analyzers. Dry reagents are packaged in various forms. They may be bottled as lyophilized powder, which requires reconstitution with water or a buffer. Unless the manufacturer provides the diluent, the water quality available in the laboratory is important. A second and unique type of dry reagent is the multilayered dry chemistry slide for the VITROS analyzer (rebranded in 2001 as the VITROS MicroSlide technology). These slides have microscopically thin layers of dry reagents mounted on a plastic support. The slides are approximately the size and thickness of a postage stamp.
Reagent handling varies according to instrument capabilities and methodologies. Many test procedures use sensitive, short-lived working reagents; so contemporary analyzers use a variety of techniques to preserve them. One technique is to keep all reagents refrigerated until the moment of need and then quickly preincubate them to reaction temperature or store them in a refrigerated compartment on the analyzer that feeds directly to the dispensing area. Another means of preservation is to provide reagents in a dried, tablet form and reconstitute them when the test is to be run. A third is to manufacture the reagent in two stable components that will be combined at the moment of reaction. If this approach is used, the first component also may be used as a diluent for the sample. The various manufacturers often use combinations of these reagent-handling techniques.
Reagents also must be dispensed and measured accurately. Many instruments use bulk reagents to decrease the preparation and changing of reagents. Instruments that do not use bulk reagents have unique reagent packaging. In continuous flow analyzers, reagents and diluents are supplied from bulk containers into which tubing is suspended. The inside diameter, or bore, of the tubing governs the amount of fluid that will be dispensed. A proportioning pump, along with a manifold, continuously and precisely introduces, proportions, and pumps liquids and air bubbles throughout the continuous flow system.
To deliver reagents, many discrete analyzers use techniques similar to those used to measure and deliver the samples. Syringes, driven by a stepping motor, pipette the reagents into reaction containers. Piston-driven pumps, connected by tubing, may also dispense reagents. Another technique for delivering reagents to reaction containers uses pressurized reagent bottles connected by tubing to dispensing valves. The computer controls the opening and closing of the valves. The fill volume of reagent into the reaction container is determined by the precise amount of time the valve remains open.
The Vitros analyzers use slides to contain their entire reagent chemistry system. Multiple layers on the slide are backed by a clear polyester support. The coating itself is sandwiched in a plastic mount. There are three or more layers: (1) a spreading layer, which accepts the sample; (2) one or more central layers, which can alter the aliquot; and (3) an indicator layer, where the analyte of interest may be quantified (Fig. 7.8). The number of layers varies depending on the assay to be performed. The color developed in the indicator layer varies with the concentration of the analyte in the sample. Physical or chemical reactions can occur in one layer, with the product of these reactions proceeding to another layer, where subsequent reactions can occur. Each layer may offer a unique environment and the possibility to carry out a reaction comparable to that offered in a chemistry assay or it may promote an entirely different activity that does not occur in the liquid phase. The ability to create multiple reaction sites allows the possibility of manipulating and detecting compounds in ways not possible in solution chemistries. Interfering materials can be left behind or altered in upper layers.
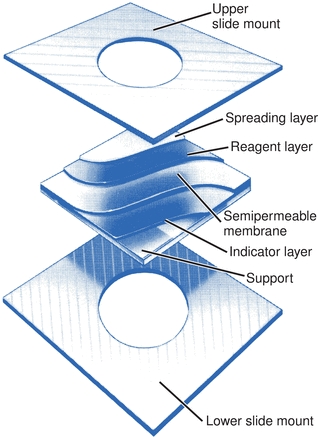
FIGURE 7.8 VITROS slide with multiple layers contains the entire reagent chemistry system. (Courtesy of Ortho-Clinical Diagnostics.)
Chemical Reaction Phase
This phase consists of mixing, separation, incubation, and reaction time. In most discrete analyzers, the chemical reactants are held in individual moving containers that are either disposable or reusable. These reaction containers also function as the cuvettes for optical analysis. If the cuvettes are reusable, then wash stations are set up immediately after the read stations to clean and dry these containers (Fig. 7.9). This arrangement allows the analyzer to operate continuously without replacing cuvettes. Examples of this approach include ADVIA Centaur (Siemens), ARCHITECT (Abbott Diagnostics), Cobas (Roche Diagnostics), and UniCel DxC Synchron (Beckman Coulter) analyzers. Alternatively, the reactants may be placed in a stationary reaction chamber in which a flow-through process of the reaction mixture occurs before and after the optical reading.
FIGURE 7.9 Wash stations on a chemistry analyzer perform the following: (1) aspirate reaction waste and dispense water, (2) aspirate and dispense rinse water, (3) aspirate rinse water and dispense water for measurement of cell blank, and (4) aspirate cell blank water to dryness. (Photograph courtesy of Roche Diagnostics.)
Mixing
A vital component of each procedure is the adequate mixing of the reagents and sample. Instrument manufacturers go to great lengths to ensure complete mixing. Nonuniform mixtures can result in noise in continuous flow analysis and in poor precision in discrete analysis.
Mixing was accomplished in continuous flow analyzers (e.g., the Chem 1) through the use of coiled tubing. When the reagent and sample stream go through coiled loops, the liquid rotates and tumbles in each loop. The differential rate of liquids falling through one another produces mixing in the coil.
RA1000 used a rapid start–stop action of the reaction tray. This causes a sloshing action against the walls of the cuvettes, which mixes the components. Centrifugal analyzers may use a start–stop sequence of rotation or bubbling of air through the sample and reagent to mix them while these solutions are moving from transfer disk to rotor. This process of transferring and mixing occurs in just a few seconds. The centrifugal force is responsible for the mixing as it pushes sample from its compartment, over a partition into a reagent-filled compartment and, finally, into the cuvette space at the perimeter of the rotor.
In the VITROS MicroSlide technology, the spreading layer provides a structure that permits a rapid and uniform spreading of the sample over the reagent layer(s) for even color development.
Most automated wet chemistry analyzers use stirring paddles that dip into the reaction container for a few seconds to stir sample and reagents, after which they return to a wash reservoir (Fig. 7.10). Other instruments use forceful dispensing to accomplish mixing.
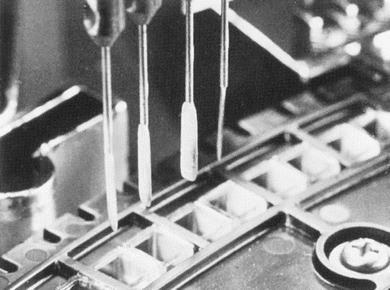
FIGURE 7.10 Stirring paddles on a chemistry analyzer. (Photograph courtesy of Roche Diagnostics.)
Separation
In chemical reactions, undesirable constituents that will interfere with an analysis may need to be separated from the sample before the other reagents are introduced into the system. Protein causes major interference in many analyses. One approach without separating protein is to use a very high reagent-to-sample ratio (the sample is highly diluted) so that any turbidity caused by precipitated protein is not sensed by the spectrophotometer. Another approach is to shorten the reaction time to eliminate slower-reacting interferents.
In the older continuous flow systems, a dialyzer was the separation or filtering module. It performed the equivalent of the manual procedures of precipitation, centrifugation, and filtration, using a fine-pore cellophane membrane. In the VITROS MicroSlide technology, the spreading layer of the slide not only traps cells, crystals, and other small particulate matter but also retains large molecules, such as protein. In essence, what passes through the spreading layer is a protein-free filtrate.
Most contemporary discrete analyzers have no automated methodology by which to separate interfering substances from the reaction mixture. Therefore, methods have been chosen that have few interferences or that have known interferences that can be compensated for by the instrument (e.g., using correction formulas).
Incubation
A heating bath in discrete or continuous flow systems maintains the required temperature of the reaction mixture and provides the delay necessary to allow complete color development. The principal components of the heating bath are the heat transfer medium (i.e., water or air), the heating element, and the thermoregulator. A thermometer is located in the heating compartment of an analyzer and is monitored by the system’s computer. On many discrete analyzer systems, the multicuvettes incubate in a water bath maintained at a constant temperature of usually 37°C.
Slide technology incubates colorimetric slides at 37°C. There is a precondition station to bring the temperature of each slide close to 37°C before it enters the incubator. The incubator moves the slides at 12-second intervals in such a manner that each slide is at the incubator exit four times during the 5-minute incubation time. This feature is used for two-point rate methods and enables the first point reading to be taken part way through the incubation time. Potentiometric slides are held at 25°C. The slides are kept at this temperature for 3 minutes to ensure stability before reading.
Reaction Time
Before the optical reading by the spectrophotometer, the reaction time may depend on the rate of transport through the system to the “read” station, timed reagent additions with moving or stationary reaction chambers, or a combination of both processes. An environment conducive to the completion of the reaction must be maintained for a sufficient length of time before spectrophotometric analysis of the product is made. Time is a definite limitation. To sustain the advantage of speedy multiple analyses, the instrument must produce results as quickly as possible.
It is possible to monitor not only completion of a reaction but also the rate at which the reaction is proceeding. The instrument may delay the measurement for a predetermined time or may present the reaction mixtures for measurement at constant intervals of time. Use of rate reactions may have two advantages: the total analysis time is shortened and interfering chromogens that react slowly may be negated. Reaction rate is controlled by temperature; therefore, the reagent, timing, and spectrophotometric functions must be coordinated to work in harmony with the chosen temperature. The environment of the cuvettes is maintained at a constant temperature by a liquid bath, containing water or some other fluid with good heat transfer properties, in which the cuvettes move.
Measurement Phase
After the reaction is completed, the formed products must be quantified. Almost all available systems for measurement have been used, such as ultraviolet, fluorescent, and flame photometry; ion-specific electrodes; gamma counters; and luminometers. Still, the most common is visible and ultraviolet light spectrophotometry, although adaptations of traditional fluorescence measurement, such as fluorescence polarization, chemiluminescence, and bioluminescence, have become popular. The Abbott AxSYM, for example, is a popular instrument for drug analysis that uses fluorescence polarization to measure immunoassay reactions.
Analyzers that measure light require a monochromator to achieve the desired component wavelength. Traditionally, analyzers have used filters or filter wheels to separate light. The old AAs used filters that were manually placed in position in the light path. Many instruments still use rotating filter wheels that are microprocessor controlled so that the appropriate filter is positioned in the light path. However, newer and more sophisticated systems offer the higher resolution afforded by diffraction gratings to achieve light separation into its component colors. Many instruments now use such monochromators with either a mechanically rotating grating or a fixed grating that spreads its component wavelengths onto a fixed array of photo diodes—for example, Hitachi analyzers (Fig. 7.11). This latter grating arrangement, as well as rotating filter wheels, easily accommodates polychromatic light analysis, which offers improved sensitivity and specificity over monochromatic measurement. By recording optical readings at different wavelengths, the instrument’s computer can then use these data to correct for reaction mixture interferences that may occur at adjacent, as well as desired, wavelengths.
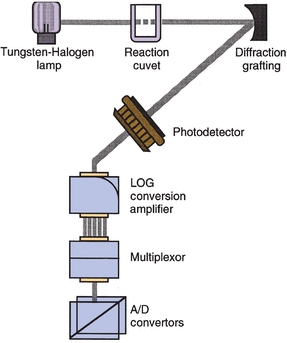
FIGURE 7.11 Photometer for a chemistry analyzer. Fixed diffraction grating separates light into specific wavelengths and reflects them onto a fixed array of 11 specific photodetectors. Photometer has no moving parts. (Courtesy of Roche Diagnostics.)
Stay updated, free articles. Join our Telegram channel

Full access? Get Clinical Tree


