Physical Activity, Fitness, and Health1
Gary R. Hunter
1Abbreviations: ADP, adenosine diphosphate; AEE, activity-related energy expenditure; ATP, adenosine triphosphate; CoA, coenzyme A; H+, hydrogen ion; HDL, high-density lipoprotein; LDH, lactate dehydrogenase; LDL, low-density lipoprotein; MET, metabolic equivalent; NAD, nicotinamide adenine dinucleotide; NADH, reduced nicotinamide adenine dinucleotide; Pi, inorganic phosphate; 31P MRS, phosphorus-31 magnetic resonance spectroscopy; [V with dot above]O2max, maximal oxygen uptake.
This chapter reviews the interactions between exercise training and activity-related energy expenditure (AEE) and the independent effects each has on health maintenance and the risk of disease. Physical training and AEE are related. However, it is possible to expend relatively large amounts of AEE that is of insufficient intensity to create a training effect. Because intense training and AEE are interrelated, separating their effects on health maintenance and risk of disease is difficult. First, both cardiorespiratory fitness and strength fitness have a genetic basis (1), and it is difficult to separate the genetic from the training-induced component of fitness. Second, regular AEE is difficult to measure; most available techniques are either imprecise, restricting free-living involvement, or very expensive. Third, body composition, as well as fat distribution, influences risk of disease but in turn is affected by exercise training and AEE. Before discussing the interactive effects of exercise training and physical activity, some of the early findings that lay the groundwork for our understanding of the physiologic effects of AEE and fitness training are reviewed.
In 1813, the Englishman William Prout showed that carbon dioxide production reached a plateau during moderate-intensity exercise (2). This work introduced the concept of steady-state exercise, that is, exercise in which heart rate and oxygen uptake increase to levels that are then maintained. During the middle of the 19th century, Edward Smith, a British physician, determined the relative carbon dioxide production for doing hard labor and found that carbon dioxide production increased 66% during 7.5 hours of work (2). He also found that urea production did not account for this dramatic increase in carbon dioxide production, a finding suggesting that protein metabolism was not responsible for most of AEE. Two Germans, Adolf Eugen Fick and Johannes Wislicenus, determined that the urea production during mountain climbing was similar to rest and concluded that protein metabolism could not be the primary fuel during work (2). Rose and Himwich (3) first demonstrated the importance of fat as a fuel in 1927 with their description of respiratory quotients.
A.V. Hill’s findings on heat production paved the way for a more comprehensive understanding of energetics during exercise (2). During 1923 and 1924, W.O. Fenn demonstrated that more heat is produced when a muscle is shortened than during static contractions (4). In 1925, Meyerhof linked lactate production to muscle contraction. This finding, coupled with the discovery that adenosine triphosphate (ATP) (5) is used to drive the muscle under normal circumstances, further improved our understanding of energetics during muscle contraction. Finally, the development of Scholander’s micrometer gas analyzer in 1947 allowed measurement of relatively small quantities of carbon dioxide and oxygen in expired gas and provided a tool for measurement of energy expenditure during exercise (2).
Accurate measurement of free-living energy expenditure is problematic. Room calorimeters are capable of measuring energy expenditure and fuel oxidation rates accurately but are too restrictive for true assessment of free-living conditions. Free-living energy expenditure can
be measured relatively accurately by observing the differential disappearance of two stable isotopes (hydrogen, 2H; and oxygen, 18O) from body fluids. This technique was first used for estimation of energy expenditure in mice in 1955 (6). In 1982, Schoeller and van Santen validated the technique in humans (7).
be measured relatively accurately by observing the differential disappearance of two stable isotopes (hydrogen, 2H; and oxygen, 18O) from body fluids. This technique was first used for estimation of energy expenditure in mice in 1955 (6). In 1982, Schoeller and van Santen validated the technique in humans (7).
Understanding of muscle function and structure has increased since the 19th century. Ranvier distinguished red and white muscle fibers in 1873, and Knoll reported variations in muscle fiber size in 1891 (8). Utilization of histochemical and physiologic techniques allowed the identification and description of different muscle fiber types during the first half of the 20th century (8). In 1954, the sliding filament theory of muscle contraction was proposed independently by A.F. Huxley and Niedergerke and by H.E. Huxley and Hanson (5). Development of microscopic methods of analysis in 1936 by Hevesy and Levi and the creation of a special biopsy needle by Bergstrom in 1962 (9) facilitated the study of human skeletal muscle. The advent of phosphorus-31 magnetic resonance spectroscopy (31P MRS) in 1980 by Chance et al (10) allowed study of metabolism during exercise in human muscle in vivo.
DEFINITION OF FITNESS
Because most of the scientific literature concerning the interaction of fitness and wellness is confined to cardiorespiratory endurance (also aerobic fitness) and muscular strength, this chapter focuses on these two components of fitness. Cardiorespiratory fitness is defined as ability of the cardiovascular and respiratory systems to supply oxygen to the working muscles during sustained hard dynamic exercise (11). Cardiorespiratory fitness is normally evaluated by measuring maximal oxygen uptake ([V with dot above]O2max) during a progressive graded exercise test on a treadmill or bicycle ergometer. Muscular strength is defined as the maximum force or tension that can be generated by a muscle and is measured by determining how much weight an individual can lift in a certain movement or by how much force or torque an individual can exert during an isometric (no movement) or isokinetic (constant velocity) contraction.
SUBSTRATE UTILIZATION DURING WORK
A brief review of biochemical energy transfer during exercise follows (12). Cleavage of the terminal phosphate from ATP to adenosine diphosphate (ADP) provides the energy for work in muscle (ATP  ADP + Pi + energy) (Pi is inorganic phosphate). A small amount of ATP is stored in the cell, so intense muscular contractions lasting more than a few milliseconds will require energy sources for replacing phosphate to ADP. The most immediate source of energy for maintaining ATP levels during work is the creatine kinase reaction (ADP + creatine phosphate
  ATP + creatine) and, to a smaller extent, the myokinase reaction (2ADP
  ATP + adenosine monophosphate). Because these reactions occur almost instantaneously, ATP and creatine phosphate are considered to be one high-energy phosphate pool. Although quantitatively more than ATP, only a small amount of creatine phosphate is stored in muscle. Therefore, muscular contractions that continue for more than a few seconds depend on other energy sources for maintaining ATP.
ADP + Pi + energy) (Pi is inorganic phosphate). A small amount of ATP is stored in the cell, so intense muscular contractions lasting more than a few milliseconds will require energy sources for replacing phosphate to ADP. The most immediate source of energy for maintaining ATP levels during work is the creatine kinase reaction (ADP + creatine phosphate ATP + creatine) and, to a smaller extent, the myokinase reaction (2ADP ATP + adenosine monophosphate). Because these reactions occur almost instantaneously, ATP and creatine phosphate are considered to be one high-energy phosphate pool. Although quantitatively more than ATP, only a small amount of creatine phosphate is stored in muscle. Therefore, muscular contractions that continue for more than a few seconds depend on other energy sources for maintaining ATP.The breakdown of glucose or glycogen to pyruvate during glycolysis can supply energy at a somewhat slower rate. The energy yield from glycolysis is relatively small (glucose + Pi + 2ADP + 2NAD+ ↔ 2 pyruvate + 2ATP + 2NADH +2H2O) (NAD is nicotinamide adenine dinucleotide, and NADH is the reduced form of NAD). This process also cannot continue at a high rate longer than a few seconds unless NADH is oxidized (loses its hydrogen ion [H+]). This can occur for a short time by the lactate dehydrogenase (LDH)-catalyzed conversion of pyruvic acid to lactate (pyruvate + NADH + H+  lactate + NAD+). The temporary storage of H+ in this conversion of pyruvate acid to lactate allows disappearance of end products of fast glycolysis. The lactate can rapidly diffuse into the bloodstream, where it can be used by other muscle fibers (especially type I) or heart as a fuel to resynthesize ATP. As the level of lactate and H+ increase in the muscle and blood, however, fatigue ensues, and exercise must slow or stop. Fatigue is probably caused by multiple factors, but investigators believe that increased acidity inactivates enzymes that are involved in energy transfer in muscle. Glycolysis, in which the end product is lactate, is termed anaerobic or fast glycolysis.
lactate + NAD+). The temporary storage of H+ in this conversion of pyruvate acid to lactate allows disappearance of end products of fast glycolysis. The lactate can rapidly diffuse into the bloodstream, where it can be used by other muscle fibers (especially type I) or heart as a fuel to resynthesize ATP. As the level of lactate and H+ increase in the muscle and blood, however, fatigue ensues, and exercise must slow or stop. Fatigue is probably caused by multiple factors, but investigators believe that increased acidity inactivates enzymes that are involved in energy transfer in muscle. Glycolysis, in which the end product is lactate, is termed anaerobic or fast glycolysis.Much more ATP production occurs during aerobic or slow glycolysis. Lactate is not formed because NADH+ is transported to the mitochondria (assuming sufficient mitochondria and oxygen exist in the muscle fiber), thus freeing NAD+ for further reaction during glycolysis. The H+ is used to generate energy during electron transport. Pyruvate is also transported to the mitochondria, where acetyl-coenzyme A (acetyl-CoA) is formed and is used to generate further substrate for electron transport generation of ATP. The complete breakdown of glucose to water and carbon dioxide during slow glycolysis generates 36 to 38 ATP molecules per glucose molecule versus the 2 net ATP molecules generated during anaerobic glycolysis. Aerobic glycolysis is relatively slow, however, and it requires oxygen and high mitochondrial density. During high-intensity exercise such as running a quarter mile, some muscle fibers may be activated that have few mitochondria and insufficient oxygen to complete the oxidation of pyruvate to H2O and carbon dioxide thus increasing the dependence on fast glycolysis. Figure 112.1 illustrates the relative estimated contributions of energy systems for endurance events of different duration.
Fat oxidation also occurs in skeletal muscle during muscle contractions. Both intracellular triglyceride and triglyceride from fat cells are sources of fatty acids. After entering the mitochondria, fatty acids are broken down in a series of reactions called β-oxidation to numerous
acetyl-CoA and H+ molecules. Many net ATP molecules (147 ATP molecules for an 18-carbon fatty acid) are formed through the Krebs cycle and electron transport.
acetyl-CoA and H+ molecules. Many net ATP molecules (147 ATP molecules for an 18-carbon fatty acid) are formed through the Krebs cycle and electron transport.
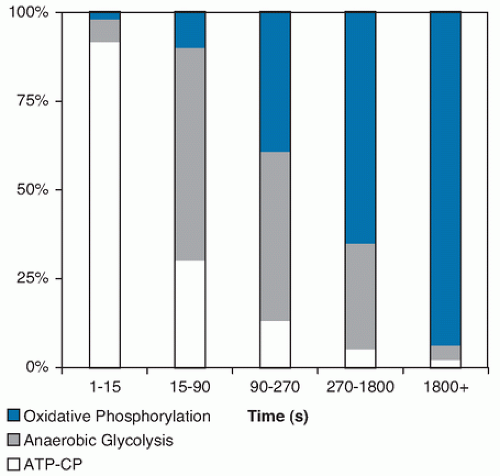 Fig. 112.1. Approximate contributions of different energy systems for endurance events of different duration. ATP-CP, adenosine triphosphate-creatine phosphate. |
From 5% to 15% of energy expended during exercise is obtained from the oxidation of amino acids, especially the amino acids leucine, isoleucine, valine, glutamine, and aspartate. Removal of nitrogen by transamination can occur in both muscle and liver. Once the nitrogen is removed from the amino acid, the remaining “carbon skeleton” is normally similar to one of the reactive compounds that are active in energy transfer. For example, after losing its nitrogen-containing group and gaining a double bond, alanine forms pyruvic acid. Several factors influence the rates of fuel used.
A high-carbohydrate diet increases the storage of glycogen in skeletal muscle and thus increases the rate of use of carbohydrate (2). A diet high in fat augments storage of myocellular lipid and elevates the rate of fat oxidation during exercise (13, 14). Exercise intensity also affects substrate oxidation rates. The more intense the exercise is, the more dependent muscle fibers are on carbohydrate metabolism. For example, an individual consuming a mixed diet would obtain approximately 55% of the energy from oxidation of carbohydrate while running at 65% of [V with dot above]O2max and approximately 85% of energy from oxidation of carbohydrate while running at 80% of [V with dot above]O2max. Exercise training, especially long, slow distance training, increases the ability of skeletal muscle to use fat as a fuel and can have a glycogen-sparing effect in exercise such as the marathon (15). Exercise duration also plays a role, with fat oxidation gradually increasing as exercise duration increases.
TABLE 112.1 TYPICAL FIBER TYPE VARIATIONS | ||||||||||||||||||||||||
|---|---|---|---|---|---|---|---|---|---|---|---|---|---|---|---|---|---|---|---|---|---|---|---|---|
|
MUSCLE FIBER TYPES
Type I and type II muscle fibers have been identified in humans. Type I muscle fibers (slow twitch) have slower contraction velocities but are more fatigue resistant than are type II (fast twitch) fibers. Type I muscle fibers have more mitochondria, oxidative enzyme activity, myoglobin, lipid stores, and capillarization than type II muscle fibers. Type II muscle fibers have greater glycolytic capacity and are capable of greater force or power production. The two main subcategories of type II muscle fiber are type IIa (fast twitch glycolytic oxidative) and type IIx (fast twitch glycolytic). Type IIa muscle fibers have metabolic characteristics more similar to type I muscle fibers, whereas, type IIx fibers depend more on glycolysis for generating ATP.
Type I muscle fiber distribution is related to improved glucose removal and reduced blood pressure, perhaps because of differences in microcirculation (16). In addition, type II muscle fiber distribution and oxidative enzyme activity may possibly be linked to weight gain and obesity (16). Type II muscle fibers also require more ATP to generate force than do type I muscle fibers; this property makes individuals who have more type II muscle fiber less economical during work. Table 112.1 summarizes differences in muscle fiber type.
FORCE GENERATION
Several factors affect force generation. Force production is proportional to the number of myosin cross-bridges that are attached to actin filaments at any time. A greater amount of calcium ion in a myofibril (domain within muscle fiber containing contractile components myosin and
actin) results in more myosin crossbridge binding to actin filaments and thereby creates more tension within the muscle. The amount of calcium ion released from the sarcoplasmic reticulum is related to how frequently the motor neuron stimulates the muscle. Thus, increased activation of a motor neuron results in increased force developed in that motor neuron’s motor unit (motor neuron and muscle fibers it innervates). Peak force for a motor unit is normally achieved at a neural action potential frequency of approximately 50 Hz (lower frequency for slow motor units and higher frequency for fast motor units). In addition, more force is generated when more motor units are activated.
actin) results in more myosin crossbridge binding to actin filaments and thereby creates more tension within the muscle. The amount of calcium ion released from the sarcoplasmic reticulum is related to how frequently the motor neuron stimulates the muscle. Thus, increased activation of a motor neuron results in increased force developed in that motor neuron’s motor unit (motor neuron and muscle fibers it innervates). Peak force for a motor unit is normally achieved at a neural action potential frequency of approximately 50 Hz (lower frequency for slow motor units and higher frequency for fast motor units). In addition, more force is generated when more motor units are activated.
A larger muscle cross-sectional area increases the number of myosin crossbridge heads available to bind with actin filaments and the potential for maximum force production. Anatomic structure can also influence force production. Maximal force is measured at the end of a lever system (e.g., the hand during an arm curl). The ratio of the length of levers and attachment point of the tendon to bone (e.g., forearm length to elbow’s axis of rotation in relation to distance of attachment of the biceps brachii to the axis of rotation) affects force applied at the end of the lever system.
Other factors affect maximal force production, including angle of muscle pennation (pennate muscle fibers extend at an angle from the tendon as the barbs do from a feather). A more acute pennation angle increases force. Fiber type also influences strength and power production. Type II muscle fibers have greater strength and power potential than do type I muscle fibers. Because creatine kinase activity and myokinase activity are related to strength independent of muscle size, and because both seem to be increased in strength-trained individuals, highenergy phosphate availability in the myofibril probably can be limiting to expression of maximal force (17).
Stay updated, free articles. Join our Telegram channel

Full access? Get Clinical Tree


