Chapter Six
Pharmacoeconomics
Learning Objectives
After completing this chapter, the reader will be able to
• Describe the four types of pharmacoeconomic analysis: cost-minimization analysis (CMA), cost-benefit analysis (CBA), cost-effectiveness analysis (CEA), and cost-utility analysis (CUA).
• Describe the advantages and disadvantages of the different types of pharmacoeconomic analyses.
• List and explain the 10 steps that should be found in a well-conducted pharmacoeconomic study.
• List the six steps in a decision analysis.
• Give examples of the application of the pharmacoeconomic evaluation techniques to the formulary decision process, including decision analysis.
• Apply a systematic approach to the evaluation of the pharmacoeconomic literature.
![]()
Key Concepts
![]() Pharmacoeconomics has been defined as the description and analysis of the costs of drug therapy to health care systems and society—it identifies, measures, and compares the costs and consequences of pharmaceutical products and services.
Pharmacoeconomics has been defined as the description and analysis of the costs of drug therapy to health care systems and society—it identifies, measures, and compares the costs and consequences of pharmaceutical products and services.
![]() Pharmacoeconomic studies categorize costs into four types: direct medical, direct non-medical, indirect, and intangible.
Pharmacoeconomic studies categorize costs into four types: direct medical, direct non-medical, indirect, and intangible.
![]() Perspective is a pharmacoeconomic term that describes whose costs are relevant based on the purpose of the study.
Perspective is a pharmacoeconomic term that describes whose costs are relevant based on the purpose of the study.
![]() There are four ways to measure outcomes: cost-minimization analysis (CMA), cost-benefit analysis (CBA), cost-effectiveness analysis (CEA), and cost-utility analysis (CUA). Each type of outcome management is associated with a different type of pharmacoeconomic analysis.
There are four ways to measure outcomes: cost-minimization analysis (CMA), cost-benefit analysis (CBA), cost-effectiveness analysis (CEA), and cost-utility analysis (CUA). Each type of outcome management is associated with a different type of pharmacoeconomic analysis.
![]() There are two common methods that economists use to estimate a value for health-related consequences, the human capital approach and the willingness-to-pay approach.
There are two common methods that economists use to estimate a value for health-related consequences, the human capital approach and the willingness-to-pay approach.
![]() A CUA takes patient preferences, also referred to as utilities, into account when measuring health consequences.
A CUA takes patient preferences, also referred to as utilities, into account when measuring health consequences.
![]() All four types of analyses described (CMA, CBA, CEA, and CUA) should follow 10 general steps.
All four types of analyses described (CMA, CBA, CEA, and CUA) should follow 10 general steps.
![]() A sensitivity analysis allows one to determine how the results of an analysis would change when these best guesses or assumptions are varied over a relevant range of values.
A sensitivity analysis allows one to determine how the results of an analysis would change when these best guesses or assumptions are varied over a relevant range of values.
![]() Decision analysis is the application of an analytical method for systematically comparing different decision options. Decision analysis graphically displays choices and performs the calculations needed to compare these options.
Decision analysis is the application of an analytical method for systematically comparing different decision options. Decision analysis graphically displays choices and performs the calculations needed to compare these options.
Introduction
Many changes have recently taken place in health care. The continued introduction of new technologies, including many new drugs, has been among these changes. During 2012, over 150 new drugs formulations were approved by the Food and Drug Administration (FDA).1 New biotechnology drugs can cost over $10,000 per course of therapy. The increase in the number of new drugs combined with the increase in costs of drugs provides a great challenge for all health care. The new organizations created by the Affordable Care Act to provide access to health care insurance for Americans, in addition to existing managed care organizations (MCOs), all desire to deliver quality care while minimizing costs.2
Pharmacy and therapeutics (P&T) committees are responsible for evaluating these new drugs and determining their potential value to organizations. Evaluating drugs for formulary inclusion can often be an overwhelming task. The application of pharmacoeconomic methods to the evaluation process may help streamline formulary decisions.
This chapter presents an overview of the practical application of pharmacoeconomic principles as they apply to the formulary decision process. Students and health professionals are often asked to gather and evaluate literature to support the decision process.
Pharmacoeconomics: What Is It and Why Do It?
![]() Pharmacoeconomics has been defined as the description and analysis of the costs of drug therapy to health care systems and society—it identifies, measures, and compares the costs and consequences of pharmaceutical products and services.3 Decision makers can use these methods to evaluate and compare the total costs of treatment options and the outcomes associated with these options. To show this graphically, think of two sides of an equation: (1) the inputs (costs) used to procure and use the drug and (2) the health-related outcomes (see Figure 6–1).
Pharmacoeconomics has been defined as the description and analysis of the costs of drug therapy to health care systems and society—it identifies, measures, and compares the costs and consequences of pharmaceutical products and services.3 Decision makers can use these methods to evaluate and compare the total costs of treatment options and the outcomes associated with these options. To show this graphically, think of two sides of an equation: (1) the inputs (costs) used to procure and use the drug and (2) the health-related outcomes (see Figure 6–1).
![]()
Figure 6–1. The pharmacoeconomic equation.
The center of the equation, the drug product, is symbolized by Rx. If only the left-hand side of the equation is measured without regard for outcomes, this is a cost analysis (or a partial economic analysis). If only the right-hand side of the equation is measured without regard to costs, this is a clinical or outcome study (not an economic analysis). In order to be a true pharmacoeconomic analysis, both sides of the equation must be considered and compared.
Relationships of Pharmacoeconomics to Outcomes Research
Outcomes research is defined as an attempt to identify, measure, and evaluate the end results of health care services. It may include not only clinical and economic consequences, but also outcomes such as patient health status and satisfaction with their health care. Pharmacoeconomics is a type of outcomes research, but not all outcomes research is pharmacoeconomic research.4
Models of Pharmacoeconomic Analysis
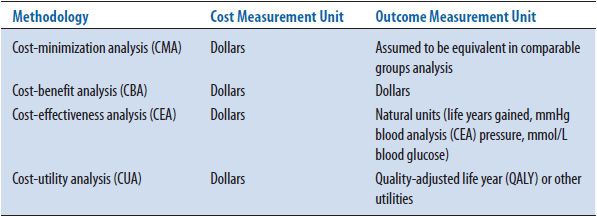
The four types of pharmacoeconomic analyses all follow the diagram shown in Figure 6–1; they measure costs or inputs in dollars and assess the outcomes associated with these costs. Pharmacoeconomic analyses are categorized by the method used to assess outcomes. If the outcomes are assumed to be equivalent, the study is called a cost-minimization analysis (CMA); if the outcomes are measured in dollars, the study is called a cost-benefit analysis (CBA); if the costs are measured in natural units (e.g., cures, years of life, blood pressure), the study is called a cost-effectiveness analysis (CEA); if the outcomes take into account patient preferences (or utilities), the study is called a cost-utility analysis (CUA) (Table 6–1). Each type of analysis includes a measurement of costs in dollars. Assessment of these costs is discussed first, followed by further examples of how outcomes are measured for these four types of studies.
TABLE 6–1. FOUR TYPES OF PHARMACOECONOMIC ANALYSIS
Assessment of Costs
First, the assessment of costs (the left-hand side of the equation) will be discussed. A discussion of the four types of costs and timing adjustments for costs follows.
TYPES OF COSTS
Costs are calculated to estimate the resources (or inputs) that are used in the production of an outcome. ![]() Pharmacoeconomic studies categorize costs into four types. Direct medical costs are the most obvious costs to measure. These are the medically related inputs used directly in providing the treatment. Examples of direct medical costs would include costs associated with pharmaceutical products, physician visits, emergency room visits, and hospitalizations. Direct nonmedical costs are costs directly associated with treatment, but are not medical in nature. Examples include the cost of traveling to and from the physician’s office or hospital, babysitting for the children of a patient, and food and lodging required for patients and their families during out-of-town treatment. Indirect costs involve costs that result from the loss of productivity due to illness or death. Please note that the accounting term indirect costs, which is used to assign overhead, is different from the economic term, which refers to a loss of productivity of the patient or the patient’s family due to illness. Intangible costs include the costs of pain, suffering, anxiety, or fatigue that occur because of an illness or the treatment of an illness. It is difficult to measure or assign values to intangible costs.
Pharmacoeconomic studies categorize costs into four types. Direct medical costs are the most obvious costs to measure. These are the medically related inputs used directly in providing the treatment. Examples of direct medical costs would include costs associated with pharmaceutical products, physician visits, emergency room visits, and hospitalizations. Direct nonmedical costs are costs directly associated with treatment, but are not medical in nature. Examples include the cost of traveling to and from the physician’s office or hospital, babysitting for the children of a patient, and food and lodging required for patients and their families during out-of-town treatment. Indirect costs involve costs that result from the loss of productivity due to illness or death. Please note that the accounting term indirect costs, which is used to assign overhead, is different from the economic term, which refers to a loss of productivity of the patient or the patient’s family due to illness. Intangible costs include the costs of pain, suffering, anxiety, or fatigue that occur because of an illness or the treatment of an illness. It is difficult to measure or assign values to intangible costs.
Treatment of an illness may include all four types of costs. For example, the cost of surgery would include the direct medical costs of the surgery (medication, room charges, laboratory tests, and physician services), direct nonmedical costs (travel and lodging for the preoperative day), indirect costs (cost due to the patient missing work during the surgery and recuperative period), and intangible costs (due to pain and anxiety). Most studies only report the direct medical costs. This may be appropriate depending on the objective or perspective of the study. For example, if the objective is to measure the costs to the hospital for two surgical procedures that differ in direct medical costs (e.g., using high-dose versus low-dose aprotinin in cardiac bypass surgery), but that are expected to have similar nonmedical, indirect, and intangible costs, measuring all four types of costs may not be warranted.
In order to determine what costs are important to measure, the perspective of the study must be determined. ![]() Perspective is a pharmacoeconomic term that describes whose costs are relevant based on the purpose of the study. Economic theory suggests that the most appropriate perspective is that of society. Societal costs would include costs to the insurance company, costs to the patient, and indirect costs due to the loss of productivity. Although this may be the most appropriate perspective according to economic theory, it is rarely seen in the pharmacoeconomic literature. The most common perspectives used in pharmacoeconomic studies are the perspective of the institution or the perspective of the payer. The payer perspective may include the costs to the third-party plan, the patient, or a combination of the patient copay and the third-party plan costs.
Perspective is a pharmacoeconomic term that describes whose costs are relevant based on the purpose of the study. Economic theory suggests that the most appropriate perspective is that of society. Societal costs would include costs to the insurance company, costs to the patient, and indirect costs due to the loss of productivity. Although this may be the most appropriate perspective according to economic theory, it is rarely seen in the pharmacoeconomic literature. The most common perspectives used in pharmacoeconomic studies are the perspective of the institution or the perspective of the payer. The payer perspective may include the costs to the third-party plan, the patient, or a combination of the patient copay and the third-party plan costs.
TIMING ADJUSTMENTS FOR COSTS
When costs are estimated from information collected for more than a year before the study or for more than a year into the future, adjustment of costs is needed. If retrospective data are used to assess resources used over a number of years, these costs should be adjusted to the present year. For example, if the objective of the study is to estimate the difference in the costs of antibiotic A versus B in the treatment of a specific type of infection, information on the past utilization of these two antibiotics might be collected from a review of medical records. If the retrospective review of these medical records dates back for more than 1 year, it may be necessary to adjust the cost of both medications by calculating the number of units (doses) used per case and multiplying this number by the current unit cost for each medication.
If costs are estimated based on dollars spent or saved in future years, another type of adjustment, called discounting, is needed. There is a time value associated with money. Most people (and businesses) prefer to receive money today, rather than at a later time. Therefore, a dollar received today is worth more than a dollar received next year—the time value of money. Discount rate, a term from finance, approximates the cost of capital by taking into account the projected inflation rate and the interest rates of borrowed money and then estimates the time value of money. From this parameter, the present value (PV) of future expenditures and savings can be calculated. The discount factor is equal to 1/(1 + r)n, where r is the discount rate and n is the year in which the cost or savings occur. For example, if the costs of a new pharmaceutical care program are $5000 per year for the next 3 years, and the discount rate is 5%, the present value (PV) of these costs is $14,297 ($5000 year one + $5000/1.05 year two + $5000/[1.05]2 year three) (note that discounting does not start until year two). The most common discount rates currently seen in the literature are 3% to 5%, the approximate cost of borrowing money today.
Assessment of Outcomes
The methods associated with measuring outcomes (the right-hand side of the equation) will be discussed in this section. ![]() As shown in Table 6–1, there are four ways to measure outcomes: CMA, CBA, CEA, and CUA. Each type of outcome measurement is associated with a different type of pharmacoeconomic analysis. The advantages and disadvantages of each type of analysis will be discussed in this section.
As shown in Table 6–1, there are four ways to measure outcomes: CMA, CBA, CEA, and CUA. Each type of outcome measurement is associated with a different type of pharmacoeconomic analysis. The advantages and disadvantages of each type of analysis will be discussed in this section.
COST-MINIMIZATION ANALYSIS
For a CMA, costs are measured in dollars, and outcomes are assumed to be equivalent. One example of a CMA is the measurement and comparison of costs for two therapeutically equivalent products, such as glipizide and glyburide.5 Another example is the measurement and comparison of using prostaglandin E2 on an inpatient versus an outpatient basis.6 In both cases, all the outcomes (e.g., efficacy, incidence of adverse drug interactions) are expected to be equal, but the costs are not. Some researchers contend that a CMA is not a true pharmacoeconomic study, because costs are measured, but outcomes are not. Others say that the strength of a CMA depends on the evidence that the outcomes are the same. This evidence can be based on previous studies, publications, FDA data, or expert opinion. The advantage of this type of study is that it is relatively simple compared to the other types of analyses because outcomes need not be measured. The disadvantage of this type of analysis is that it can only be used when outcomes are assumed to be identical.
Examples
A hospital needs to decide if it should add a new intravenous antibiotic to the formulary, which is therapeutically equivalent to the current antibiotic used in the institution and has the same adverse event profile. The advantage of the new antibiotic is that it only has to be administered once per day versus three times a day for the comparison antibiotic. Because the outcomes are expected to be nearly identical, and the objective is to assess the costs to the hospital (e.g., the hospital perspective), only direct medical costs need to be estimated and compared. The direct medical costs include the daily costs of each medication, the pharmacy personnel time used in the preparation of each dose, and the nursing personnel time used in the administration of each dose. Even if the cost of the new medication is a little higher than the cost of the current antibiotic, the lower cost of preparing and administering the new drug (once a day versus three times per day) may offset this difference. Direct nonmedical, indirect, and intangible costs are not expected to differ between these two alternatives and they need not be included if the perspective is that of the hospital, so these costs are not included in the comparison.
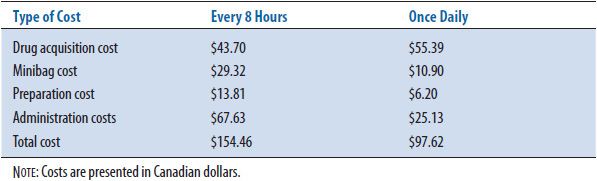
Mithani and Brown7 examined once-daily intravenous administration of an aminoglycoside versus the conventional every 8-hour administration (Table 6–2). The drug acquisition cost was in Canadian dollars ($Can) 43.70 for every 8 hours dosing, and $Can 55.39 for the single dose administration. Not including laboratory drug level measurements, the costs of the intravenous bag ($Can 29.32), preparation ($Can 13.81), and administration ($Can 67.63) were $Can 110.76 for the three-times daily administration versus $Can 42.23 (intravenous bag $Can 10.90, preparation $Can 6.20, and administration $Can 25.13) for the single daily dose. With essentially equivalent clinical outcomes, the once-daily administration of the aminoglycoside minimized hospital costs ($Can 97.62 versus $Can 154.46).
TABLE 6–2. EXAMPLE OF COST MINIMIZATION
COST-BENEFIT ANALYSIS
A CBA measures both inputs and outcomes in monetary terms. One advantage to using a CBA is that alternatives with different outcomes can be compared, because each outcome is converted to the same unit (dollars). For example, the costs (inputs) of providing a pharmacokinetic service versus a diabetes clinic can be compared with the cost savings (outcomes) associated with each service, even though different types of outcomes are expected for each alternative. Many CBAs are performed to determine how institutions can best spend their resources to produce monetary benefits. For example, a study conducted at Walter Reed Army Medical Center looked at costs and savings associated with the addition of a pharmacist to its medical teams.8 Discounting of both the costs of the treatment or services and the benefits or cost savings is needed if they extend for more than a year. Comparing costs and benefits (outcomes in monetary terms) is accomplished by using one of two methods. One method divides the estimated benefits by the estimated costs to produce a benefit-to-cost ratio. If this ratio is more than 1, the choice is cost beneficial. The other method is to subtract the costs from the benefits to produce a net benefit calculation. If this difference is positive, the choice is cost beneficial. The example at the end of this section will use both methods for illustrative purposes.
Another more complex use of CBA consists of measuring clinical outcomes (e.g., avoidance of death, reduction of blood pressure, and reduction of pain) and placing a dollar value on these clinical outcomes. This type of CBA is not often seen in the pharmacy literature, but will be discussed here briefly. This use of the method still offers the advantage that alternatives with different types of outcomes can be assessed, but a disadvantage is that it is difficult to put a monetary value on pain, suffering, and human life. ![]() There are two common methods that economists use to estimate a value for these health-related consequences: the human capital (HC) approach and the willingness-to-pay (WTP) approach. The HC approach assumes that the values of health benefits are equal to the economic productivity that they permit. The cost of disease is the cost of the lost productivity due to the disease. A person’s expected income before taxes and/or an inputted value for nonmarket activities (e.g., housework and child care) is used as an estimate of the value of any health benefits for that person. The HC approach was used when calculating the costs and benefits of administering a meningococcal vaccine to college students. The value of the future productivity of a college student was estimated at $1 million in this study.9 There are disadvantages to using this method. People’s earnings may not reflect their true value to society, and this method lacks a solid literature of research to back this notion. The WTP method estimates the value of health benefits by estimating how much people would pay to reduce their chance of an adverse health outcome. For example, if a group of people is willing to pay, on average, $100 to reduce their chance of dying from 1:1000 to 1:2000, theoretically a life would be worth $200,000 [$100/(0.001–0.0005)]. Problems with this method include the issue that what people say they are willing to pay may not correspond to what they actually would pay, and it is debatable if people can meaningfully answer questions about a 0.0005 reduction in outcomes.
There are two common methods that economists use to estimate a value for these health-related consequences: the human capital (HC) approach and the willingness-to-pay (WTP) approach. The HC approach assumes that the values of health benefits are equal to the economic productivity that they permit. The cost of disease is the cost of the lost productivity due to the disease. A person’s expected income before taxes and/or an inputted value for nonmarket activities (e.g., housework and child care) is used as an estimate of the value of any health benefits for that person. The HC approach was used when calculating the costs and benefits of administering a meningococcal vaccine to college students. The value of the future productivity of a college student was estimated at $1 million in this study.9 There are disadvantages to using this method. People’s earnings may not reflect their true value to society, and this method lacks a solid literature of research to back this notion. The WTP method estimates the value of health benefits by estimating how much people would pay to reduce their chance of an adverse health outcome. For example, if a group of people is willing to pay, on average, $100 to reduce their chance of dying from 1:1000 to 1:2000, theoretically a life would be worth $200,000 [$100/(0.001–0.0005)]. Problems with this method include the issue that what people say they are willing to pay may not correspond to what they actually would pay, and it is debatable if people can meaningfully answer questions about a 0.0005 reduction in outcomes.
Example
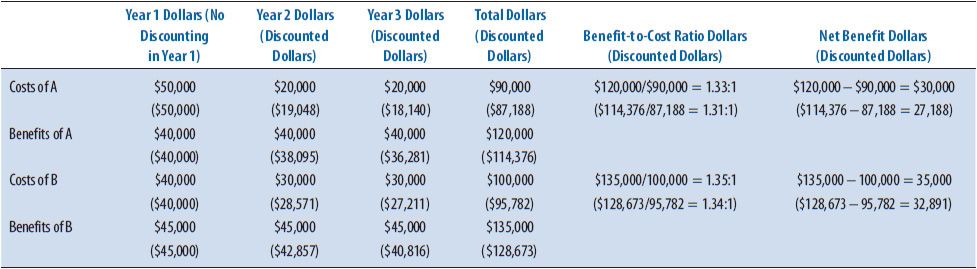
An independent pharmacy owner is considering the provision of a new clinical pharmacy service. The objective of the analysis is to estimate the costs and monetary benefits of two possible services over the next 3 years (Table 6–3). Clinical Service A would cost $50,000 in start-up and operating costs during the first year, and $20,000 in years two and three. Clinical Service A would provide an added revenue of $40,000 each of the 3 years, Clinical Service B would cost $40,000 in start-up and operating costs the first year and $30,000 for years two and three. Clinical Service B would provide added revenue of $45,000 for each of the 3 years. Table 6–3 illustrates the comparison of both options using the perspective of the independent pharmacy with no discounting and when a discount rate of 5% is used. Although both services are estimated to be cost beneficial, Clinical Service B has both a higher benefit-to-cost ratio and a higher net benefit when compared to Clinical Service A.
TABLE 6–3. CBA EXAMPLE CALCULATIONS
COST-EFFECTIVENESS ANALYSIS
This is the most common type of pharmacoeconomic analysis found in the pharmacy literature. A CEA measures costs in dollars and outcomes in natural health units such as cures, lives saved, or blood pressure. An advantage of using a CEA is that health units are common outcomes practitioners can readily understand and these outcomes do not need to be converted to monetary values. On the other hand, the alternatives used in the comparison must have outcomes that are measured in the same units, such as lives saved with each of two treatments. If more than one natural unit outcome is important when conducting the comparison, a cost-effectiveness ratio should be calculated for each type of outcome. Outcomes cannot be collapsed into one unit measure in CEAs as they can with CBAs (outcome = dollars) or CUAs (outcome = quality-adjusted life years [QALYs]). Because CEA is the most common type of pharmacoeconomic study in the pharmacy literature, many examples are available. Bloom and others10 compared two medical treatments for gastroesophageal reflux disease (GERD), using both healed ulcers confirmed by endoscopy and symptom-free days as the outcomes measured. Law and others11 assessed two antidiabetic medications by comparing the percentage of patients who achieved good glycemic control as the outcome measure.
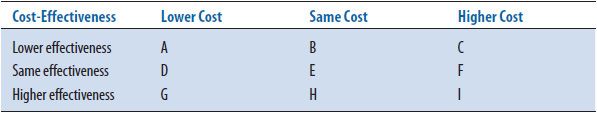
A cost-effectiveness grid (Table 6–4) can be used to illustrate the definition of cost-effectiveness. In order to determine if a therapy or service is cost-effective, both the costs and effectiveness must be considered. Think of comparing a new drug with the current standard treatment. If the new treatment is (1) both more effective and less costly (cell G), (2) more effective at the same price (cell H), or (3) has the same effectiveness at a lower price (cell D), the new therapy is considered cost-effective. On the other hand, if the new drug is (1) less effective and more costly (cell C), (2) has the same effectiveness but costs more (cell F), or (3) has lower effectiveness for the same costs (cell B), then the new product is not cost-effective. There are three other possibilities: the new drug is (1) more expensive and more effective (cell I)—a very common finding, (2) less expensive but less effective (cell A), or (3) has the same price and the same effectiveness as the standard product (cell E). For the middle cell E, other factors may be considered to determine which medication might be best. For the other two cells, an incremental cost-effectiveness ratio (ICER) is calculated to determine the extra cost for each extra unit of outcome. It is left up to the readers to determine if they think the new product is cost-effective, based on a value judgment. The underlying subjectivity as to whether the added benefit is worth the added cost is a disadvantage of CEA.
TABLE 6–4. COST-EFFECTIVENESS GRID
Example
An MCO is trying to decide whether to add a new cholesterol-lowering agent to its preferred formulary. The new product has a greater effect on lowering cholesterol than the current preferred agent, but a daily dose of the new medication is also more expensive. Using the perspective of the MCO (e.g., direct medical costs of the product to the MCO), the results will be presented in three ways in Tables 6–5 to 6–7 to illustrate the various ways that costs and effectiveness are presented in the literature. Table 6–5 presents the simple listing of the costs and benefits of the two alternatives. Sometimes for each alternative, the costs and various outcomes are listed but no ratios are conducted—this is termed a cost-consequence analysis(CCA).
TABLE 6–5. LISTING OF COSTS AND OUTCOMES
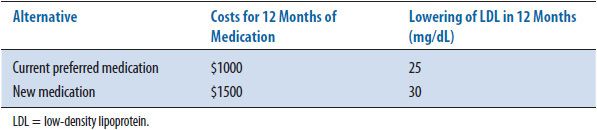
TABLE 6–6. COST-EFFECTIVENESS RATIOS
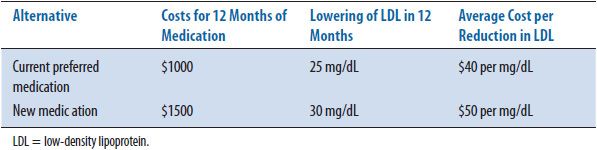
TABLE 6–7. INCREMENTAL COST-EFFECTIVENESS RATIO
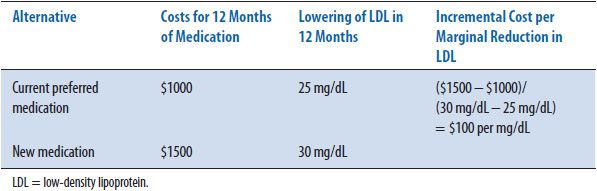
The second method of presenting results includes calculating the average cost- effectiveness ratio (CER) for each alternative. Table 6–6 shows the cost-effectiveness ratio for the two alternatives. The CER is the ratio of resources used per unit of clinical benefit and implies that this calculation has been made in relation to doing nothing or no treatment. In this case, the current medication costs $40 for every 1 mg/dL decrease in LDL while the new medication under consideration costs $50 for the same decrease. In clinical practice, the question is infrequently: “Should we treat the patient or not?” or “What are the costs and outcomes of this intervention versus no intervention?” More often the question is: “How does one treatment compare with another treatment in costs and outcomes?” To answer this more common question, an incremental cost-effectiveness ratio (ICER) is calculated. The ICER is the ratio of the difference in costs divided by the difference in outcomes. Most economists agree that an ICER (the extra cost for each added unit of benefit) is the more appropriate way to present CEA results. Table 6–7 shows the incremental cost-effectiveness (the extra cost of producing one extra unit) of the new medication compared to the current medication. For the new medication, it costs an additional $100 for every additional decrease in LDL of 1 mg/dL. The formulary committee would need to decide if this increase in cost is worth the increase in benefit (improved clinical outcome). In this example, the costs and benefits of the medications are estimated for only 1 year; discounting is not needed. If incremental calculations produce negative numbers, this indicates that one treatment is both more effective and less expensive, or dominant, compared to the other option. The magnitude of the negative ratio is difficult to interpret, so it is suggested that authors instead indicate which treatment is the dominant one. As mentioned earlier, when one of the alternatives is both more expensive and more effective than another, the ICER is used to determine the magnitude of added cost for each unit in health improvement (see CEA grid, cell I, Table 6–4).
Clinicians must then wrestle with this type of information—it becomes a clinical call. Many economists will argue that this uncertainty is why cost-effectiveness may not be the preferred method of pharmacoeconomic analysis.
COST-UTILITY ANALYSIS
![]() A CUA takes patient preferences, also referred to as utilities, into account when measuring health consequences.12 The most common unit used in conducting CUAs is QALYs. A QALY is a health-utility measure combining quality and quantity of life, as determined by some valuations process. The advantage of using this method is that different types of health outcomes can be compared using one common unit (QALYs) without placing a monetary value on these health outcomes (like CBA). The disadvantage of this method is that it is difficult to determine an accurate QALY value. This is an outcome measure that is not well understood or embraced by many providers and decision makers. Therefore, this method is not commonly seen in the pharmacy literature. One reason researchers are working to establish methods for measuring QALYs is the belief that 1 year of life (a natural unit outcome that can be used in CEAs) in one health state should not be given the same weight as 1 year of life in another health state. For example, if two treatments both add 10 years of life, but one provides an added 10 years of being in a healthy state and the other adds 10 years of being in a disabled health state, the outcomes of the two treatments should not be considered equal. Adjusting for the quality of those extra years is warranted. When calculating QALYs, 1 year of life in perfect health has a score of 1 QALY. If health-related quality of life (HR-QOL) is diminished by disease or treatment, 1 year of life in this state is less than 1 QALY. This unit allows comparisons of morbidity and mortality. By convention, perfect health is assigned 1 per year and death is assigned 0 per year, but how are scores between these two determined? Different techniques for determining scales of measurement for QALY are discussed below.
A CUA takes patient preferences, also referred to as utilities, into account when measuring health consequences.12 The most common unit used in conducting CUAs is QALYs. A QALY is a health-utility measure combining quality and quantity of life, as determined by some valuations process. The advantage of using this method is that different types of health outcomes can be compared using one common unit (QALYs) without placing a monetary value on these health outcomes (like CBA). The disadvantage of this method is that it is difficult to determine an accurate QALY value. This is an outcome measure that is not well understood or embraced by many providers and decision makers. Therefore, this method is not commonly seen in the pharmacy literature. One reason researchers are working to establish methods for measuring QALYs is the belief that 1 year of life (a natural unit outcome that can be used in CEAs) in one health state should not be given the same weight as 1 year of life in another health state. For example, if two treatments both add 10 years of life, but one provides an added 10 years of being in a healthy state and the other adds 10 years of being in a disabled health state, the outcomes of the two treatments should not be considered equal. Adjusting for the quality of those extra years is warranted. When calculating QALYs, 1 year of life in perfect health has a score of 1 QALY. If health-related quality of life (HR-QOL) is diminished by disease or treatment, 1 year of life in this state is less than 1 QALY. This unit allows comparisons of morbidity and mortality. By convention, perfect health is assigned 1 per year and death is assigned 0 per year, but how are scores between these two determined? Different techniques for determining scales of measurement for QALY are discussed below.
There are three common methods for determining QALY scores: rating scales (RS), standard gamble (SG), and time trade-off(TTO). A rating scale consists of a line on a page, somewhat like a thermometer, with perfect health at the top (100) and death at bottom (0). Different disease states are described to subjects, and they are asked to place the different disease states somewhere on the scale indicating preferences relative to all diseases described. As an example, if they place a disease state at 70 on the scale, the disease state is given a score of 0.7 QALYs.
The second method for determining patient preference (or utility) scores is the standard gamble method. For this method, each subject is offered two alternatives. Alternative one is treatment with two possible outcomes: either the return to normal health or immediate death. Alternative two is the certain outcome of a chronic disease state for life. The probability (p) of dying is varied until the subject is indifferent between alternative one and alternative two. As an example, a person considers two options: a kidney transplant with a 20% probability of dying during the operation (alternative one) or dialysis for the rest of his life (alternative two). If this percent is his or her point of indifference (he or she would not have the operation if the chances of dying during the operation were any higher than 20%), the QALY is calculated as 1 – þ or 0.8 QALY.
The third technique for measuring health preferences is the TTO method. Again, the subject is offered two alternatives. Alternative one is a certain disease state for a specific length of time t, the life expectancy for a person with the disease, then death. Alternative two is being healthy for time x, which is less than t. Time x
Stay updated, free articles. Join our Telegram channel

Full access? Get Clinical Tree


