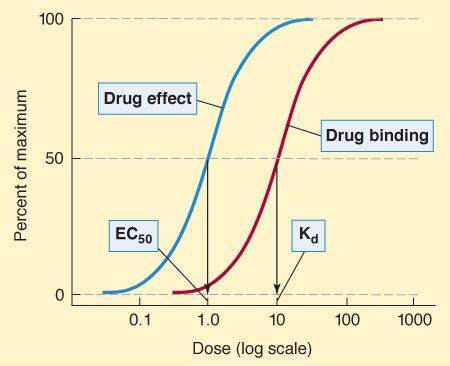
Graded dose-response and dose-binding graphs. (In isolated tissue preparations, concentration is usually used as the measure of dose.) A. Relation between drug dose or concentration (abscissa) and drug effect (ordinate). When the dose axis is linear, a hyperbolic curve is commonly obtained. B. Same data, logarithmic dose axis. The dose or concentration at which effect is half-maximal is denoted EC50, whereas the maximal effect is Emax. C. If the percentage of receptors that bind drug is plotted against drug concentration, a similar curve is obtained, and the concentration at which 50% of the receptors are bound is denoted Kd, and the maximal number of receptors bound is termed Bmax.
Graded Dose-Binding Relationship & Binding Affinity
It is possible to measure the percentage of receptors bound by a drug, and, by plotting this percentage against the log of the concentration of the drug, a graph similar to the dose-response curve is obtained (Figure 2-1C). The concentration of drug required to bind 50% of the receptor sites is denoted as Kd and is a useful measure of the affinity of a drug molecule for its binding site on the receptor molecule. The smaller the Kd, the greater the affinity of the drug for its receptor. If the number of binding sites on each receptor molecule is known, it is possible to determine the total number of receptors in the system from the Bmax .
Quantal Dose-Response Relationships
When the minimum dose required to produce a specified response is determined in each member of a population, the quantal dose-response relationship is defined (Figure 2-2). For example, a blood pressure-lowering drug might be studied by measuring the dose required to lower the mean arterial pressure by 20 mm Hg in 100 hypertensive patients. When plotted as the percentage of the population that shows this response at each dose versus the log of the dose administered, a cumulative quantal dose-response curve, usually sigmoid in shape, is obtained. The median effective (ED50), median toxic (TD 50), and (in animals) median lethal (LD50) doses are derived from experiments carried out in this manner. Because the magnitude of the specified effect is arbitrarily determined, the ED50 determined by quantal dose-response measurements has no direct relation to the ED50 determined from graded dose-response curves. Unlike the graded dose-response determination, no attempt is made to determine the maximal effect of the drug. Quantal dose-response data provide information about the variation in sensitivity to the drug in a given population, and if the variation is small, the curve is steep.
FIGURE 2-2
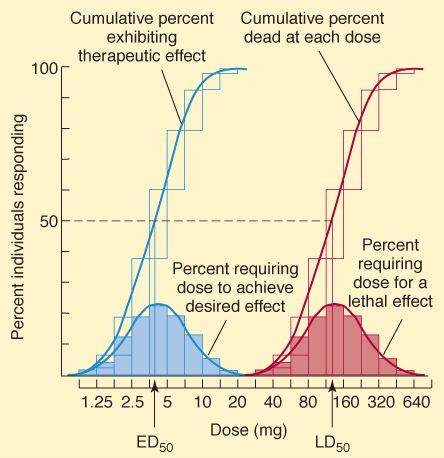
Quantal dose-response plots from a study of the therapeutic and lethal effects of a new drug in mice. Shaded boxes (and the accompanying bell-shaped curves) indicate the frequency distribution of doses of drug required to produce a specified effect, that is, the percentage of animals that required a particular dose to exhibit the effect. The open boxes (and corresponding sigmoidal curves) indicate the cumulative frequency distribution of responses, which are lognormally distributed.
(Modified and reproduced, with permission, from Katzung BG, editor: Basic & Clinical Pharmacology, 11th ed. McGraw-Hill, 2009: Fig. 2-2.)
Efficacy
Efficacy—often called maximal efficacy—is the greatest effect (Emax) an agonist can produce if the dose is taken to very high levels. Efficacy is determined mainly by the nature of the drug and the receptor and its associated effector system. It can be measured with a graded dose-response curve (Figure 2-1) but not with a quantal dose-response curve. By definition, partial agonists have lower maximal efficacy than full agonists (see later discussion).
Potency
Potency denotes the amount of drug needed to produce a given effect. In graded dose-response measurements, the effect usually chosen is 50% of the maximal effect and the dose causing this effect is called the EC50 (Figure 2-1A and B). Potency is determined mainly by the affinity of the receptor for the drug and the number of receptors available. In quantal dose-response measurements, ED50, TD 50, and LD50 are also potency variables (median effective, toxic, and lethal doses, respectively, in 50% of the population studied). Thus, potency can be determined from either graded or quantal dose-response curves (eg, Figures 2-1 and 2-2), but the numbers obtained are not identical.
Spare Receptors
Spare receptors are said to exist if the maximal drug response (Emax) is obtained at less than maximal occupation of the receptors (Bmax). In practice, the determination is usually made by comparing the concentration for 50% of maximal effect (EC50) with the concentration for 50% of maximal binding (Kd). If the EC50 is less than the Kd, spare receptors are said to exist (Figure 2-3). This might result from 1 of 2 mechanisms. First, the duration of the activation of the effector may be much greater than the duration of the drug-receptor interaction. Second, the actual number of receptors may exceed the number of effector molecules available. The presence of spare receptors increases sensitivity to the agonist because the likelihood of a drug-receptor interaction increases in proportion to the number of receptors available. (For contrast, the system depicted in Figure 2-1, panels B and C, does not have spare receptors, since the EC50 and the Kd are equal.)
FIGURE 2-3
In a system with spare receptors, the EC50 is lower than the Kd, indicating that to achieve 50% of maximal effect, less than 50% of the receptors must be activated. Explanations for this phenomenon are discussed in the text.
Agonists, Partial Agonists, & Inverse Agonists
Modern concepts of drug-receptor interactions consider the receptor to have at least 2 states—active and inactive. In the absence of ligand, a receptor might be fully active or completely inactive; alternatively, an equilibrium state might exist with some receptors in the activated state and with most in the inactive state (Ra+Ri; Figure 2-4). Many receptor systems exhibit some activity in the absence of ligand, suggesting that some receptors are in the activated state. Activity in the absence of ligand is called constitutive activity. A full agonist is a drug capable of fully activating the effector system when it binds to the receptor. In the model system illustrated in Figure 2-4, a full agonist has high affinity for the activated receptor conformation, and sufficiently high concentrations result in all the receptors achieving the activated state (Ra-Da). A partial agonist produces less than the full effect, even when it has saturated the receptors (Ra-Dpa + Ri-Dpa), presumably by combining with both receptor conformations, but favoring the active state. In the presence of a full agonist, a partial agonist acts as an inhibitor. In this model, neutral antagonists bind with equal affinity to the Ri and Ra states, preventing binding by an agonist and preventing any deviation from the level of constitutive activity. In contrast, inverse agonists have a much higher affinity for the inactive Ri state than for Ra and eliminate any constitutive activity.
FIGURE 2-4
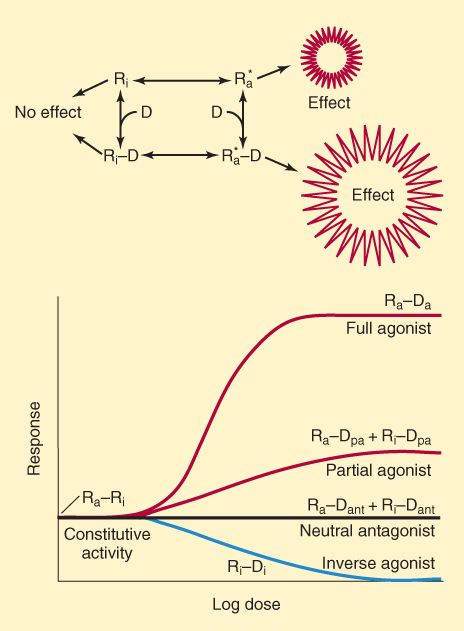
Upper: One model of drug-receptor interactions. The receptor is able to assume 2 conformations, Ri and Ra. In the Ri state, it is inactive and produces no effect, even when combined with a drug (D) molecule. In the Ra state, it activates its effectors and an effect is recorded, even in the absence of ligand. In the absence of drug, the equilibrium between Ri and Ra determines the degree of constitutive activity. Lower: A full agonist drug (Da) has a much higher affinity for the Ra than for the Ri receptor conformation, and a maximal effect is produced at sufficiently high drug concentration. A partial agonist drug (Dpa) has somewhat greater affinity for the Ra than for the Ri conformation and produces less effect, even at saturating concentrations. A neutral antagonist (Dant) binds with equal affinity to both receptor conformations and prevents binding of agonist. An inverse agonist (Di) binds much more avidly to the Ri receptor conformation, prevents conversion to the Ra state, and reduces constitutive activity.
(Modified and reproduced, with permission, from Katzung BG, editor: Basic & Clinical Pharmacology, 11th ed. McGraw-Hill, 2009: Fig. 1-4.)
Antagonists
Stay updated, free articles. Join our Telegram channel

Full access? Get Clinical Tree


