Nutrition and the Chemical Senses
Valerie B. Duffy
1Abbreviations: cAMP, cyclic adenosine 3′,5′-monophosphate; CN, cranial nerve; CNS, central nervous system; CTN, chorda tympani nerve; ENaC, epithelial amiloride-sensitive sodium channel; GPCR, G-protein-coupled receptor; KCl, potassium chloride; MSG, monosodium glutamate; NaCl, sodium chloride; PTC/PROP, phenylthiocarbamide/propylthiouracil; SNP, single nucleotide polymorphism; SSS, sensory-specific satiety; TRP, transient receptor potential; TRPV1, TRP cation channel, subfamily V, member 1.
Foods and beverages provide sustenance and diverse pleasurable experiences. Specific chemosensory organ systems respond to chemicals in foods, eliciting neurologic, biobehavioral, and metabolic responses that stimulate complex emotional, pleasurable, and memory responses. Odors emanating from restaurants can stimulate our appetites and entice us to stop and eat. At the table, chewing releases and pumps food volatiles to olfactory receptors, which lie behind the bridge of the nose. No single word in the English language fully captures the perceptual experiences of food. Olfactory sensations blend with true taste (salty, sweet, sour, bitter, meaty/savory sensations) and somatosensory sensations (mouthfeel, texture, temperature, astringency, irritation) to form a unique and integrated flavor message.
Food flavor, colloquially referred to as taste, is an important driver of food choice, yet individuals experience different flavor worlds because of physiologic variation in perceptual responses to food and beverage chemicals. For example, 9 out of 10 adults from a nationally representative sample reported that taste was the primary driver of food purchases, surpassing price, health, convenience, and sustainability (1). Individual differences in sensory systems are present at birth, and sensory response changes throughout life with maturation and environmental interactions. Interindividual taste differences were reported as early as 1888 (2). In the 1960s, Fischer et al connected variation in taste with dietary preferences, smoking, and body weight (3). Chemosensory factors were envisioned to have influences parallel to metabolic controls on food intake and body weight, acting through receptors, nervous signals, and brain mechanisms. Now we believe that the chemical senses interact with metabolic controls to influence dietary behaviors and weight. This chapter reviews chemosensory systems and their variations with genetics and disease and how this variation, particularly orosensory variation, explains differences in what we like and choose to consume, thus ultimately influencing risk for diet-related diseases.
BACKGROUND
Chemosensation includes detection and response to chemicals in the external world and signals from the gastrointestinal and respiratory systems. Perception is the conscious experience that arises from these chemicals.
Sensation
To elicit a chemosensory response, most chemicals bind to specific receptors (see exceptions, discussed later). Transduction of chemosensory events commonly involves G-protein-coupled receptors (GPCRs)—seventransmembrane proteins that trigger G-protein-based
signaling cascades when activated with chemical (ligand) binding. Linda Buck and Richard Axel received a 2004 Nobel Prize for their work on the genetic basis of olfactory receptors (4). Receptors are finely tuned, responding to a few specific chemicals, or broadly tuned, responding to a repertoire of compounds. True tastes may be typified by simple prototypical tastants (e.g., sucrose is sweet), whereas most odors are complex mixtures of multiple odorants (e.g., coffee odor requires 27 different compounds). Receptor cells generally are bipolar neurons; chemical signals are transduced into action potentials. Electrical signals carry sensory messages to the central nervous system (CNS). Receptor binding is not necessary to transduce salty or sour tastes, which permeate through ion channels to stimulate taste receptor cells. Various sensors respond to somatosensory sensations (e.g., creaminess, temperature, irritation).
signaling cascades when activated with chemical (ligand) binding. Linda Buck and Richard Axel received a 2004 Nobel Prize for their work on the genetic basis of olfactory receptors (4). Receptors are finely tuned, responding to a few specific chemicals, or broadly tuned, responding to a repertoire of compounds. True tastes may be typified by simple prototypical tastants (e.g., sucrose is sweet), whereas most odors are complex mixtures of multiple odorants (e.g., coffee odor requires 27 different compounds). Receptor cells generally are bipolar neurons; chemical signals are transduced into action potentials. Electrical signals carry sensory messages to the central nervous system (CNS). Receptor binding is not necessary to transduce salty or sour tastes, which permeate through ion channels to stimulate taste receptor cells. Various sensors respond to somatosensory sensations (e.g., creaminess, temperature, irritation).
Chemosensory systems are primarily flux detectors: Transduction events occur with changes in chemical concentration in the mouth and nasal or sinus cavity through eating and breathing. Chemoreceptor cells undergo neurogenesis throughout life, including formation of new cells, maturation, and programmed death. Extrinsic and intrinsic factors regulate olfactory receptor life span (5). Taste receptors are continually replaced and functionally change in response to chemical environments. Continuous, constant exposure causes adaptation (e.g., inability to smell the perfume or cologne you wear) or desensitization (e.g., less burn from long-term chili ingestion).
How do we perceive sweet versus bitter, garlic versus basil, port versus Scotch whiskey? Taste quality likely is coded by chemical-specific labeled lines from the periphery to the CNS (6, 7). Odors are coded as patterns of receptor stimulation that are reflected in olfactory spatiotemporal representations and sequentially processed through the olfactory pathways in the brain (8). Although reaching the CNS through separate pathways, the orbital frontal cortex integrates mixtures of chemosensory signals into unique flavor percepts.
Perception
Psychophysicists study how perceptions vary with the physical world—how saltiness varies with salt concentration, smell with odor exposure, and creaminess with level of fat. The following is a brief overview of selected psychophysical techniques, emphasizing perceived intensity measures as tools to illuminate associations among chemosensory variation, diet, and health.
Threshold is the lowest physical concentration required for detection or recognition of a taste, smell, or irritant. An elevated threshold (low sensitivity) means a higher concentration is required for detection and recognition. Threshold procedures require substantial control to discern functional ability from chance and biases (e.g., subtle differences in stimulus delivery, diluent, temperature). Threshold may fail to correspond to perception of concentrated stimuli. An individual with a low salt threshold (high sensitivity) perceives concentrated salt as less intense than one with a higher threshold. Thus, characterizing individuals by threshold may not help explain differences in dietary behaviors (9).
Suprathreshold reflects ability to perceive odors, taste, and irritants at levels common to foods, beyond ability to detect if a food is spoiled, for example. The most common identification tasks involve measuring stimulus identity and/or intensity. Identification tasks are common in olfactory assessment—identifying odors from a list with correct responses and distracters. The task must include familiar odors to minimize cognitive challenges. The University of Pennsylvania Smell Identification Test is a commercially available multiple-choice,“scratch-and-sniff” test with age- and sex-specific normative data.
Few studies have associated odor identification performance with dietary behaviors, presumably because identification tasks assess olfactory dysfunction, not acuity. Individuals can show a range of olfactory abilities and still identify an odor correctly. With good stimulus control, as with an olfactometer, adding intensity judgments (discussed later) to identification tasks will improve the assessment of olfaction-diet-health associations (10). Retronasal tests are important for olfaction and diet studies. As a screener (or demonstration), have participants pinch their nostrils closed, place a gourmet jelly bean in the mouth, chew, and then open the nostrils. While the nostrils are plugged, the sensation is minimally sweet and little else. Opening the nostrils allows retronasal olfaction and increases sweetness resulting from flavor integration (described later). There is retronasal impairment if participants fail to notice differences between fully plugged and unplugged. Food products can serve as stimuli for retronasal identification and intensity measures (11).
Another suprathreshold measure is direct scaling of perceived intensity or degree of liking/disliking, such as how perceived intensity grows with increasing concentration (slope). The liking function usually forms an inverted U: low and high concentrations are less pleasant than those in between. Direct scaling methods aim to make the intensity ratings objective and permit comparison of these ratings across individuals. In 1960, Stevens proposed converting intensity ratings into numbers with ratio properties (magnitude estimation). For example, because a second tea tastes twice as sweet as the first, I will give 6 to the first for sweetness and 12 to the second. The third is one-third as sweet as the first. I will give it 2. The scale has ratio properties, but no forced ceiling and 0 as the floor (no sensation). Magnitude estimate provides relative but not absolute intensities—we cannot tell if the first tea was moderately sweet to one individual but strongly sweet to another. Magnitude estimation requires a certain degree of numeracy.
An understanding of absolute meaning is achieved by expressing the intensity of interest relative to another sensory modality (magnitude matching is the gold standard
for perceived intensity measures) (12). Cross-modal references can be actual (e.g., 1000-Hz white noise) or remembered (e.g., brightness of the sun) sensations, assuming the other sensory modality does not vary systematically with the intensity of interest (13). Importantly, participants must use the same scale to make intensity judgments within the context of all sensations. For example, participants rate the intensity of sweetness on the same scale as intensity of tones or lights. The first participant found the sweetness of tea about one-half as intense as a 72-dB, 1000-Hz tone whereas the second found the sweetness equally intense.
for perceived intensity measures) (12). Cross-modal references can be actual (e.g., 1000-Hz white noise) or remembered (e.g., brightness of the sun) sensations, assuming the other sensory modality does not vary systematically with the intensity of interest (13). Importantly, participants must use the same scale to make intensity judgments within the context of all sensations. For example, participants rate the intensity of sweetness on the same scale as intensity of tones or lights. The first participant found the sweetness of tea about one-half as intense as a 72-dB, 1000-Hz tone whereas the second found the sweetness equally intense.
Scales with adjective/adverb labels (e.g., weak, strong) are commonly used to obtain intensity ratings. The context for the labels is necessary as illustrated by Stevens. “Mice may be called large or small, and so may elephants, and it is quite understandable when someone says it was a large mouse that ran up the trunk of the small elephant.” The size judgment was within the context of mice (large relative to mice) or elephants (small relative to elephants). A common pitfall is incorrectly assuming the same context for labels, falsely equating the top of the scale, and, according to the scale length, determining that the mouse is larger than the elephant (Fig. 43.1). Correct comparisons of absolute size are possible if the scale is generalized to all sizes with the top understandable to all (e.g., the Grand Canyon).
Correct and incorrect ratings of oral perceived intensity have been made. Because of taste receptor gene polymorphisms and differences in receptor density, we know that individuals vary in the range of their orosensory scale, from nontasters to supertasters (see later). Incorrect ratings result from failing to provide a context for the top of the scale or applying the top only to oral sensation (14). The scale is falsely equated (e.g., equating mice and elephant scales) to blunt or reverse orosensory differences between nontasters and supertasters. Generalizing the scale top to strongest sensation of any kind (15) or something tangible like the brightness of the sun (assuming brightness does not vary systematically with orosensory variation) (16), allows the correct differentiation of oral sensations between nontasters and supertasters (Fig. 43.2). Similarly, generalizing hedonic scales outside food and beverage experiences can identify individuals for whom food is more pleasurable than any other pleasurable activity (13, 17).
In summary, intensity measures test chemosensory function across a range of concentrations, providing more
information than thresholds about genotype-phenotypediet-health connections (18). With good stimulus control, adding intensity to odor identification tasks tests for dysfunction and acuity. Intensity scales should be generalized to all sensations (not just chemosensations) or, for hedonic assessment, all pleasurable and unpleasurable activities. Participants should rate intensity of chemosensations relative to sensory modalities of comparison in a practice session to determine if they are able to correctly order the comparison series (e.g., weakest to brightest light). Experimenters can use the comparison intensity ratings to normalize the chemosensory ratings (19) or to covary in statistical analyses (20). The National Institutes of Health (NIH) Toolbox project has an odor identification task and taste intensity test to screen for smell and taste function.
information than thresholds about genotype-phenotypediet-health connections (18). With good stimulus control, adding intensity to odor identification tasks tests for dysfunction and acuity. Intensity scales should be generalized to all sensations (not just chemosensations) or, for hedonic assessment, all pleasurable and unpleasurable activities. Participants should rate intensity of chemosensations relative to sensory modalities of comparison in a practice session to determine if they are able to correctly order the comparison series (e.g., weakest to brightest light). Experimenters can use the comparison intensity ratings to normalize the chemosensory ratings (19) or to covary in statistical analyses (20). The National Institutes of Health (NIH) Toolbox project has an odor identification task and taste intensity test to screen for smell and taste function.
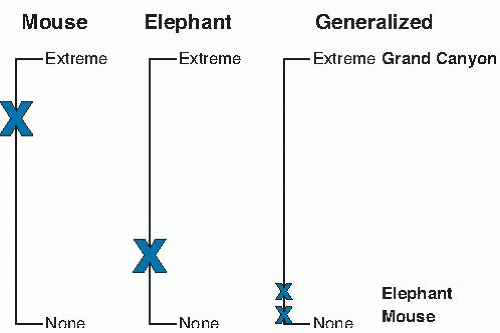 Fig. 43.1. Ratings of size in the context of mice (left) and elephants (center). Incorrect judgments of absolute size of a large mouse and small elephant would be made if the experimenter ignored the scale context (or it was not specified) and concluded that the mouse was larger than the elephant. Correct judgments of absolute size of mice versus elephants would be made if the top of the scale was generalized to size that was understood by all to be very large (right). |
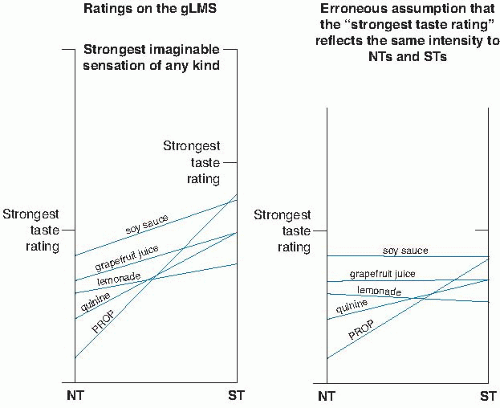 Fig. 43.2. When scale labels are assumed equal to everyone, across-group comparisons of taste intensity are distorted. Left. Intensity ratings of 3.2 mM propylthiouracil (PROP), 1 mM quinine hydrochloride, beverages, and condiment collected with the general labeled magnitude scale (gLMS) to see taste differences between nontasters (NT) and supertasters (ST). Right. Identical data as on left, but ST ratings are compressed proportionally so that the label “strongest taste experienced during the study” is treated as if it were equal to everyone (see text for details). (Reprinted with permission from Bartoshuk LM, Duffy VB, Chapo AK et al. From psychophysics to the clinic: missteps and advances. Food Qual Pref 2004:15;617.) |
TASTE
Any chemical that is soluble in the oral cavity watery medium (saliva, mucus) can stimulate taste—perceptual qualities of sweet, salty, sour, bitter, and umami (meaty/savory) via activating taste receptor cells. In general, sugars, alcohols, and some peptides are sweet; salts are salty; organic/inorganic acids are sour; many plant alkaloids, terpenoids, and flavonoids, and some salts and peptides are bitter; and certain amino acids are meaty/savory. Pleasure responses to sweetness and disliking for bitterness (and probably strong sour and umami) are present at birth (21) and not learned (22). Response to saltiness develops during the first year of life (23).
Within taste buds, taste receptor cells are discrete ovoid structures comprised of 50 to 150 cells arising from the epithelium, including basal cells (source of new taste cells) and elongated cells, with microvilli that extend through a pore into the oral cavity. Taste buds are found on the soft palate, pharynx, larynx, and epiglottis and within gustatory papillae on the tongue. After chemical activation and depolarization of receptor cells, afferent taste fibers within branches of three cranial nerves (CNs) transmit taste signals to the rostral nucleus of the solitary tract (gustatory NST), which also is involved in control of digestive, cardiovascular, and respiratory systems. The chorda tympani nerve (CTN), CN VII, innervates fungiform papillae on the tongue tip (Fig. 43.3). Foliate papillae on the posterior lateral tongue are innervated by the CTN (anterior papillae) and lingual nerve (CN IX, poster foliate papillae). The lingual nerve (CN IX) innervates circumvallate papillae (posterior tongue in a rearward facing V). The superficial petrosal nerve (CN VII) innervates soft palate taste buds, and the vagal nerve superior branch (CN X) innervates the epiglottis. All taste qualities are perceivable on all areas of CN innervation unless there is taste damage to a single CN (see later), making the “taste map”concept incorrect. Afferent taste fibers ending in the nucleus of the solitary tract synapse into second order neurons to the ventrobasal thalamus, then to the gustatory cortex, orbitofrontal cortex, amygdala, and lateral hypothalamus (24). Glutamate, an excitatory neurotransmitter, modulates information traveling from peripheral taste receptors to the brain; others likely regulate information carried from the brain to the peripheral taste system (25).
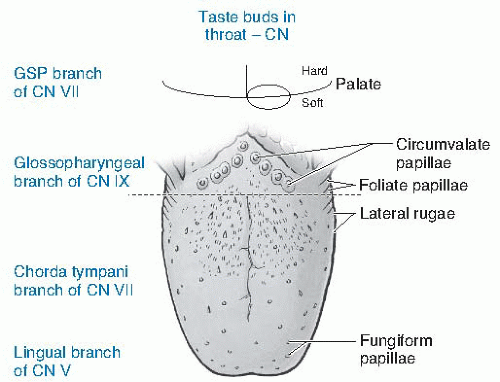 Fig. 43.3. Drawing showing cranial taste and trigeminal innervation of the tongue and throat as well as the taste papillae on the tongue. CN, cranial nerve. |
The density of fungiform papillae and their taste buds varies across individuals (26) and corresponds to taste intensity (18, 27, 28, 29, 30, 31). Conventional scaling (e.g., 9-point category scale) fails to show papillae density and taste intensity correlations (16), supporting that these scales do not capture differences in taste intensity (32). Five prototypical taste qualities are reviewed in the following subsections. Some evidence suggests metallic as a sixth taste. Humans can sense fatty acids in the oral cavity, but there is no unique taste percept to accompany fatty acid sensing.
Sweet
Various chemicals stimulate a singular perceptual experience that is qualitatively similar—low molecular weight, carbohydrate sweeteners, polyols, inorganic salts, and more than 25 different classes of synthetic noncaloric sweeteners (33). Multiple lines of psychophysical evidence exist for multiple sweet transduction mechanisms (34), including lack of cross-adaptation (sweeteners sharing similar binding would cross-adapt), inability to block sweetness of all sweeteners, and that sweetener combinations can produce greater than expected sweetness (i.e., synergy).
The primary sweet taste receptor, a heterodimer of two seven-transmembrane domain proteins, T1R2 and T1R3 (T1R2/T1R3) (35), has three or more sweet chemical binding sites. Humans carry three TAS1R taste receptor genes in a single cluster on chromosome 1. These proteins are part of class C GPCRs, which have large N-terminal Venus flytrap-like domains. Some sweeteners bind to the subunit T1R2 (e.g., aspartame, neotame), others to T1R3 (cyclamate). Sugars and sucralose bind to either but
have greater T1R3 affinity (36). After receptor binding, the sweet transduction pathway in the taste bud involves three G proteins (gustducin, transducin, and possible G1[2]), one enzyme (PLCβ2), a second message receptor (IP3R), and an ion channel (transient receptor potential M5 [TRPM5]) (37). Differential binding to multiple taste receptors partially explains flavor profile differences between sugar-based and artificial sweeteners. Artificial sweeteners also stimulate bitter receptors, making them less pleasant (38), especially to those with great propensity to experience bitterness. Sweet taste perception is not completely obliterated in T1R2/T1R3 knockout animals (39), a finding suggesting ancillary sweet receptors. Taste cells express glucose transporters or sugar-gated cation channels and connect sweet taste sensing with glucose homeostatic control (40).
have greater T1R3 affinity (36). After receptor binding, the sweet transduction pathway in the taste bud involves three G proteins (gustducin, transducin, and possible G1[2]), one enzyme (PLCβ2), a second message receptor (IP3R), and an ion channel (transient receptor potential M5 [TRPM5]) (37). Differential binding to multiple taste receptors partially explains flavor profile differences between sugar-based and artificial sweeteners. Artificial sweeteners also stimulate bitter receptors, making them less pleasant (38), especially to those with great propensity to experience bitterness. Sweet taste perception is not completely obliterated in T1R2/T1R3 knockout animals (39), a finding suggesting ancillary sweet receptors. Taste cells express glucose transporters or sugar-gated cation channels and connect sweet taste sensing with glucose homeostatic control (40).
Bitter
Multiple mechanisms and receptors respond to many chemicals with diverse structures that are bitter (33). The GPCRs for bitter taste are T2Rs (41, 42), with a family of approximately 25 membrane receptor genes (TAS2Rs) (43). Twenty-three are on 2 extended clusters on chromosomes 7q34-35 and 12p13.31-13.2, 1 is on chromosome 5p15.31, and another on 7q31.32. Bitter receptor genes are expressed in papillae in the oral cavity and extraorally in lung tissue, to respond to noxious compounds (44).
Most bitters likely stimulate multiple bitter receptors (i.e., broadly tuned). Although 70% of phenylthiocarbamide (PTC)/propylthiouracil (PROP) bitterness is mediated by TAS2R38 (18, 45), other receptors likely respond to these unique compounds. The bitter taste receptor structure is complex, with diverse binding sites. Bitter taste transduction involves a cascade of four intracellular signaling proteins, including the subunit α-gustducin, G-protein subunit Gg13, enzyme phospholipase Cβ2, IP3 receptor type III, and TRPM5 ion channel (46, 47). Chemicals stimulate bitter taste via receptors or signaling proteins.
The bitter genes show high degrees of allelic variation. Evolutionary adaption to local plant environments may account for which alleles are favored (48). As natural toxins are often bitter, redundancy in bitter perception is evolutionarily advantageous. Feeney et al (49) reviewed the known TAS2R2 single nucleotide polymorphisms (SNPs). Additionally, multiple SNPs for bitter receptors or salivary proline-rich proteins on chromosome 12 explained little variability in quinine bitterness (50); quinine is a promiscuous ligand, binding to at least nine different receptors, thus making it ideal for assessing taste function. Some coffee bitterness is explained by a haploblock across TAS2R3, TAS2R4, and TAS2R5; grapefruit juice bitterness and liking by TAS2R19 and possibly TAS2R60 (51). In vitro research suggests that hTAS2R39 responds to bitter tea catechins (52). Allelic variation in TAS2R31 and TAS2R44 explains differential response to saccharin and acesulfame-potassium (K).
Salty
Primarily added to foods as sodium chloride (NaCl), salt is important for saltiness, bitter blocking, flavor enhancement, and functional purposes (e.g., preservative). Sodium appetite homeostatically controls animals’ sodium intake. In humans, early dietary experiences influence salt preference, including exposure to sodium-rich or sodiumdepleted conditions during development (53). Children of mothers who experienced dehydration during pregnancy report greater salt preference during infancy (54) and adulthood (55). Females and males differ in affinity for salt (56), possibly because of sex hormones, as shown in pregnancy, when increasing salt preference is associated with the need to expand blood volume (57). Despite these examples, love of salt in humans is not really controlled by sodium appetite (55).
For human salt taste, some receptors are selective epithelial amiloride-sensitive sodium channels (ENaCs) (58). Sodium cations (Na+) flux passively from the oral cavity to taste receptor cells through ENaCs. Na+/K-adenosine triphosphatase (Na+/K+-ATPase) then pumps Na+ back across the cell. The vanilloid receptor-1 (TRP cation channel, subfamily V, member 1 [TRPV1]) is a likely cation-nonspecific salt receptor (59). Salt evokes different qualities depending on concentration—weak concentrations taste sweet, higher concentrations are salty, and the highest are irritating (60).
Sour
Acids elicit sour taste by stimulating acid-seeking cells within taste buds and, if strong enough, elicit rejection. Specific receptors and transduction mechanisms for sour taste remain controversial, with several candidate receptors (61) or channels in which the hydrogen (H+) from strong acids enter taste cells through ion channels (similar to NaCl), reducing intracellular pH. Weak acids pass through lipid soluble membranes. The pH reduction initiates a series of transduction and neural responses to sour stimuli (62).
Umami
Many classify umami, the savory flavor of monosodium glutamate (MSG), as the fifth basic taste. Free glutamates and Na+ are found naturally in protein-rich foods and vegetables such as tomatoes. Initially, MSG was marketed as a flavor enhancer, adding mouth feel and flavor. Similar to sweet taste, there are multiple umami receptors (63)—a metabotropic glutamate receptor (taste-mGluR4) (64) and heterodimer of two seven-transmembrane domain proteins, T1R1 and T1R3 (35). The human umami receptor, a T1R1/T1R3 heterodimer, responds to glutamate, aspartate, and L-2-amino-4-phosphonobutyrate, with signal potentiation by purinic ribonucleotides inosine-5′-monophosphate and guanosine-5′-monophosphate (35). The mGluR4 may respond best to MSG threshold levels and T1R1/T1R3 best to concentrated MSG (65).
SMELL
Odors must be volatile, hydrophobic, single, or complex chemicals with relatively low molecular weight. The sense of smell, a dual sensory process, comprises transport of odors orthonasally via the nostrils and retronasally via the nasopharynx to olfactory receptors in the olfactory epithelium (Fig. 43.4). Brain activation differs with route of delivery (67). Hedonic responses to odors are not innate, but rather are learned through positive (e.g., pairing odors with energy, repetitive exposure) and negative (e.g., flavor aversions) conditioning.
The olfactory epithelium, the transduction site, sits behind the bridge of the nose, in the dorsal nasal cavity near the septum, and from superior to anterior middle turbinate. Orthonasal olfaction occurs passively with breathing—we may not think of eating until breathing in food smells. Sniffing increases the quantity and quality of odors reaching the olfactory receptors and stimulates neural activity throughout the olfactory system (68). Retronasal olfaction is an active process in which the mouth, tongue, and swallowing movements work in synchrony to release and warm the volatiles and create a pressure differential that pumps them up through the oropharynx and nasopharynx to the olfactory epithelium (69). Food volatiles are integrated with taste and somatosensory sensations into a unitary percept in the orbitofrontal cortex (70) (see Fig. 43.4).
Olfactory receptor cells are bipolar neurons (giving rise to a dendrite on one side, an axon on the other) associated in the olfactory epithelium with supporting (mucus producing) and basal (for generating new neurons) cells. By diffusion and active transport via binding proteins, odors cross the mucus layer before binding with transmembrane GPCRs on long cilia of olfactory receptor neurons, dendritic side. Each olfactory receptor expresses 1 or 2 of the approximately 1000 different receptor types in most mammals (4). Humans, however, possess fewer than 400 functional olfactory receptor genes (71). The potential for coding odor quality is great, given the belief that each receptor binds several active chemical groups on different odor molecules (72). Diversity of receptor families implies diversity of responses to complex odors (73). The myth that humans distinguish 10,000 odors has no scientific basis (74). The active odor compounds in foods number
less than 1000 (http://www.flavornet.org), and individual ability to differentiate odors number in the hundreds (75).
less than 1000 (http://www.flavornet.org), and individual ability to differentiate odors number in the hundreds (75).
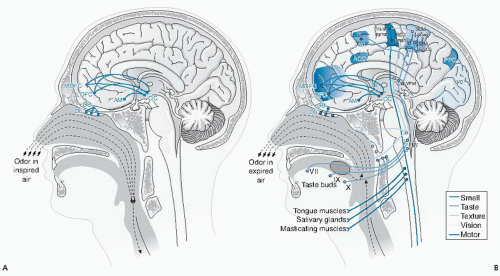 Fig. 43.4. A. Brain systems involved in smell perception during orthonasal olfaction (sniffing in). B. Brain systems involved in smell perception during retronasal olfaction (breathing out), with food in the oral cavity. Air flows indicated by dashed and dotted lines; dotted lines indicate air carrying odor molecules. ACC, accumbens; AM, amygdala; AVI, anterior ventral insular cortex; DI, dorsal insular cortex; LH, lateral hypothalamus; LOFC, lateral orbitofrontal cortex; MOFC, medial orbitofrontal cortex; NST, nucleus of the solitary tract; OB, olfactory bulb; OC, olfactory cortex; OE, olfactory epithelium; PPC, posterior parietal cortex; SOM, somatosensory cortex; V, VII, IX, X, cranial nerves; VC, primary visual cortex; VPM, ventral posteromedial thalamic nucleus. (Reprinted with permission from Shepherd G. Smell images and the flavour system in the human brain. Nature 2006;444:316-21.) |
Odor-receptor binding initiates the transduction cascade—activation of Gαolf, then adenylyl cyclase activation, and catalysis of cyclic adenosine 3′,5′-monophosphate (cAMP). A single CN (CN I) carries olfactory messages from the peripheral nervous system to the CNS. cAMP depolarizes the olfactory neuron; the action potential is carried by an unmyelinated axon through the cribriform plate of the ethmoid bone, where the axon synapses on second-order neurons located in olfactory bulb glomeruli (76). Differential activation of olfactory receptors produces spatially and temporarily patterned activity across the glomeruli to form a unique percept, an odor image, similar to patterning in the visual system (77). Olfactory bulb microcircuits further enhance and sharpen odor images. Olfactory dysfunction occurs with loss of functional olfactory receptors, damage to olfactory neuron axons as they pass through the cribriform plate, and olfactory bulb reduction (68). Dysfunction is severe if the anatomic structures fail to regenerate. Odor quality is distorted if regeneration is incorrect.
Stay updated, free articles. Join our Telegram channel

Full access? Get Clinical Tree


