Tape measure with millimeter markings


EXAMINATION
| TECHNIQUE | FINDINGS | |
|---|---|---|
| ANTHROPOMETRICS | ||
| Measure height and weight | ||
| EXPECTED:Women: 100 pounds for first 5 feet, plus 5 pounds for each inch thereafter. Men: 106 pounds for first 5 feet, plus 6 pounds for each inch thereafter. | ||
| Use growth charts for pediatric patients available at www.cdc.gov/growthcharts. | EXPECTED:Child is following a growth curve pattern for height and weight. Height and weight are approximately same percentiles. | |
 Calculate percent weight change Calculate percent weight change | UNEXPECTED:Weight loss that equals or exceeds 1% to 2% in 1 week, 5% in 1 month, 7.5% in 3 months, 10% in 6 months. | |
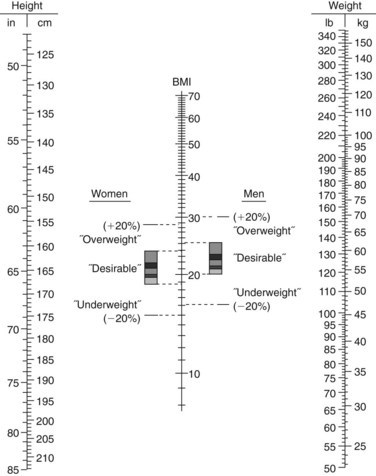
 Calculate body mass index (BMI) kg/m2 Calculate body mass index (BMI) kg/m2 | EXPECTED:18.5 to 24.9 for men and women. | |
| UNEXPECTED:BMI less than 18.5 is classified as undernutrition. BMI of 25 to 29.9 is classified as overweight. BMI of 30 to 39.9 is obesity. BMI of 40 and higher is extreme obesity. | ||
| or See nomogram below. Also, see an interactive BMI calculator on the  website. website. | ||
 Estimate desirable body weight (DBW)
| TECHNIQUE | FINDINGS | |
|---|---|---|
| Calculate waist-to-hip circumference ratio | ||
| Using tape measure with millimeter markings, measure waist at a midpoint between the costal margin and the iliac crest. Then measure hip at the widest part of the gluteal region. Divide waist circumference by hip circumference to obtain the ratio. | EXPECTED:Ratio less than 0.9 in men and 0.8 in women. | |
| UNEXPECTED:Ratios of greater than 1.0 in men and greater than 0.85 in women indicate increased central fat distribution and increased risk of disease. | ||
| DETERMINE DIET ADEQUACY | ||
| 24-hour diet recall | ||
| Food diary | Use the MyPyramid guide at www.mypyramidtracker.gov to track and analyze individual eating patterns and to generate a dietary plan based on age, gender, and physical activity level. | |
| DETERMINE NUTRITIONAL ADEQUACY | ||
| Calculate estimates for energy needs | ||
| Use actual weight for healthy adults. | Calories | Kcal/kg |
| Weight loss | 25 | |
| Use adjusted weight for obese patients. | Weight maintenance | 30 |
| Weight gain | 35 | |
| Hypermetabolic/malnourished | 35-50 | |
| Estimate fat intake | ||
| 25% to 35% of the daily calories consumed should come from fat, with a distribution of less than 7% saturated fat, less than 10% polyunsaturated fat, and the rest in monounsaturated fat (U.S. Department of Health and Human Services and U.S. Department of Agriculture, 2005). | ||
| Estimate protein intake | ||
| An average of 0.8 g per kilogram body weight is sufficient to meet needs. Approximately 15% of daily calories consumed should come from protein. | ||
| Estimate carbohydrate intake | ||
| 50% to 60% of the total calories consumed should come from carbohydrates, with selections predominantly coming from complex carbohydrates including grains, fruits, and vegetables. | ||
| Estimate fiber intake | ||
| 14 g per 1000 calories consumed (U.S. Department of Health and Human Services and U.S. Department of Agriculture, 2005). In children ages 3 to 18 years, the formula “age +5 g” should be used to determine fiber needs. | ||
| SPECIAL PROCEDURES | ||
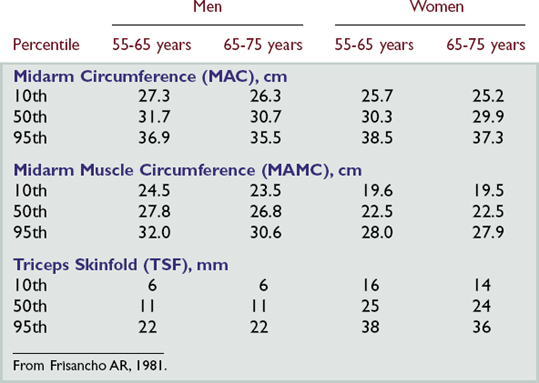
| Measure mid–upper arm circumference (MAC) | ||
| Place measuring tape around upper right arm, midway between tips of olecranon and acromial processes. Hold tape snugly and make the reading to nearest 5 mm. | EXPECTED:Between 10th and 95th percentiles. | |
| UNEXPECTED:Less than 10th or greater than 95th percentile (see table on p. 25). | ||
Stay updated, free articles. Join our Telegram channel

Full access? Get Clinical Tree


