Nonlinearities
OBJECTIVES
The reader will be able to:
- Define the following terms: autoinduction, capacity-limited metabolism, dose dependence, dose-dependent kinetics, inhibition by a metabolite, linear pharmacokinetics, maximum rate of metabolism, maximum rate of transport, mechanism-based autoinhibition, Michaelis-Menten constant, Michaelis-Menten kinetics, nonlinear pharmacokinetics, principle of superposition, saturability, saturable plasma protein binding, saturable facilitated transport, saturable first-pass metabolism, saturable metabolism, saturable tubular reabsorption, saturable tubular secretion, target-mediated drug disposition, time-dependent kinetics.
- List at least 10 physiologic processes of drug absorption, distribution, and elimination in which dose or time dependence is known to occur.
- Recognize dose- or time-dependent kinetics from either plasma or urine data showing such behavior.
- Given data showing nonlinear renal clearance, determine if saturable tubular secretion or saturable active tubular reabsorption is responsible for the kinetic behavior.
- Graphically depict the tendencies in the kinetic behavior of a drug when the situation and the cause of a dose or time dependence are given.
- On analyzing data in which a dose or time dependence occurs, identify which pharma-cokinetic parameters are affected, and assign probable causes to the observation.
- Demonstrate the kinetic consequences at steady state of a change in rate of input, Vm, or Km, of a low extraction ratio drug showing saturable Michaelis-Menten metabolism.
- Describe how saturable first-pass metabolism and saturable transport can occur, and discuss their kinetic consequences.
 n epileptic patient who has not responded to phenytoin after 2 weeks on 300 mg/day is observed to have a plasma concentration of 4 mg/L. Twenty days after the daily dose is subsequently increased to 500 mg, the patient develops signs of toxicity, nystagmus, and ataxia; the plasma concentration of phenytoin is now 36 mg/L. Why should only a 67% increase in daily dose give rise to a ninefold increase in plasma concentration? The answer lies in the dose-dependent metabolic behavior of this drug (provided adherence is not an issue).
Similarly, at a daily intake of 75 mg of ascorbic acid (vitamin C), the steady-state plasma concentration is 9 mg/L, whereas at a daily dose of 10,000 mg, the steady-state concentration is only approximately doubled to 19 mg/L in a study subject. The renal clearance of ascorbic acid is less than 0.5 mL/min at the plasma concentration of 9 mg/L, whereas the renal clearance is 21 mL/min at 19 mg/L, a greater than 42-fold increase for only a 171% increase in plasma concentration. Why is the increase in the steady-state concentration of ascorbic acid so small for a 133-fold increase in daily dose? Why is renal clearance increased at all? The answer to these questions again lies with the nonlinear behavior of this vitamin. Let us now address what nonlinearities are and how they come about.
DEFINITION OF NONLINEAR KINETIC BEHAVIOR
Normally, observations, such as plasma (or blood) concentration, unbound concentration, and amount of drug and its metabolites excreted in urine, all increase in direct proportion to dose, when drug is administered as a single dose or in multiple doses. Therefore, on correcting such observations for the dose administered, the values are expected to superimpose at all times. This is referred to as the principle of superposition. When superposition occurs, the pharmacokinetics of a drug is said to be dose-independent, or linear. When it does not, the pharmacokinetics is dose-dependent or nonlinear. In addition to a lack of su-perpositioning of dose-normalized observations, nonlinearity or dose-dependence can be defined as a change in one or more pharmacokinetic parameters with size of dose administered or dosing rate. The term nonlinear derives its name from the properties of the differential equation(s) needed to model the observed kinetic behavior. Dose-dependence refers to the condition in which parameter values depend on the dose administered.
There are many reasons why the principle of superposition may not hold. Among them are the administration of a drug by different routes (intramuscular versus oral), in different dosage forms (tablets versus capsules), or by different methods (intravenous [i.v.] bolus versus infusion). These are examples of dependencies on route, dosage form, and method of administration. They are not the subject of this chapter.
When there is a lack of superposition on administering a drug (by the same route, dosage form, and method) on separate occasions or a lack of predictability following repeated or continuous dosing, based on single-dose data, the drug is said to show time-dependent kinetics. One or more of the pharmacokinetic parameters must then be changing with time. Both dose-dependent and time-dependent behaviors are sources of variability in drug response—the reason for the placement of this chapter in Section IV, Individualization. Although relatively uncommon, such kinetic behavior occurs frequently enough in drug therapy to warrant particular consideration.
CAUSES OF NONLINEARITY
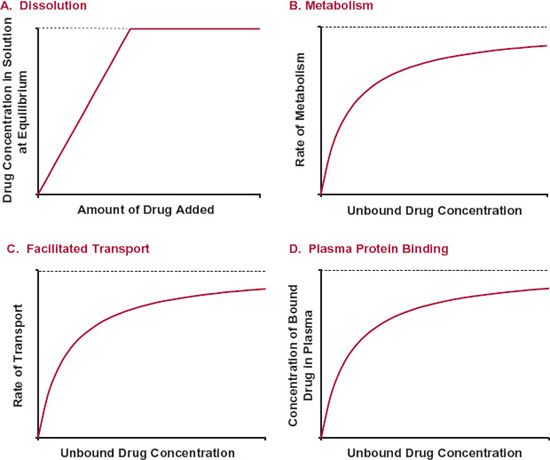
Nonlinear kinetics occurs when one or more processes of absorption, distribution, metabolism, or excretion are saturable. Saturability refers to situations in which the rate or extent of a process fails to increase in direct proportion to dose or concentration and approaches an upper limit. Figure 16-1 shows four different processes that exhibit saturability. For example, the concentration in an aqueous solution increases in proportion to the amount of drug added to a given volume until the solution becomes saturated. This concentration is called the solubility of the drug. Drug metabolism, facilitated transport, and plasma protein binding also can show a tendency to approach an upper limit (i.e., to show saturability). Let us now examine each of these saturable processes in greater detail.
SATURABLE PROCESSES
SATURABLE METABOLISM
Most of our present knowledge of enzymatically mediated metabolism is derived from studies in vitro in which substrate, enzyme, and cofactor concentrations are controlled. The Michaelis-Menten model, developed from in vitro data, can apply in vivo as well.
FIGURE16-1. Processes that show saturation characteristics include: A. Dissolution. The concentration in the solution has an upper limit, the solubility. No matter how much more is added to a given volume, the concentration remains the same. B. Metabolism. The rate of enzymatic metabolism approaches an upper limit as the substrate concentration is increased. C. Facilitated transport. The rate of transport by a facilitative transporter has an upper limit. D. Plasma protein binding. The concentration of bound drug is limited by the concentration of sites available for binding.
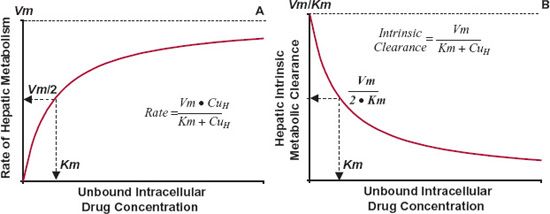
The curve in Fig. 16-2B is characteristic of hepatic metabolism of a drug by a given enzyme. The behavior displayed is typical of Michaelis-Menten kinetics, where the rate of formation of a metabolite approaches a maximum, Vm, by the relationship:
in which Km is a constant, the Michaelis-Menten constant and CuH is the unbound intracellular concentration of drug at the enzymatic site. The value of Vm is directly proportional to the total concentration of enzyme, and Km, with units of concentration, is an inverse measure of the affinity of the drug for the enzyme. The lower the value of Km, the greater the affinity. Note in Eq. 16-1 that a value of CuH equal to Km gives a rate that is one half the maximum; this is a convenient way of defining the constant Km. It is also, according to the Michaelis-Menten model, the drug concentration that results in the occupation of half of the enzyme sites. Drugs typically have Km values in the micromolar range. At unbound plasma concentrations well below Km, rate and concentration vary in direct proportion, a condition in which the kinetics is linear. At concentrations above Km, the rate approaches the value of Vm and the kinetics become nonlinear and show saturability.
FIGURE 16-2. A. When hepatic metabolism follows Michaelis-Menten kinetics, the rate of metabolism increases toward a maximum value, Vm, as the unbound intracellular drug concentration, CuH, is increased. The concentration at which the rate is one half the maximum is the Kmvalue. B. The intrinsic metabolite clearance falls with increasing intracellular concentration. The concentration at which intrinsic metabolic clearance is one half the maximum is also the Km value. The equations for the relationships are shown.
Because intrinsic metabolic clearance in the well-stirred model of the liver (see Chapter 5, Elimination) is defined as the rate of metabolism relative to the unbound hepatic intracellular concentration, it follows that
At low concentrations, Km >> CuH, the intrinsic clearance associated with the formation of the metabolite is nearly constant, maximal, and equal to Vm/Km, which is often the case in drug therapy. The kinetics of metabolite formation is then said to be linear in that intrinsic clearance is virtually independent of drug concentration. However, its value decreases at drug concentrations that approach or exceed the value of Km, producing nonlinear kinetics. This is shown in Fig. 16-2B.
SATURABLE TRANSPORT
A behavior similar to that of metabolism is also seen with facilitated transport of drugs. Transport occurs with the maximum rate, the transport maximum, Tm, and with a corresponding concentration at which the transport rate is one half the maximum, KT.
SATURABLE BINDING TO PLASMA PROTEINS
A similar model is used to model the nonlinear binding to plasma proteins, namely:
where n · Pt is the total concentration of sites available for binding, Pt is the concentration of the protein, and Kd (an inverse function of the affinity constant, Ka, presented in the protein binding discussion in Chapter 4, Membranes and Distribution) is the concentration producing half saturation of the total binding sites. The bound concentration then depends on the capacity, n · Pt, and affinity (Ka = 1/Kd) for binding.
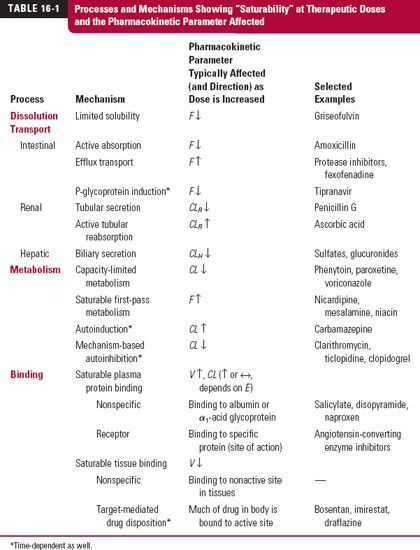
There are many physiologic processes that have a potential to exhibit saturability. Table 16-1 lists examples of representative processes together with the pharmacokinetic parameters affected. Let us now consider the processes by which drugs show nonlinear behavior in their absorption or disposition. For many of these processes, therapeutic implications and means of accommodating or circumventing the problems are discussed.
PHARMACODYNAMICS
Another saturable process is that of the relationship between response and systemic exposure. Indeed, pharmacodynamics is inherently nonlinear in nature as shown by the equations defining the models typically used to quantify drug response (Chapter 2, Fundamental Concepts and Terminology), namely,

This relationship is structurally analogous to the saturable kinetic processes previously discussed.
The reason pharmacodynamic relationships generally exhibit nonlinearity, while pharmacokinetic relationships do not, can be explained by the typical values of C50 relative to the values commonly encountered for Km (metabolism), KT (transport), and Kd (protein binding), as shown for Km in Fig. 16-3. Midazolam is an example. It is almost exclusively eliminated by CYP3A with a Km of about 3.3 μM, whereas its C50 (unbound) for sedation in humans is closer to 0.05 μM. This difference for drugs in general may partially be explained by the search for ever more potent agents, which, by definition, have lower values of C50. It also appears that to achieve a therapeutic response, the concentration of most drugs must be at or above the C50, where nonlinearity in response is expected. Occasionally, unbound therapeutic concentrations are at or above the values for Km, KT, or Kd (e.g., phenytoin and alcohol), because they are not very potent. For phenytoin, the Km and C50 values are comparable; alcohol is a rare example of a drug with a Km (about 100 mg/L) below its C50 value for depression of the central nervous system. Drugs (e.g., bosentan, draflazine, and imirestat) that exhibit target-mediated drug disposition are additional exceptions with comparable Km and C50 values. They are discussed later in the chapter.
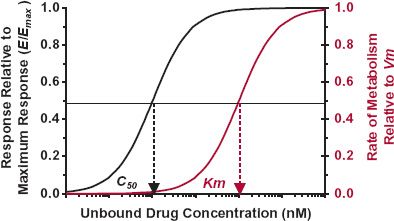
FIGURE16-3. Nonlinearity is common to drug response but less common to drug metabolism. This is a result of C50 values being below those of Km, based on the unbound drug concentration. As a result, the pharmacokinetics of drugs is generally linear because therapeutic concentrations are below those producing nonlinear metabolism.
NONLINEAR ABSORPTION
Dose or time dependencies in systemic drug absorption may be reflected by a change in either bioavailability or rate–time profile of absorption. These dependencies most often arise from three sources following oral administration. First are solubility and dissolution limitations in the release of drug from a dosage form in the gastrointestinal tract. Second and third are saturabilities in a transport mechanism or metabolism on passage across the gastrointestinal membranes and through the liver.
SOLUBILITY
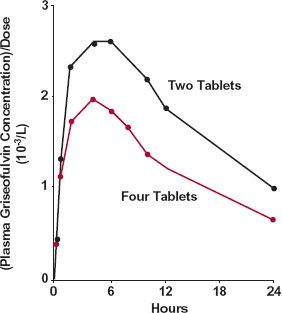
Dissolution can be the cause of dose dependency in bioavailability for drugs with low aqueous solubility, when given orally in relatively large doses. With a fixed transit time through the gastrointestinal tract, the amount of drug dissolved and hence absorbed is unlikely to increase in proportion to the dose administered. An example is griseofulvin (Fig. 16-4). For this sparingly soluble drug (solubility is about 10 mg/L), bioavailability decreases as the dose is increased from 250 to 500 mg.
FIGURE 16-4. Plasma concentration, normalized to dose, as a function of time following the oral administration of two tablets ( ) and four tablets (
 ) of ultra-micronized griseofulvin (125 mg/tablet). (From: Barrett WE, Bianchine JR. The bioavailability of ultrami-cronized griseofulvin (GRIS-PEG) tablets in man. Curr Ther Res 1975;18:501–509.)
SATURABLE ACTIVE TRANSPORT
For a few drugs, absorption from the gastrointestinal tract occurs by a capacity-limited transport mechanism. An example is that of amoxicillin, a polar β-lactam antibiotic. This drug is absorbed by a peptide transport mechanism in the small intestine. This conclusion is supported by the observation that bioavailability decreases with increased oral dose, but the peak time changes little (Fig. 16-5). The decrease in bioavailability, reflected by the decreased area under the curve (AUC) relative to dose, is explained by the capacity-limited nature of the transport process. The lack of a major change in the peak time is a consequence of the limited region in the small intestine from which absorption can occur. The dose size does not influence the time between ingestion and movement past the site of absorption.
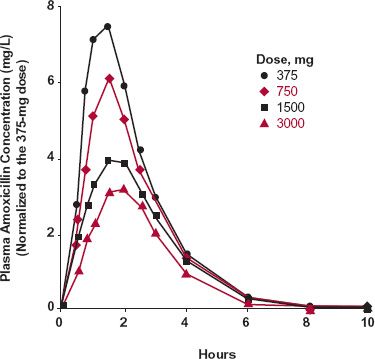
FIGURE16-5. Mean amoxicillin plasma concentrations after single oral doses of 375 ( ), 750 (
 ), 1500 (
 ), and 3000 (
 ) mg. The concentrations are normalized to those expected for a 375-mg dose (C = C[observed] × 375/Dose [mg]). Note the decrease in the Cmax and AUC values, and the similarity in tmax, on increasing the dose. The observations are explained by oral bioavailability decreasing with dose with little or no change in peak time. (From: Sjövall J, Alván G, Westerlund D. Dose-dependent absorption of amoxycillin and bacampicillin. Clin Pharmacol Ther 1985;38:241–250. Interpretation from: Reigner BG, Couet WR, Guedes JP, Fourtillan JB, Tozer TN. Saturable rate of cefatrizine absorption after oral administration to humans. J Pharmacokinet Biopharm 1990;18:17–34.)
SATURABLE FIRST-PASS METABOLISM
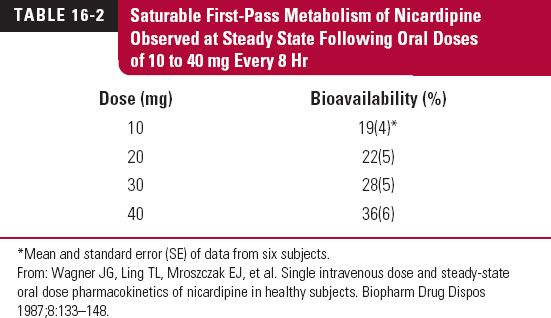
Nicardipine, a dihydropyridine calcium-channel blocker, exhibits dose dependence in its oral bioavailability (Table 16-2) because of saturability in its metabolism on first pass through the liver. The data in the table were acquired during an 8-hr dosing interval at steady state (3 days into regimen). An i.v. radiolabeled tracer dose (0.885 mg) was given concurrently with the 30-mg dose to determine oral bioavailability.
Saturable first-pass metabolism occurs for a number of orally administered drugs that are highly extracted by the liver or intestinal tissues. Additional examples were given in Table 7-5, Chapter 7, Absorption. For several of these drugs, dose dependence in oral bioavailability is observed without an apparent change in elimination half-life, as explained in the text of the chapter.
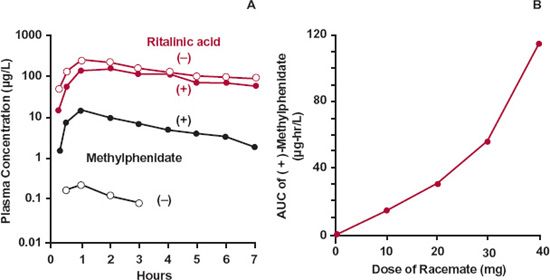
An interesting example of a drug that undergoes saturable first pass is that of methyl-phenidate. The drug is available in the racemic form, a mixture of the two enantiomers. Figure 16-6A shows the concentration of (+)-methylphenidate and (−)-methylphenidate after the oral administration of 30 mg of the racemate. The systemic exposure to the (+)-isomer is much greater than that to the (−)-isomer. Both enantiomers are extensively extracted during the first pass through the gut wall and the liver, but the fraction reaching the systemic circulation is much greater for the (+)-isomer (about 20%) than for the (−)-isomer (about 4%). Although the bioavailability of the (+) and (−) isomers are very different, the amounts of the corresponding ritalinic acid metabolites formed during the first pass and during elimination of absorbed drug are the same (top two curves of Fig. 16-6A), a topic further discussed in Chapter 20, Metabolites and Drug Response. Furthermore, it is evident in Fig. 16-6B that the first-pass metabolism of the (+)-isomer depends on dose administered, as the AUC increases disproportionally with an increase in dose, a consequence of saturable first-pass metabolism.
CAPACITY-LIMITED METABOLISM
Perhaps the most dramatic dose-dependent elimination mechanism is that of capacity-limited metabolism commonly well characterized by Michaelis-Menten–type kinetics.
FIGURE 16-6. A. The plasma concentrations of (+)-methylphenidate ( ), (−)-methylphenidate (
 ) and their respective metabolites, (+)-ritalinic acid (
 ), and (−)-ritalinic acid (
 ) after the oral administration of 30 mg of racemic methylphenidate hydrochloride to a volunteer. B. The relationship between the AUC of (+)-methylphenidate and dose following oral administration of 10, 20, 30, and 40 mg of the racemate to the same volunteer. No appreciable difference is seen for the metabolites. (From: Aoyama T, Kotaki H, Sasaki T. Nonlinear kinetics of threo-methylphenidate enantiomers in a patient with narcolepsy and in healthy volunteers. Eur J Clin Pharmacol 1993;44:79–84.)
The therapeutic consequences of Michaelis-Menten kinetics are now explored with two examples, alcohol and phenytoin. Both compounds rapidly permeate the hepatocyte and achieve distribution equilibrium, with unbound drug in the circulating plasma virtually equal to that in the hepatocyte. From Eq. 16-1 and letting Cu = CuH,

for a drug showing saturable Michaelis-Menten kinetics. Also, recall from Eq. 16-2 that in this case

ALCOHOL
At usual doses, the metabolism of alcohol becomes capacity limited and can be approximated by a Michaelis-Menten model with a single enzyme, alcohol dehydrogenase, responsible for its elimination. This simplified kinetic model is subsequently presented.
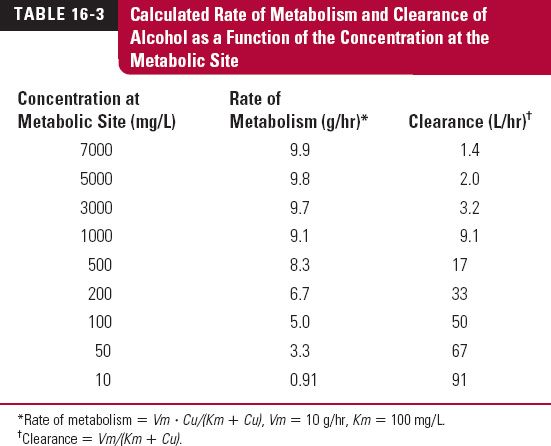
The maximum rate of metabolism, Vm, and the Michaelis constant, Km, are approximately 10 g/hr and 100 mg/L, respectively. The pharmacologic effects of alcohol, which does not bind to plasma proteins, become apparent when the plasma concentration is about 200 mg/L, concentrations above 5000 mg/L are potentially lethal. Thus, the concentration range in which alcohol exerts its pharmacologic effects is well above its Km. For comparison, the legal concentration above which one is said to be “driving under the influence” of alcohol in most countries is 800 mg/L (0.08 g/dL) or close to this value.
Table 16-3 shows the calculated rate of metabolism and clearance of alcohol as a function of the concentration at the metabolic site. Note that rate of metabolism of alcohol is essentially constant, zero-order, and close to Vm throughout the range of concentrations associated with activity. Accordingly, clearance decreases at high concentrations. At low concentrations, the intrinsic clearance (Vm/Km) approaches 100 L/hr or 1.6 L/min, a value in excess of hepatic blood flow. Thus, at very low concentrations, the extraction ratio is sufficiently high so that the rate of metabolism is partially limited by hepatic per-fusion. Under these latter conditions oral bioavailability is expected to be reduced.
The consequences of zero-order elimination can be dramatic. The usual-size drink, 45 mL, of 40% v/v whiskey contains about 18 mL, or 14 g, of alcohol. Drinking this quantity of alcohol each hour exceeds the capacity for its elimination from the body. Consequently, alcohol accumulates until ultimately either coma or death intervenes. The production of coma, by preventing further drinking, keeps the latter from being commonplace.
Alcohol distributes evenly throughout total body water without appreciable binding to either plasma proteins or tissue components; its volume of distribution is therefore about 42 L/70 kg. Accordingly, approximately 200 g of alcohol are needed in the body to achieve a concentration, about 5000 mg/L, that can produce death. But, since the rate of ingestion, 14 g/hr, exceeds the rate of metabolism, 10 g/hr, by only 4 g/hr, this rate of drinking must be maintained for at least 2 days (a total of 48 drinks) to accumulate 200 g of alcohol. This degree of accrual can occur within 5 hr (20 drinks) when four drinks are consumed every hour, because this rate of ingestion, 56 g/hr, exceeds the maximum metabolic capacity by 46 g/hr. The times given above are for the average person. People do vary in size and metabolic capabilities and therefore more conservative rules should be used to predict systemic exposures from alcohol ingestion.
If the rate of ingestion in the average person is reduced to one-half drink (or 7 g/hr), then, with respect to the effect of alcohol, the person can drink with virtual impunity as now shown. By definition, at steady state, rate of elimination matches rate of administration (or input), Ro.
or on rearrangement
Using the previously given values for Km and Vm and an Ro value of 7 g/hr, the plateau concentration of alcohol is 230 mg/L, which produces only a marginal effect.
Reflect on the preceding calculations. Chronically imbibing one half a drink of whiskey per hour produces little or no effect, but consuming one drink hourly would eventually become lethal. There can be no standard dosage regimen to maintain the effects of alcohol. Maintenance of effect requires titration of dosage with time to the effect itself.
The consequence of capacity-limited metabolism on the time-course of a drug in the body when input rate is changed is also demonstrated with alcohol. When alcohol is administered 10 min after ingesting water, light cream, or a glucose solution (80 g/240 mL), the plasma concentration–time profiles differ profoundly (Fig. 16-7). Compared to water, administration of light cream and 33% glucose, foods that delay gastric emptying, lower both AUC and peak concentration and increase time to reach the peak. These observations can be explained by the nearly zero-order metabolism at this dose of alcohol.
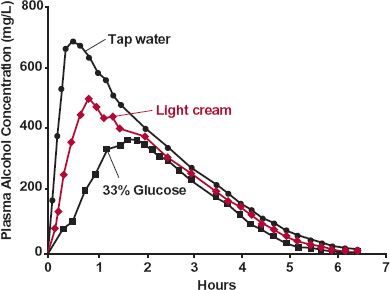
FIGURE16-7. A decrease in the absorption rate of alcohol, produced by slowing gastric emptying, causes peak concentrations and AUC to decrease and time to reach the peak to increase. The effect differs from that expected of first-order elimination kinetics by the observed decrease in AUC. This observation is explained by a constant rate of elimination at almost all concentrations, as illustrated schematically in Fig. 16-8. Alcohol, 45 mL of 95% ethanol in 105 mL of orange juice, was administered 10 min after 240 mL of tap water ( ); 240 mL of light cream (
 ); or 240 mL of a 33% glucose solution (
 ). (From: Sedman AJ, Wilkinson PK, Sakmar E, et al. Food effects on absorption and metabolism of alcohol. J Stud Alcohol 1976;37:1197–1214. Reprinted with permission of Journal of Studies on Alcohol, Inc., Rutgers Center of Alcohol Studies, New Brunswick, NJ.)
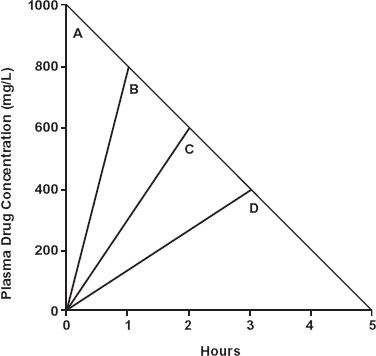
To emphasize the point, assume that both elimination and input are strictly zero-order, as shown in Fig. 16-8. Decreasing the input rate, for a given total dose administered, lowers AUC and peak concentration as well as increases the peak time. Clearly, oral bioavailability in the presence of zero-order elimination and variable input rates cannot be assessed by conventional area ratio methods.
PHENYTOIN
Therapeutic problems encountered with capacity-limited metabolism are classically exemplified by phenytoin. Typical Vm and Km values of this drug are 500 mg/day and 0.4 mg/L, although the values vary widely. The value of Km is usually expressed in terms of total, rather than unbound, concentration. Since fu is typically 0.1, the apparent Km for total concentration, Km’, is equal to 4 mg/L.
FIGURE 16-8. As a consequence of zero-order elimination, the plasma concentrations at the end of a 1000-mg dose of a drug by bolus injection (A) and constant-rate infusions of 1-hr (B), 2-hr (C), and 3-hr (D) durations are quite different from those expected with first-order kinetics. The amount in the body at the end of each infusion is the difference between dose and amount lost during the infusion period. Consequently, the concentration at the end of each of the infusions is the same as that expected at that time following the i.v. bolus dose. Note that the slower the input rate, the smaller is AUC and the lower is peak concentration. The time to peak is, of course, increased. Furthermore, if the dose had been infused over a 5-hr period (i.e., at 200 mg/hr) output would have matched input and there would have been no AUC in this hypothetical example.
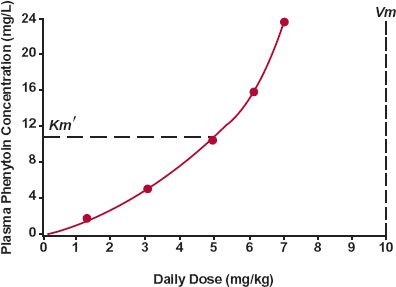
Plateau. Perhaps the most striking consequence of the kinetics of this drug is the relationship observed between steady-state plasma concentration and rate of administration, as shown in Fig. 16-9. A greatly disproportionate increase in concentration is observed in, and above, the therapeutic concentration range, 10 to 20 mg/L. As a result, the difference between the daily dose giving ineffective therapeutic concentrations, less than 10 mg/L, and that producing potentially toxic concentrations, above 20 mg/L, is narrow.
The observed increase in concentration can be explained by rearrangement of Eq. 16-6.
The consequences of Michaelis-Menten metabolism result when either the desired steady-state unbound concentration is above Km (Km ‘ for total concentration) or the rate of administration required to achieve these concentrations approaches Vm.
Because of its kinetics, only small changes in phenytoin input caused, for example, by a change in salt form (acid and sodium salt are used) or in bioavailability can produce relatively large changes in the steady-state concentration. To illustrate this point, consider a male patient with Km’ and Vm values of 3 mg/L and 425 mg/day, respectively, and who has an average steady-state concentration of 12 mg/L when taking 200 mg orally every 12 hr. On switching from his current dosage form (bioavailability = 0.85) to one with a bioavailability of 0.95, it is seen, by setting Ro = F · D/τ in Eq. 16-7, that the average steady-state concentration is expected to increase to 25 mg/L. Thus, a 12% change in bioavailability (0.85 to 0.95) causes a doubling (200%, 12 to 25 mg/L) in the steady-state concentration when the dosing rate approaches the Vm value.
FIGURE 16-9. The steady-state plasma concentration increases disproportionately with rate of administration (given twice daily) of phenytoin, a drug that is virtually eliminated by a single metabolic pathway that exhibits typical Michaelis-Menten enzyme kinetics. The estimated Vm, the maximum rate of metabolism, and Km’, the total plasma concentration at which the rate is half of the maximum (dashed line), are shown. All the data were obtained in the same individual whose Km’ and Vmvalues are considerably higher than the typical ones of 4 mg/L and 7 mg/kg per day. (From: Martin E, Tozer TN, Sheiner LB, Riegelman S. The clinical pharmacokinetics of phenytoin. J Pharmacokinet Biopharm 1977;5:579–596. Reproduced with permission of Springer.)
Time to Plateau.
Stay updated, free articles. Join our Telegram channel

Full access? Get Clinical Tree


